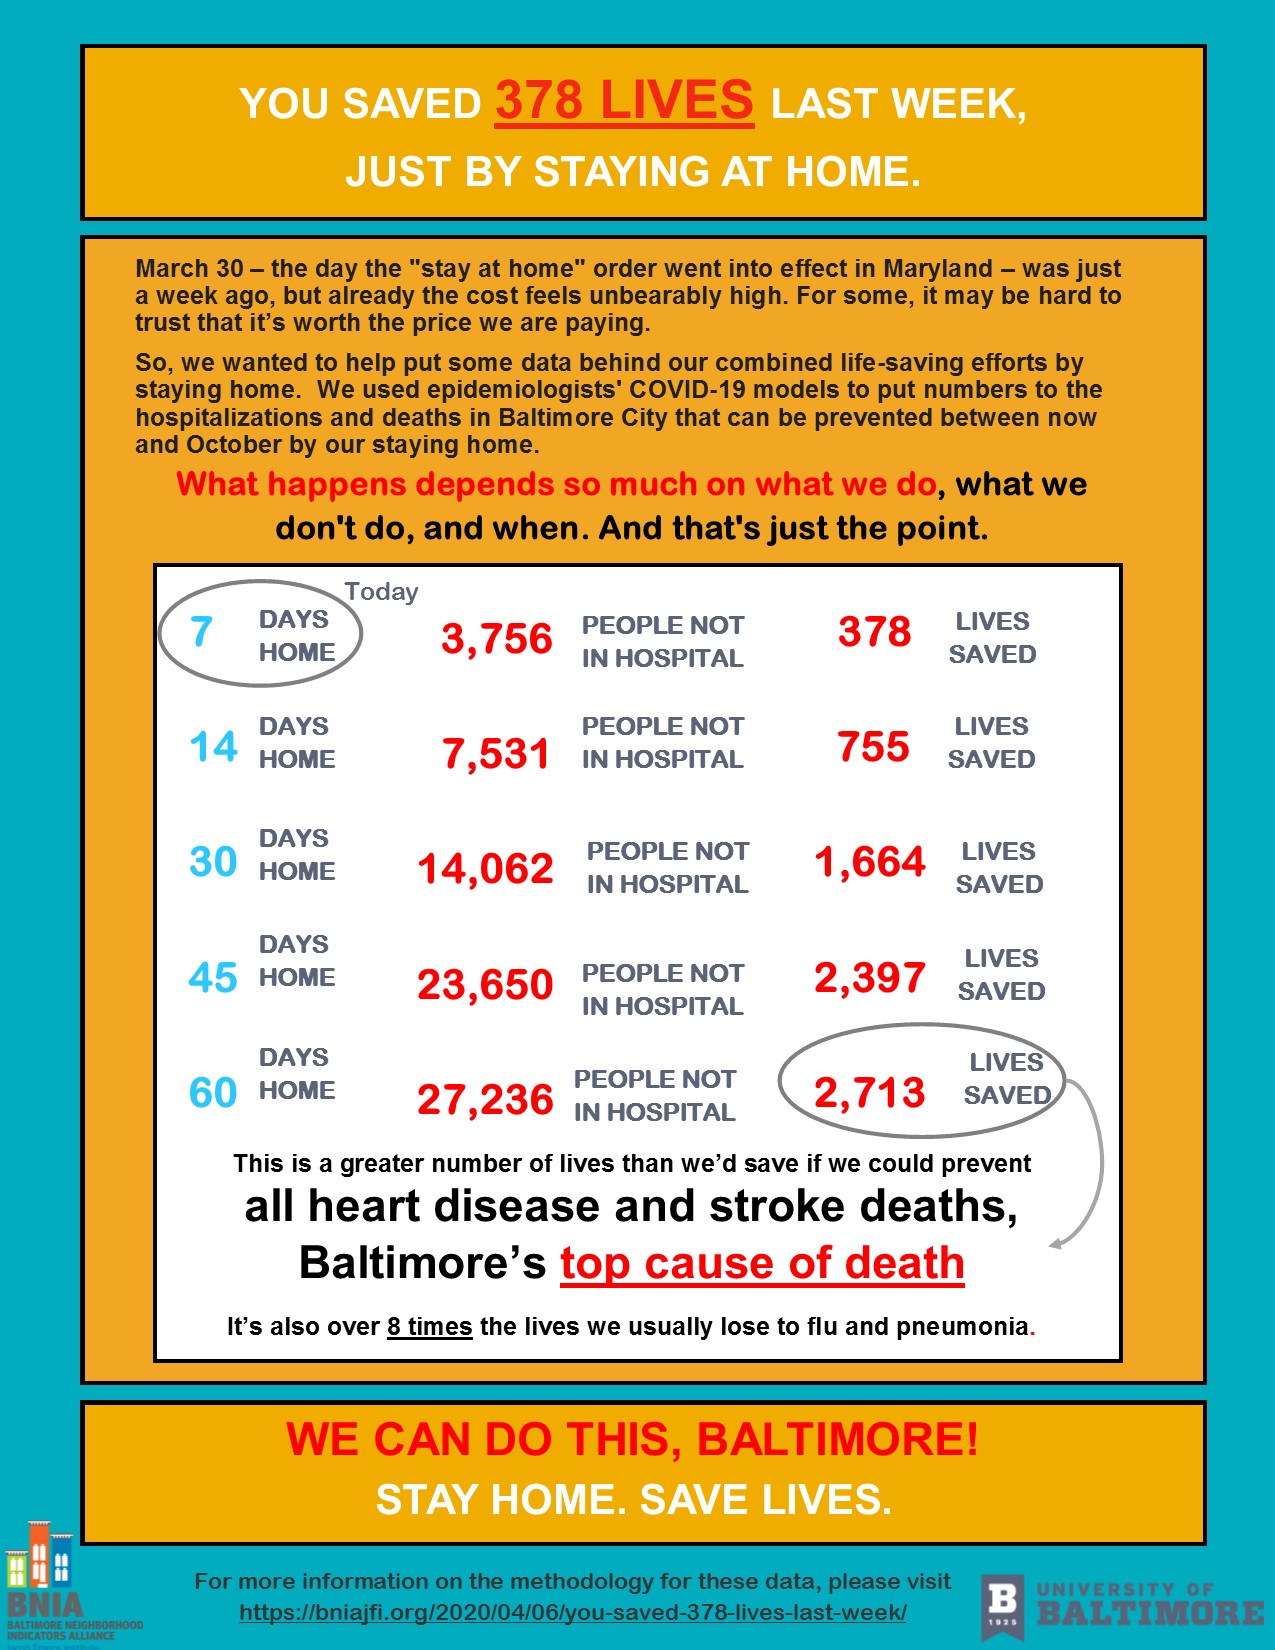
One week ago, on March 30, the “stay at home” order went into effect in Baltimore City and throughout Maryland. This was just a week ago, but with the news of so many coronavirus cases that continue to rise and the unprecedented amount of jobs lost, missing school days and social/sporting events cancelled, already the cost feels unbearably high. For some it may be hard to trust that it’s worth the price we are paying. So, we wanted to help put some data behind our combined life-saving efforts by staying home.
BNIA-JFI is part of the National Neighborhood Indicators Partnership (NNIP), a learning network of partners across the country with similar missions to provide reliable community-based information in their cities. Thanks to the great work of CI:NOW, the partner organization in San Antonio, Texas, we replicated their approach of using epidemiologists’ COVID-19 models to put numbers to the hospitalizations and deaths that can be prevented in Baltimore City between now and October by our staying home.
We know, though, that staying home physically and financially is a hardship for so many and not even a possibility for others. Every year, we issue the Vital Signs report and open data portal which unfortunately point to disparities across so many indicators that show the most vulnerable among us, particularly amplified at this moment:
Housing Insecurity
Well beyond the estimated 3,000 homeless persons, nearly 10% of all households in Baltimore are housing insecure. We have a waitlist of 14,000 applications for housing assistance, and the list is now closed to new applicants because the average wait time is more than five years.
In Vital Signs 17, the percentage of households paying more than 30% of their total household income on rent was 49.8%. The communities with the greatest percentage of renters experiencing rent-unaffordability were Belair-Edison (68.1%), Edmondson Village (64.5%), and Washington Village/Pigtown (63.4%).
Economic Insecurity
Too many of Baltimore’s working families are living in a state of persistent financial insecurity, one emergency away like the current pandemic situation from falling into debt or losing a home. In Baltimore City, 16.6% of family households live in poverty; however, more than 55% are liquid asset poor, which means they do not have enough savings to live above the poverty level for three months if they suffer an income disruption such as a job loss or medical crisis.
In Vital Signs 15, we worked with the United Way to report ALICE (Asset Limited, Income Constrained Employees) by neighborhood. In Baltimore City, 45% of households were living at or below the ALICE Survival Budget threshold. Financial hardship varies across the city, with the percentage of households with income below the ALICE Survival Budget threshold over 75% in Upton/Druid Heights, Oldtown/Middle East, and the Poppleton/ The Terraces/Hollins Market neighborhoods.
Lack of Digital Access
Lack of internet at home prevents 22.1% of households in Baltimore from being able to work, shop or access online educational resources for students from home. The communities with the highest percentage of households with no internet are Sandtown-Winchester/Harlem Park (39.9%), and Greenmount East and Midway/Coldstream (38.7%).
So we offer this infographic aware that it can’t tell the whole story or predict every possible future, nor can it ease any economic or personal hardships. But we hope it helps shed light on the preventative reality we are all doing to save lives by staying at home. We are heartened by the incredible ways that all Baltimoreans are stepping in to help each other and particularly grateful for work going on to literally save lives by our healthcare workers and first responders.
If you need help with immediate needs, here are some just some links to resources that can assist right now in Baltimore:
- Baltimore City Emergency Food Insecurity Response
- United Way of Central Maryland 211 Hotline
- Mayor’s Office of Employment Development
- Baltimore Community Foundation COVID 19 Fund
- Maryland COVID-19 Emergency Relief Fund Programs for Businesses
Click on the image or here for the full-size pdf version.
We are so grateful to Laura McKieran and the CI:Now board members who helped develop and disseminate the methodology behind these data.
Explore our new COVID-19 Open Data Portal
For more information, contact us as bnia–[email protected].


