By: Amivi Atsu
The Process
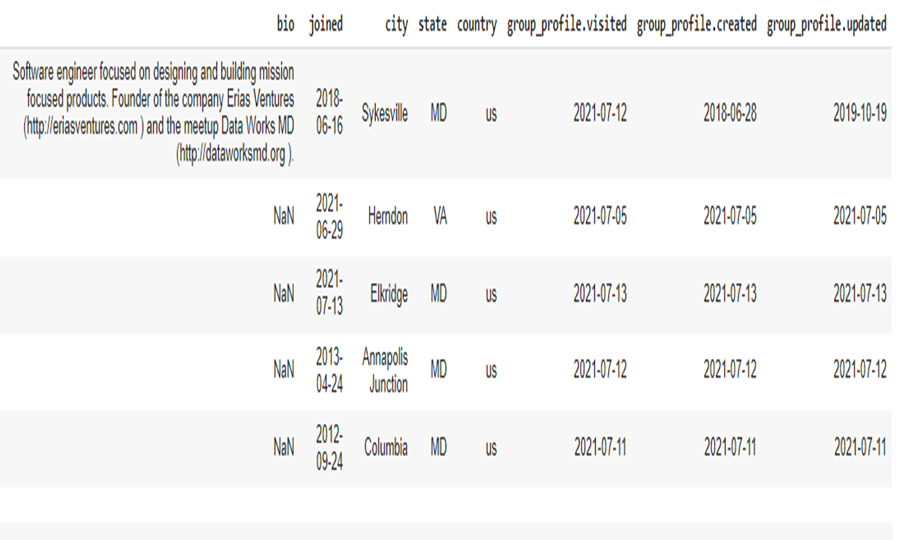
Meetup API was very helpful in getting data such as the number of members per country, per state, per city. It was also helpful in getting data about the additional number of members that DWMD had every year, the creation date of their meetup account, and the day they joined DWMD Meetup group. Meetup API also provided the name of similar groups that cater to the Data community. It was also possible to get other data-related groups that DWMD’s members are also part of. However, Meetup API was limited in providing very important reports such as who unfollowed the group, less active members, a detailed report on all the events organized by DWMD and the attendance, number of DWMD events that members attended. I went around those limitations by getting broad reports from Meetup API, and then I saved those reports as Excel sheets. From those Excel sheets, I was able to use the filter options and get the data that I truly needed. For some of those reports such as the different events, the date, and the attendance, I had to look on the meetup pages and manually enter the information in an Excel sheet, to produce a graph for visualization purposes.
My Findings
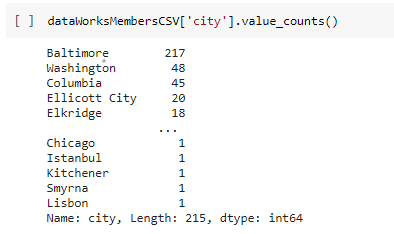
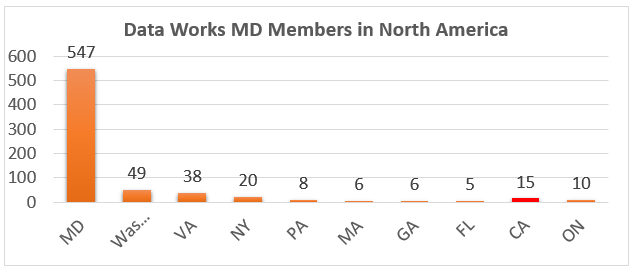
Members: DWMD has members all over the world, however Baltimoreans have the highest attendance at the group’s events. Few members in remote locations such as California, New York, and Canada have been consistently attending DWMD’s events, especially since the COVID crisis started and the events went virtual.
I found that about 50 members were consistently active and frequently interacted on DWMD’ s Meetup platform. Their activity level was determined by the frequency of them attending DWMD’s events, the comments, or questions they posted, the last time they visited the Meetup page. The attendance by itself, although very important is not a strong measure of members’ activity, because members can RSVP for an event, but not attend it. Some members could attend an event even though they have not RSVP’d beforehand. A better way to gauge members’ activity and interaction is to besides checking the attendance on the Meetup page, to also analyze the last day the members visited DWMD meetup page, and the comments they posted, if they posted any.
Side note: DWMD appears to have a strong women demographics, based on the data I collected.
Groups: DWMD’s members are also active members in other Meetup groups that focus on topics related to artificial intelligence, the relationship between data science and healthcare, JavaScript, Python, the learning of code, preparing for a career in tech, data visualization, and statistical skills.
Some data-related Meetup groups that are really popular among DWMD members are: Maryland AI (Baltimore), Baltimore AI (Baltimore), Baltimore Techies for Good (Baltimore), Kick-Off a Career in Tech (Baltimore). As we can notice, those Meetup groups are located in Baltimore, so they are very convenient to Baltimoreans. There is a possibility that those particular groups are popular, because of the topic and quality of their event. Finding that out will require a quick data exploration of those Meetup groups.
Other groups that are very popular among DWMD’s members but that are not located in Baltimore are: Data Science (Washington, DC); Statistical Seminars (Washington, DC); DataKind (Washington, DC); Data Visualization (Washington, DC). Many DWMD’s members are also members of women-related data groups. This suggests that DWMD has a large number of women as members. All those groups mentioned above organize events once or twice a month – Just as DWMD does.
Events: Attendance during the Covid19 crisis rose quite a bit. This is not surprising given that memberships increased during that period. Online events during the Covid19 lockdown had slightly higher attendance than the in-person events, however, the members attending those online events were a different crowd.
Conclusion and charts
It was noticed that two members have two accounts. One of the members is an officer of DWMD. The other account only has a first name, while another account has the same first name with a last name. That account could belong to the same person. Also, some accounts have aliases as names – It is important to keep that in mind when creating reports about the meetup group, to avoid counting a member twice.
Some reports that were pulled from the Meetup API returned only records of 800 members. After searching for why that is, the assumption was made that those 800 members are the ones who have relevant interactions with the Meetup page. The rest of the members may have no interaction at all, that may be why Meetup API could not gather any info on them.
Overall, Meetup API was a great skill to learn and a great tool to use. Meetup API is a very good starting point. It could give very important information, that would need to be transferred to an Excel worksheet and filtered to retrieve the needed information.
Working on this project gave me some insights into writing codes, using pythons, running queries etc. It was fun and it definitely motivated me to learn more about the IT world. I even joined several Data related groups, and plan on attending events where I could learn about coding, machine learning, cyber security and more. It was eye opening, and I am glad that I was able to learn some data related skills and to apply some of them to this project and Data Works MD. I am truly grateful to BNIA and DWMD for this opportunity.
Below are some of the queries that I ran using Python and some of the charts that I made based on some findings. Please, see the main Data Exploration – DWMD document for more information, table, and charts.


