By Ibraheem Sule
Introduction
Mental disorders are among the most common, chronic, and disabling health conditions, affecting all Americans in some way. Although these disorders have clear biological correlates, they are also significantly influenced by modifiable social, economic, and environmental conditions that affect not only individuals but entire communities, neighborhoods, and populations.
In addition, mental health has been included in the United Nations Sustainable Development Goals. However, it is unclear to what extent these goals address the major social determinants of mental disorders.
Many theories have been proposed in the past to help explain the origins of disease. During the nineteenth century, miasma theory attributed the causes of disease epidemics to “bad air,” leading to a focus on public health interventions to improve population living conditions as a means of effectively limiting disease incidence and prevalence (Crick et al., 2018). Although it was later supplanted by the germ theory of disease, this theory was one of the first to support the role of social factors in causing and maintaining illnesses. Furthermore, the miasma theory has resulted in significant public health interventions, such as urban sanitation. It is frequently associated with distress or impairment in critical areas of functioning. There are numerous types of mental disorders.
A diverse set of individual, family, community and structural factors may combine to protect or undermine mental health at any given time (Crick et al., 2018). Although most people are resilient, those who are exposed to adversity, such as poverty, violence, disability, or inequality, are at a higher risk. Individual psychological and biological factors, such as emotional skills, as well as genetics, are both protective and risk factors. Changes in brain structure and/or function influence many of the risk and protective factors.
Objective
The goal of this project is to examine how social activities contribute to mental health in the city of Baltimore. Some of the social activities considered include indicators such as crime rate, unemployment rate, household income, and assessment of healthy food in the city. The following is a list of some of the analyzed indicators that are thought to have an impact on people’s mental health.
- Rate of shootings
- Juvenile Arrest Rate for drug-related offenses
- Rate of arrest
- Rate of common assault calls
- Rate of gun homicides
- Percent of Population 16-64 that is Unemployed
- Unemployment Rate
- Average Healthy Food Availability Index
Data Sources/Layers
There are two data sources for this project;
- The Baltimore Neighborhood Indicators Alliance (BNIA) provided the social determinants indicators
- The city’s mental health which is bad if lasted more than 14 days among adults data for 2020 were obtained from the Centers for Disease Control and Prevention website
The process
SQL to compile all the social activity indicators’ data, the first step was to do data cleaning by looking for outliers and identifying data that did not conform to the main objective. The team then runs the necessary analysis using Google Colab’s pandas extension. Some Excel functions were also used to analyze the data set in order to determine the outcome of the analysis. The results demonstrate and put some insight on the impact the considered ed social activities on mental health in the considered city
Discussion / Visualization
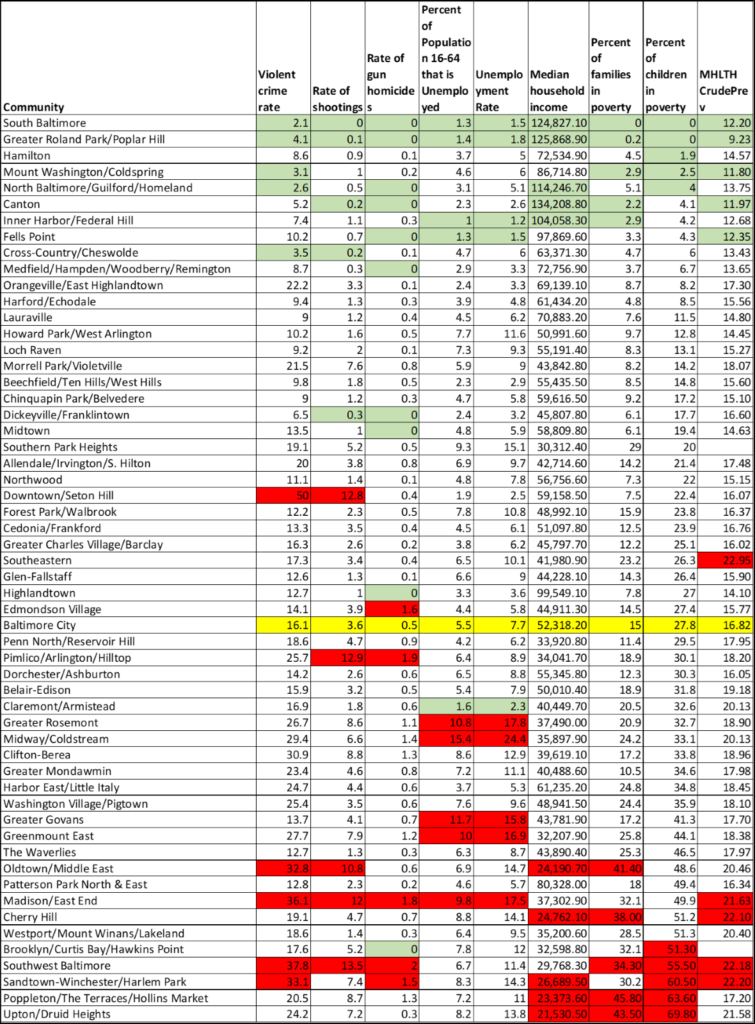
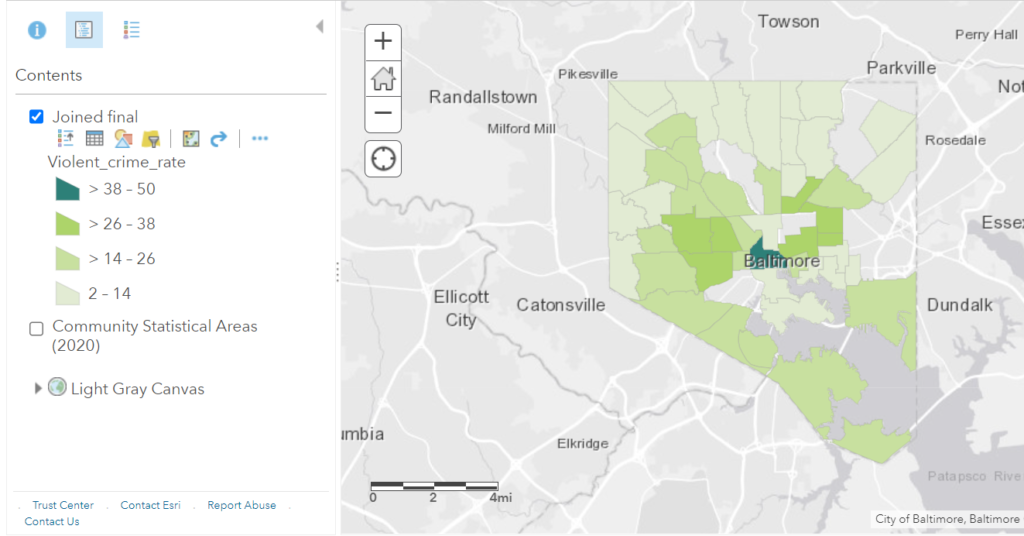
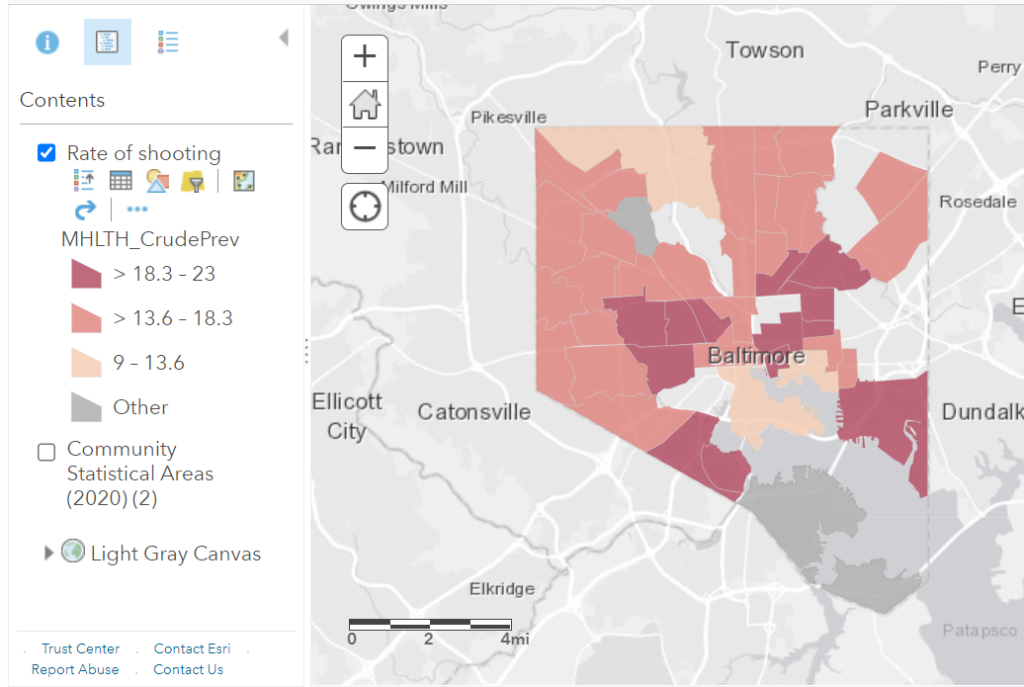
Starting with the violent crime rate, the analysis revealed communities with the lowest crime rates (South Baltimore, North Baltimore, and Mount Washington) which correlate to minimal impact on the communities mental health, with 12.20, 13.75, and 11.80, respectively. While Southwest Baltimore appears to have the highest crime rate (50%) and thus correlates to high mental health issue (22.18). The city had a violent crime rate of 16.1%.
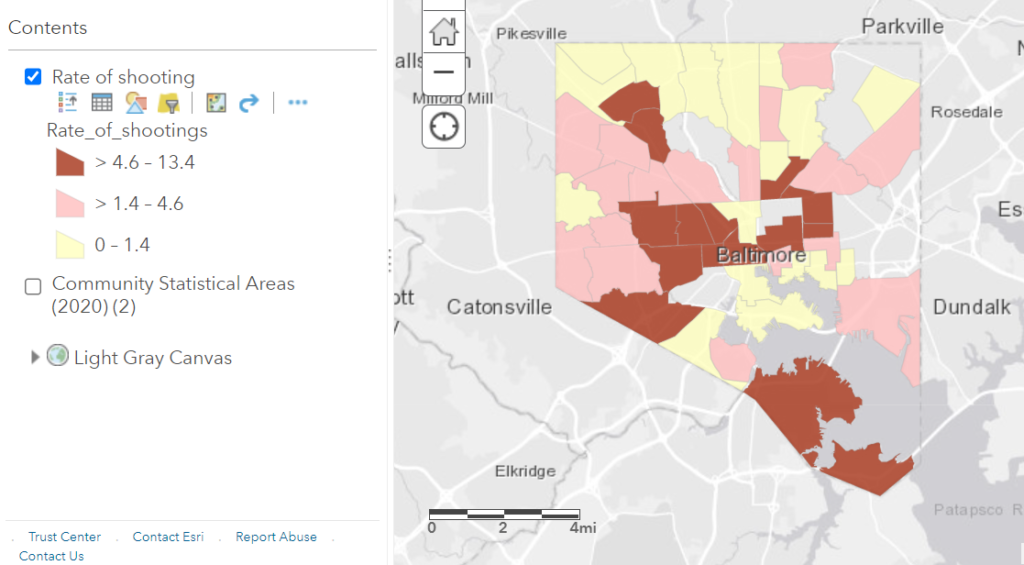
Southwest Baltimore had a 13.5% victim-high rate of shooting, while the shooting rate in the city was at its lowest in South Baltimore and Greater Rolland Park, both of which had no cases of shooting reported. Baltimore City as a whole was not quite affected by the shooting rate, with less than 10% of shooting cases reported in more than 80% of the community.
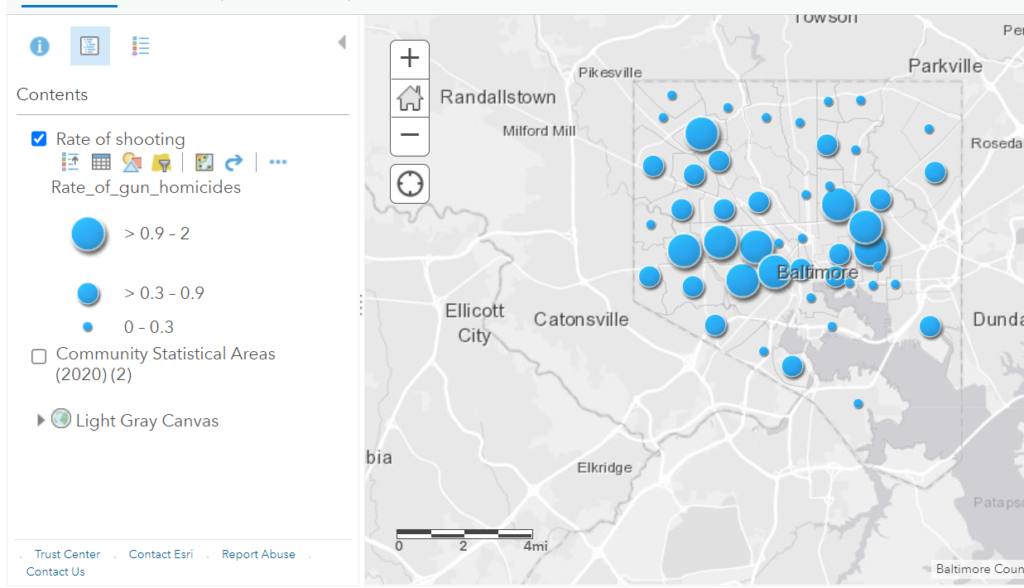
The city’s gun homicide rate was low, with the highest data recorded being 2% (for Southwest Baltimore) and 83% of the communities posing with less than 1% values. This demonstrated the ineffectiveness of gun homicide in Baltimore, where the city recorded a 0.5% rate of gun homicide. Further deep dive shows 10 communities have no gun homicides which are South Baltimore, North Baltimore/Guilford/Homeland, Greater Roland Park/Poplar Hill, Canton, Dickeyville/Franklintown, Medfield/Hampden/Woodberry/Remington, Fells Point, Highlandtown, Midtown and Brooklyn/Curtis Bay/Hawkins Point. Cross-Country/Cheswolde, Hamilton, Loch Raven, Northwood, Glen-Fallstaff and Orangeville/East Highlandtown have 0.1% of gun homicide rate. Mount Washington/Coldspring, Patterson Park North & East, Greater Charles Village/Barclay racked up 0.2%. Sandtown-Winchester/Harlem Park, Edmondson, Village, Madison/East End, Pimlico/Arlington/Hilltop and Southwest Baltimore are the communities with the highest rate of homicide with 1.5%, 1.6%, 1.8%, 1.9% and 2% respectively. The homicide rate shows a worrying trend as 82% (46) of the community have at least one death.
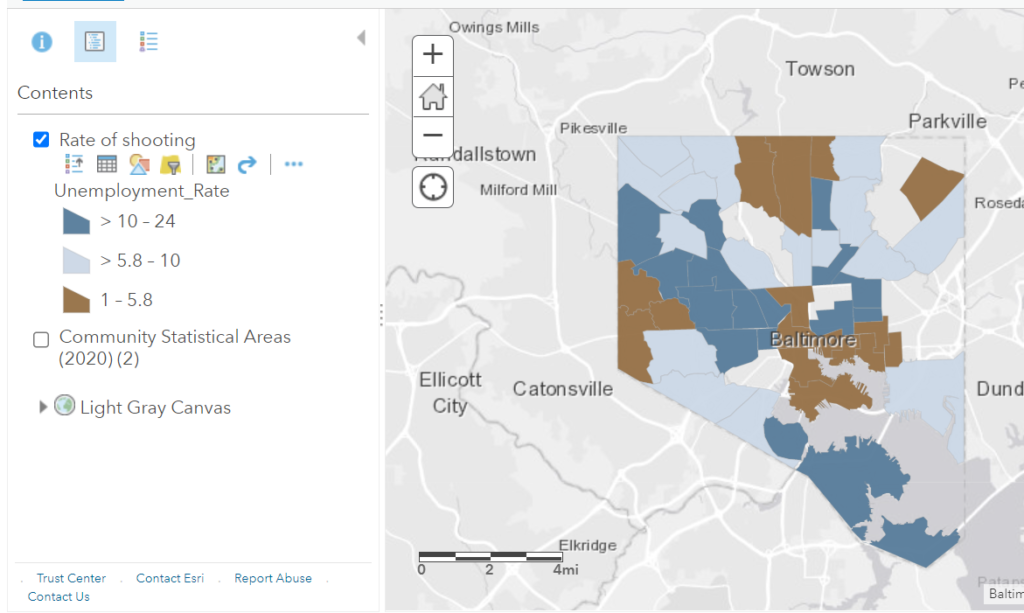
Midway/Coldstream (15.4%) and Greater Govans (11.7%) have the highest percentages of unemployed 16-64-year-olds, contributing to the city’s overall unemployment rate of 7.7% for all age groups.
Poppleton/The Terraces/Hollins Market has the highest percentage of families and children in poverty, at 45.8%. Furthermore, Southwest Baltimore (34.3%) was identified as one of the communities with a high poverty rate, while the city’s figure was 27.8%. The poverty rate appears to be one of the critical factors contributing to Baltimore’s high rate of people reporting poor mental health.
Conclusion
Baltimore City was most affected by the violent crime rate and the proportion of families in poverty, which are 16.1% and 27.8%, respectively, resulting in 16.82% of city residents reporting at least 14 poor mental health days for adults across the communities. The city’s main determinants of social health are violent crime rate and poverty rate, as all five communities (Oldtown/Middle East, Sandtown-Winchester/Harlem Park, Madison/East End, Southwest Baltimore, Downtown/Seton Hill) with the highest crime rate have very high mental health issues, as do communities with the lowest poverty rate.
REFERENCES
Crick, L. , Carrie, B. , Florence, B. , et al. Social determinants of mental disorders and the Sustainable Development Goals: a systematic review of reviews, 2018
