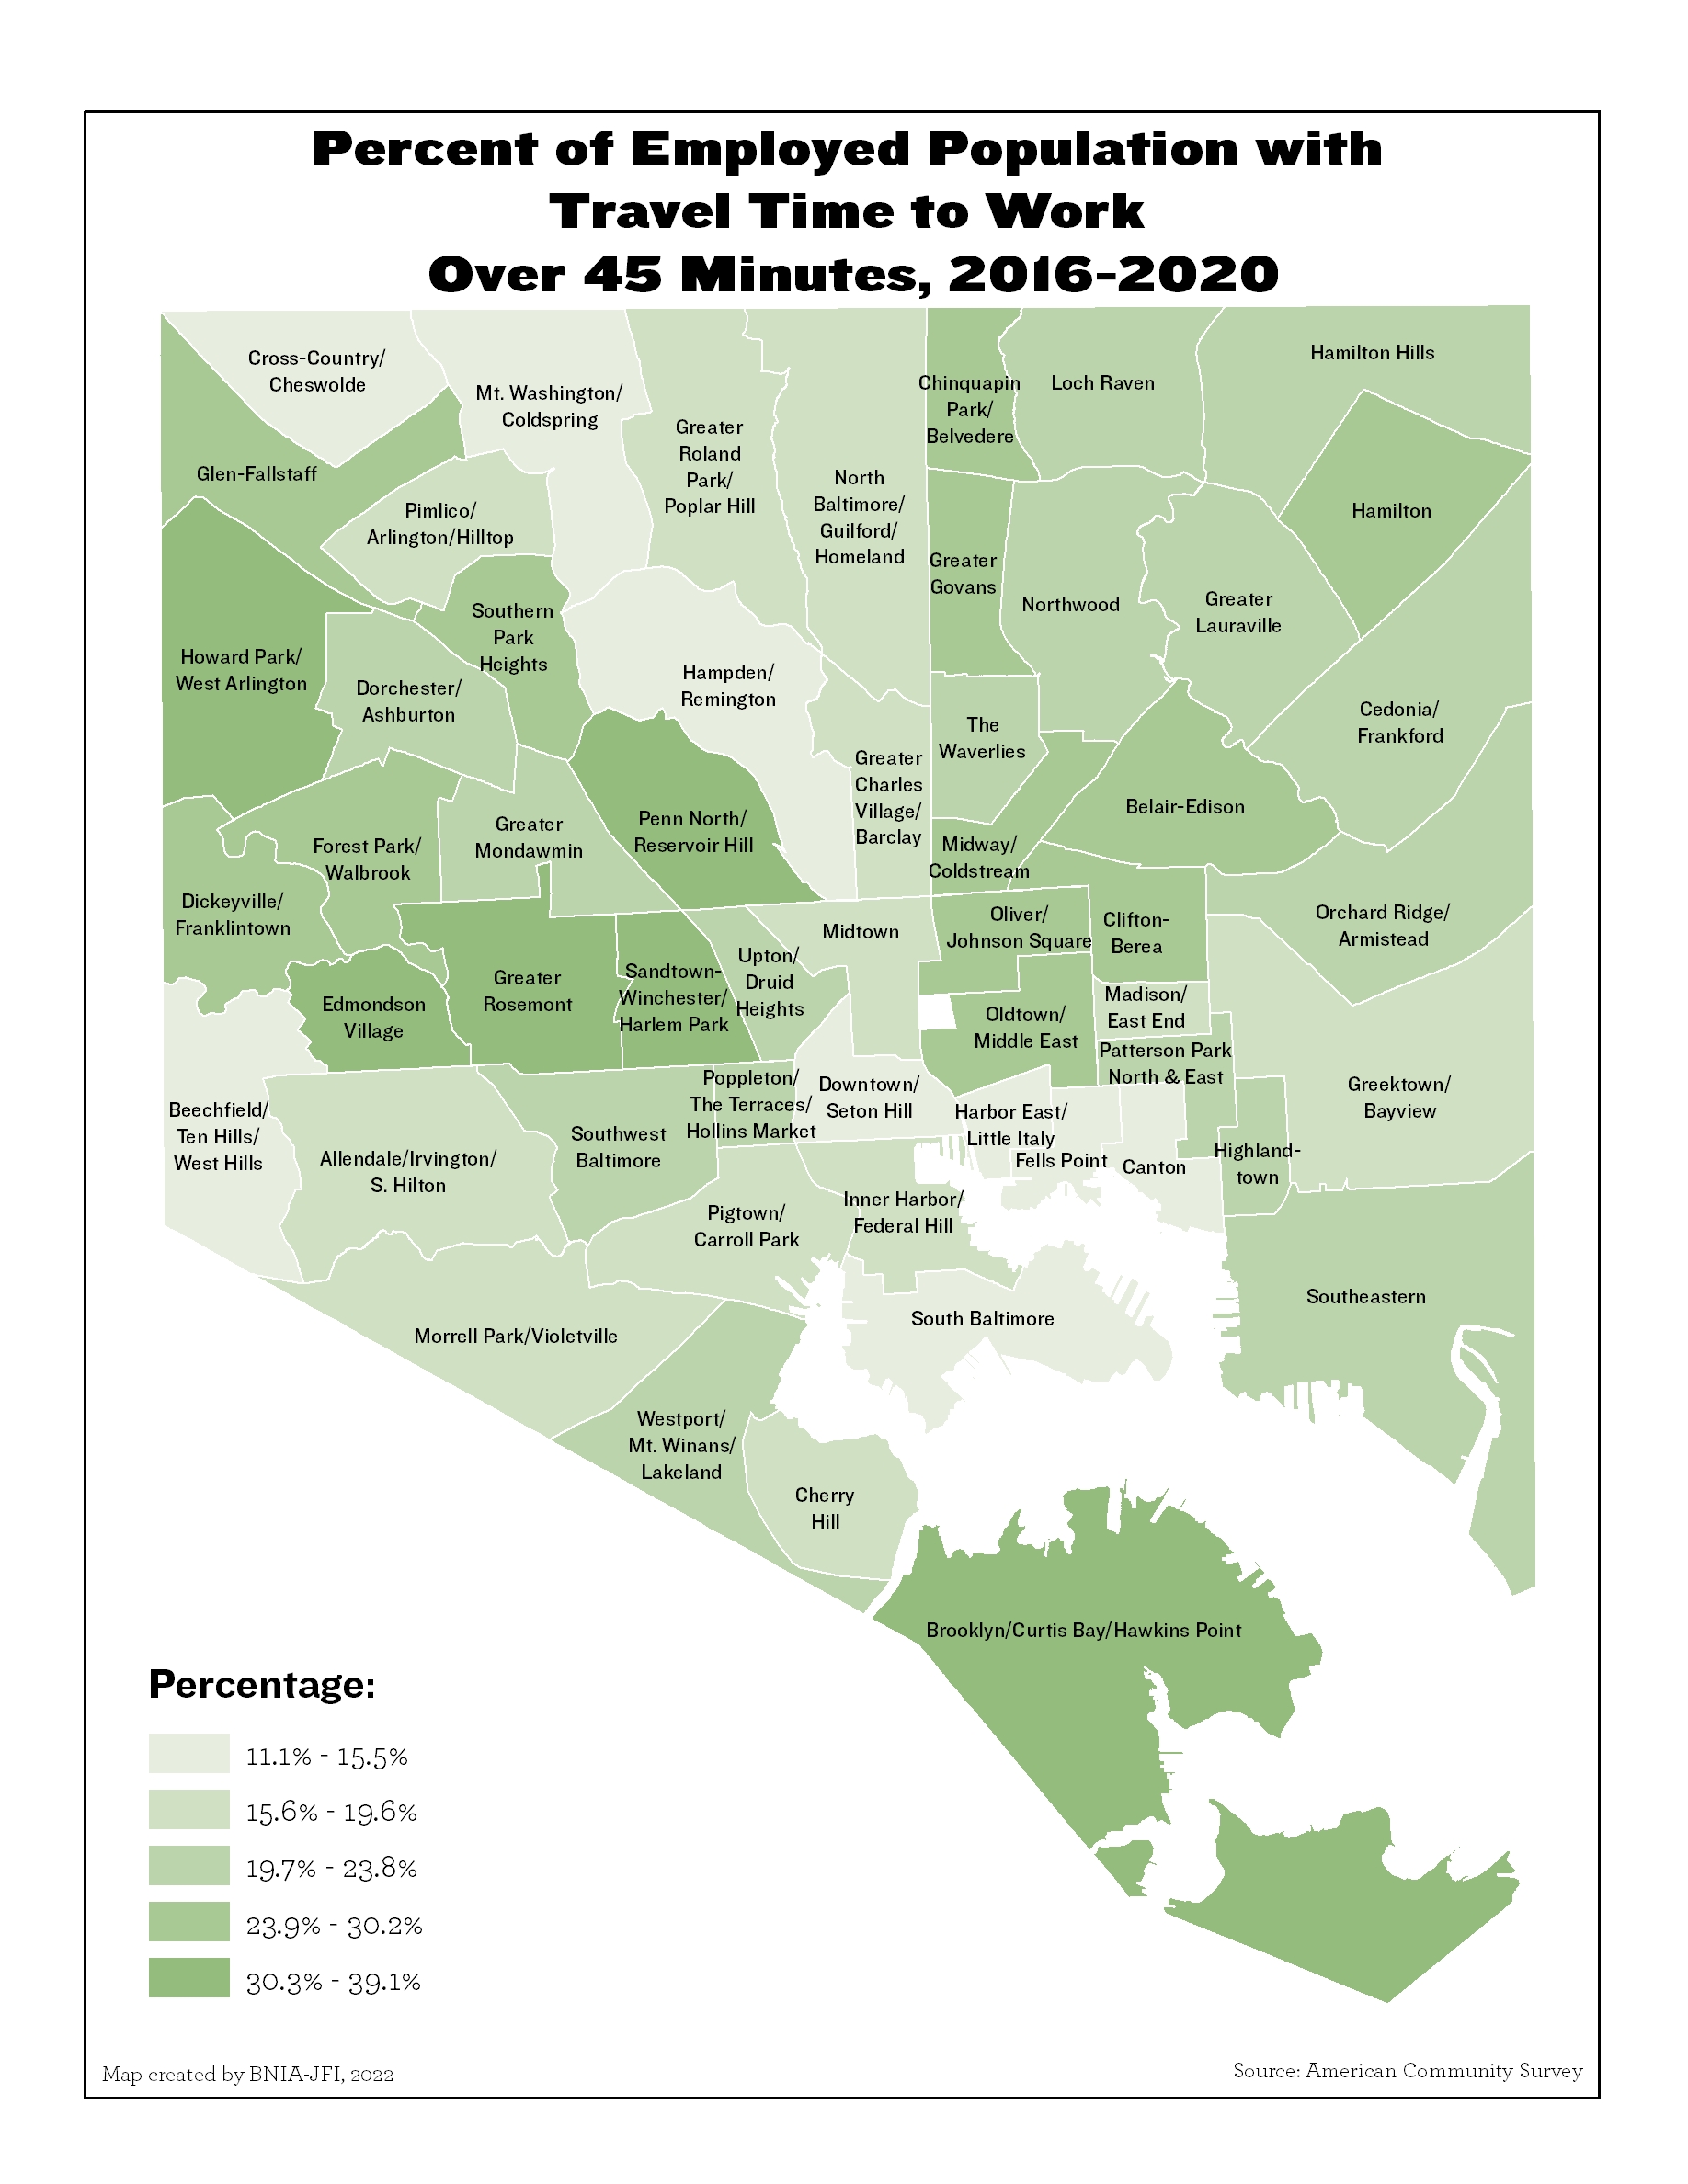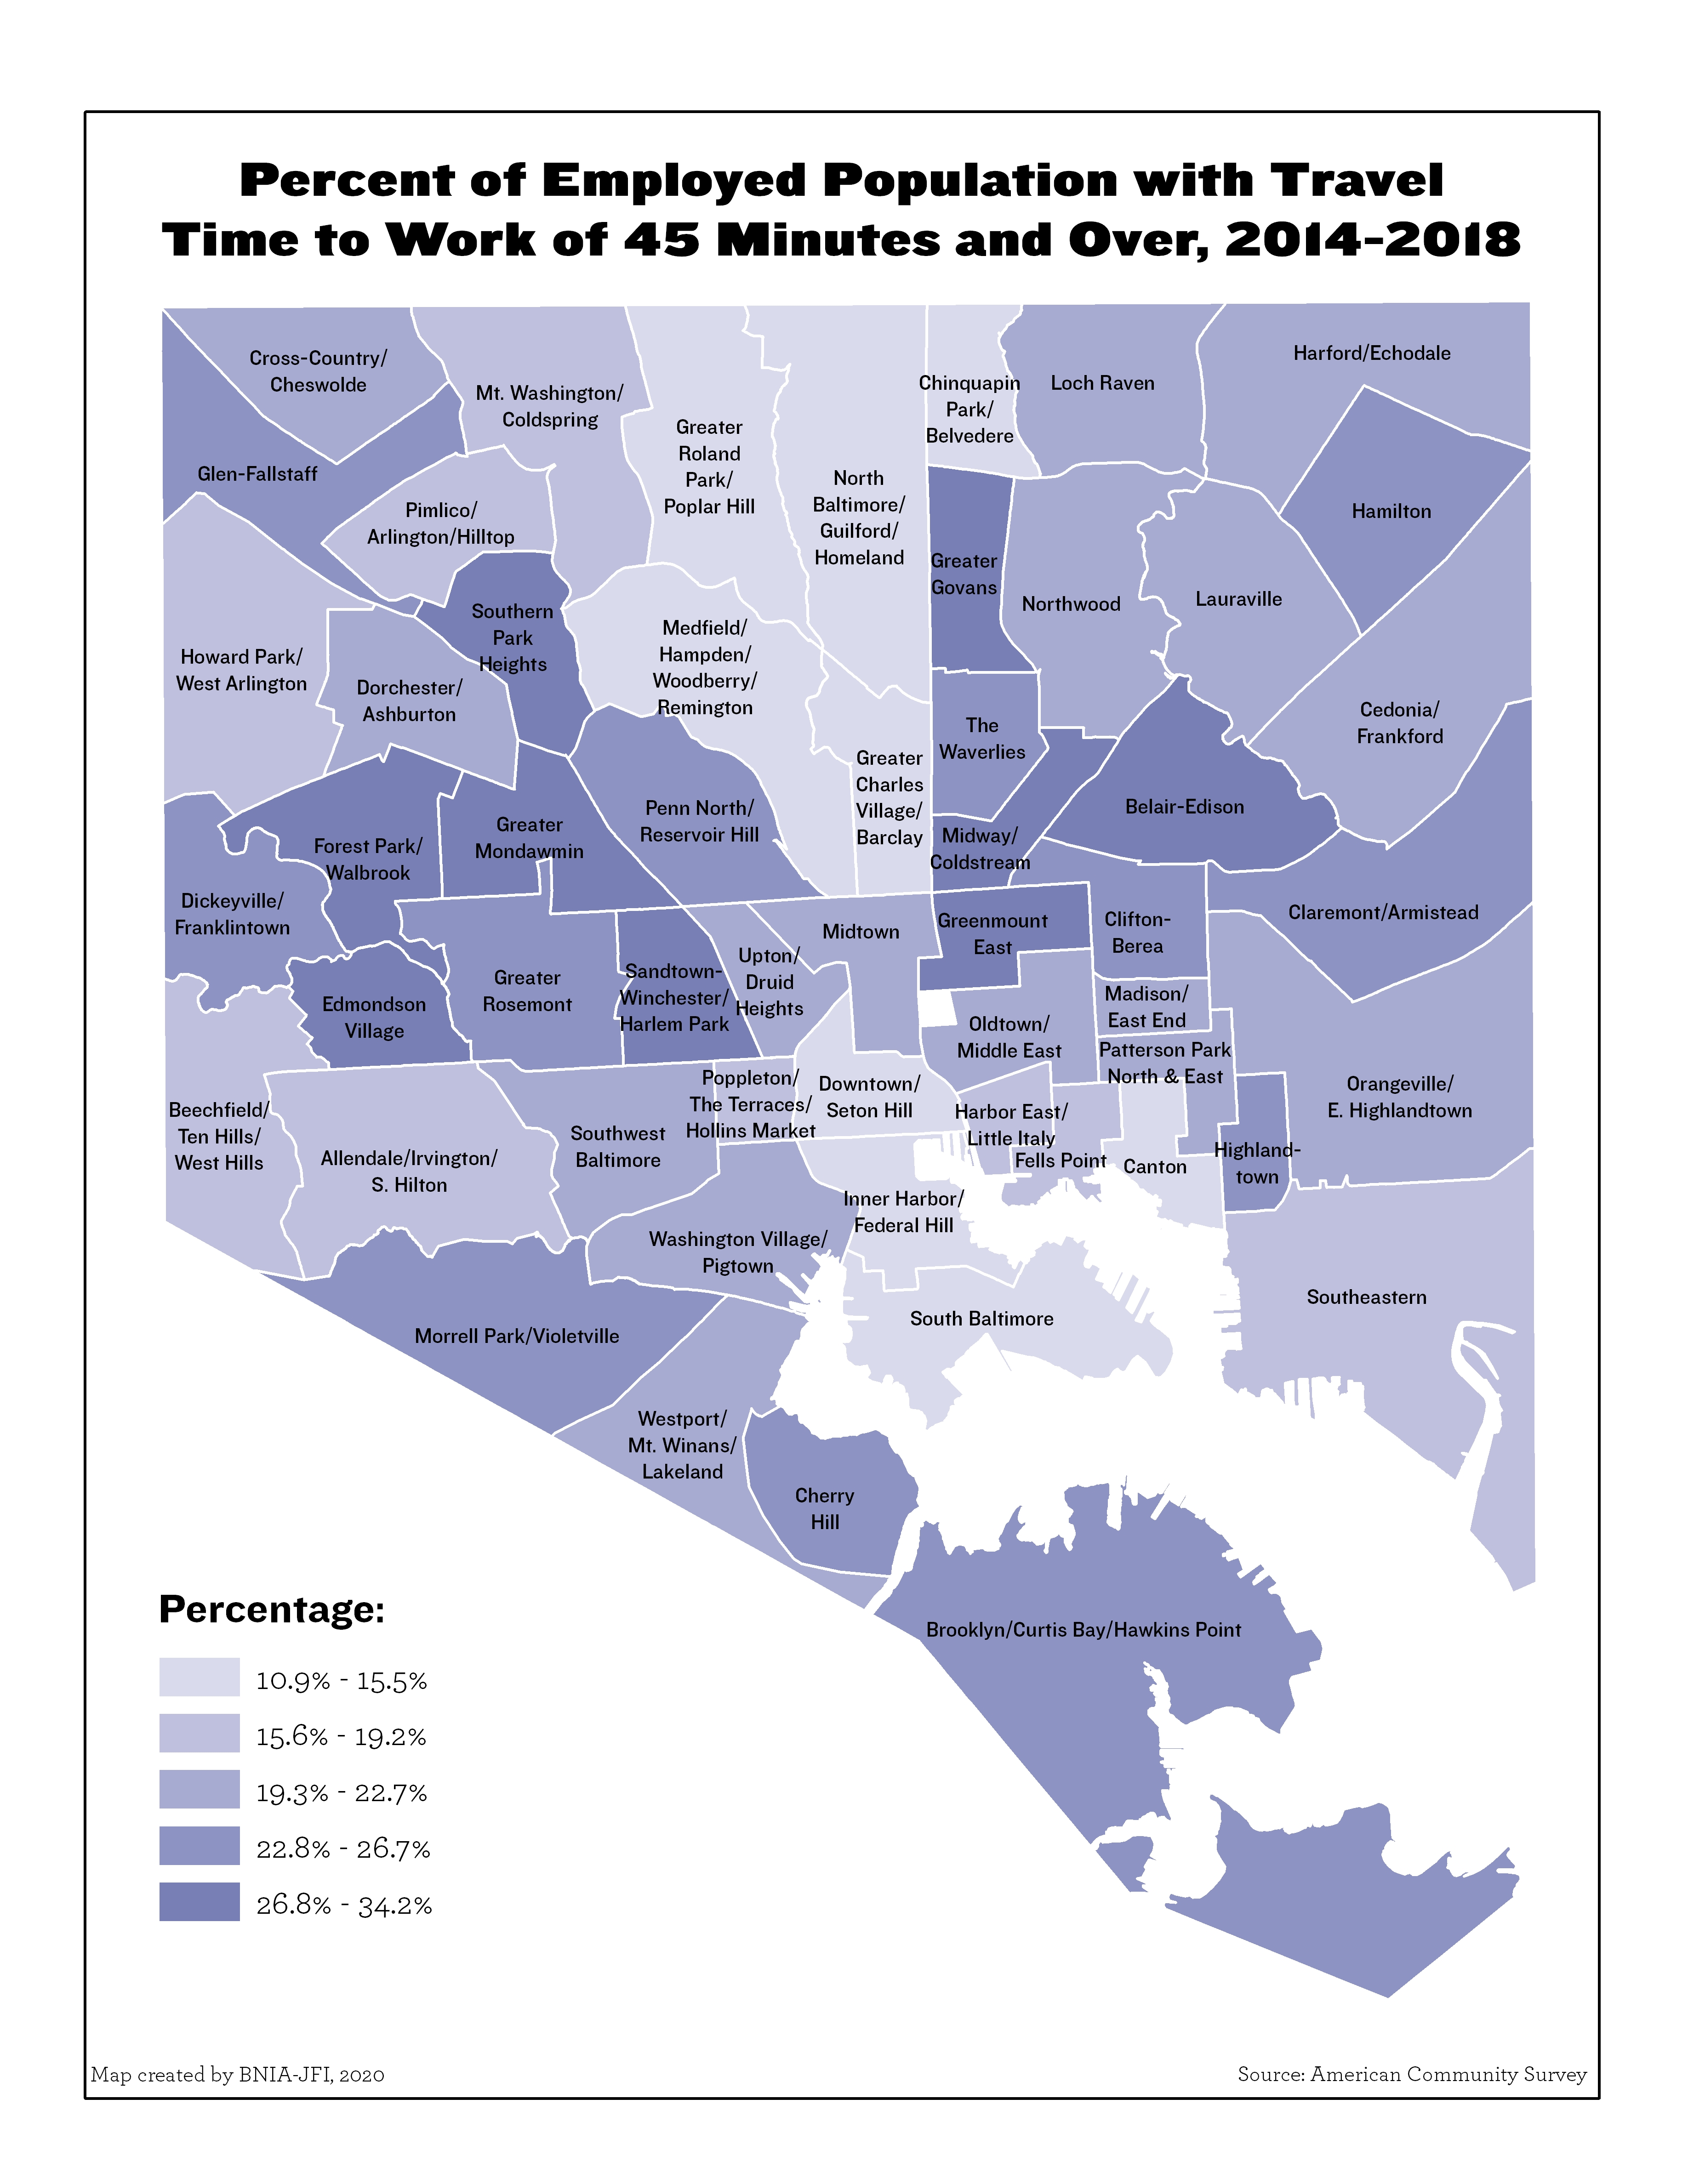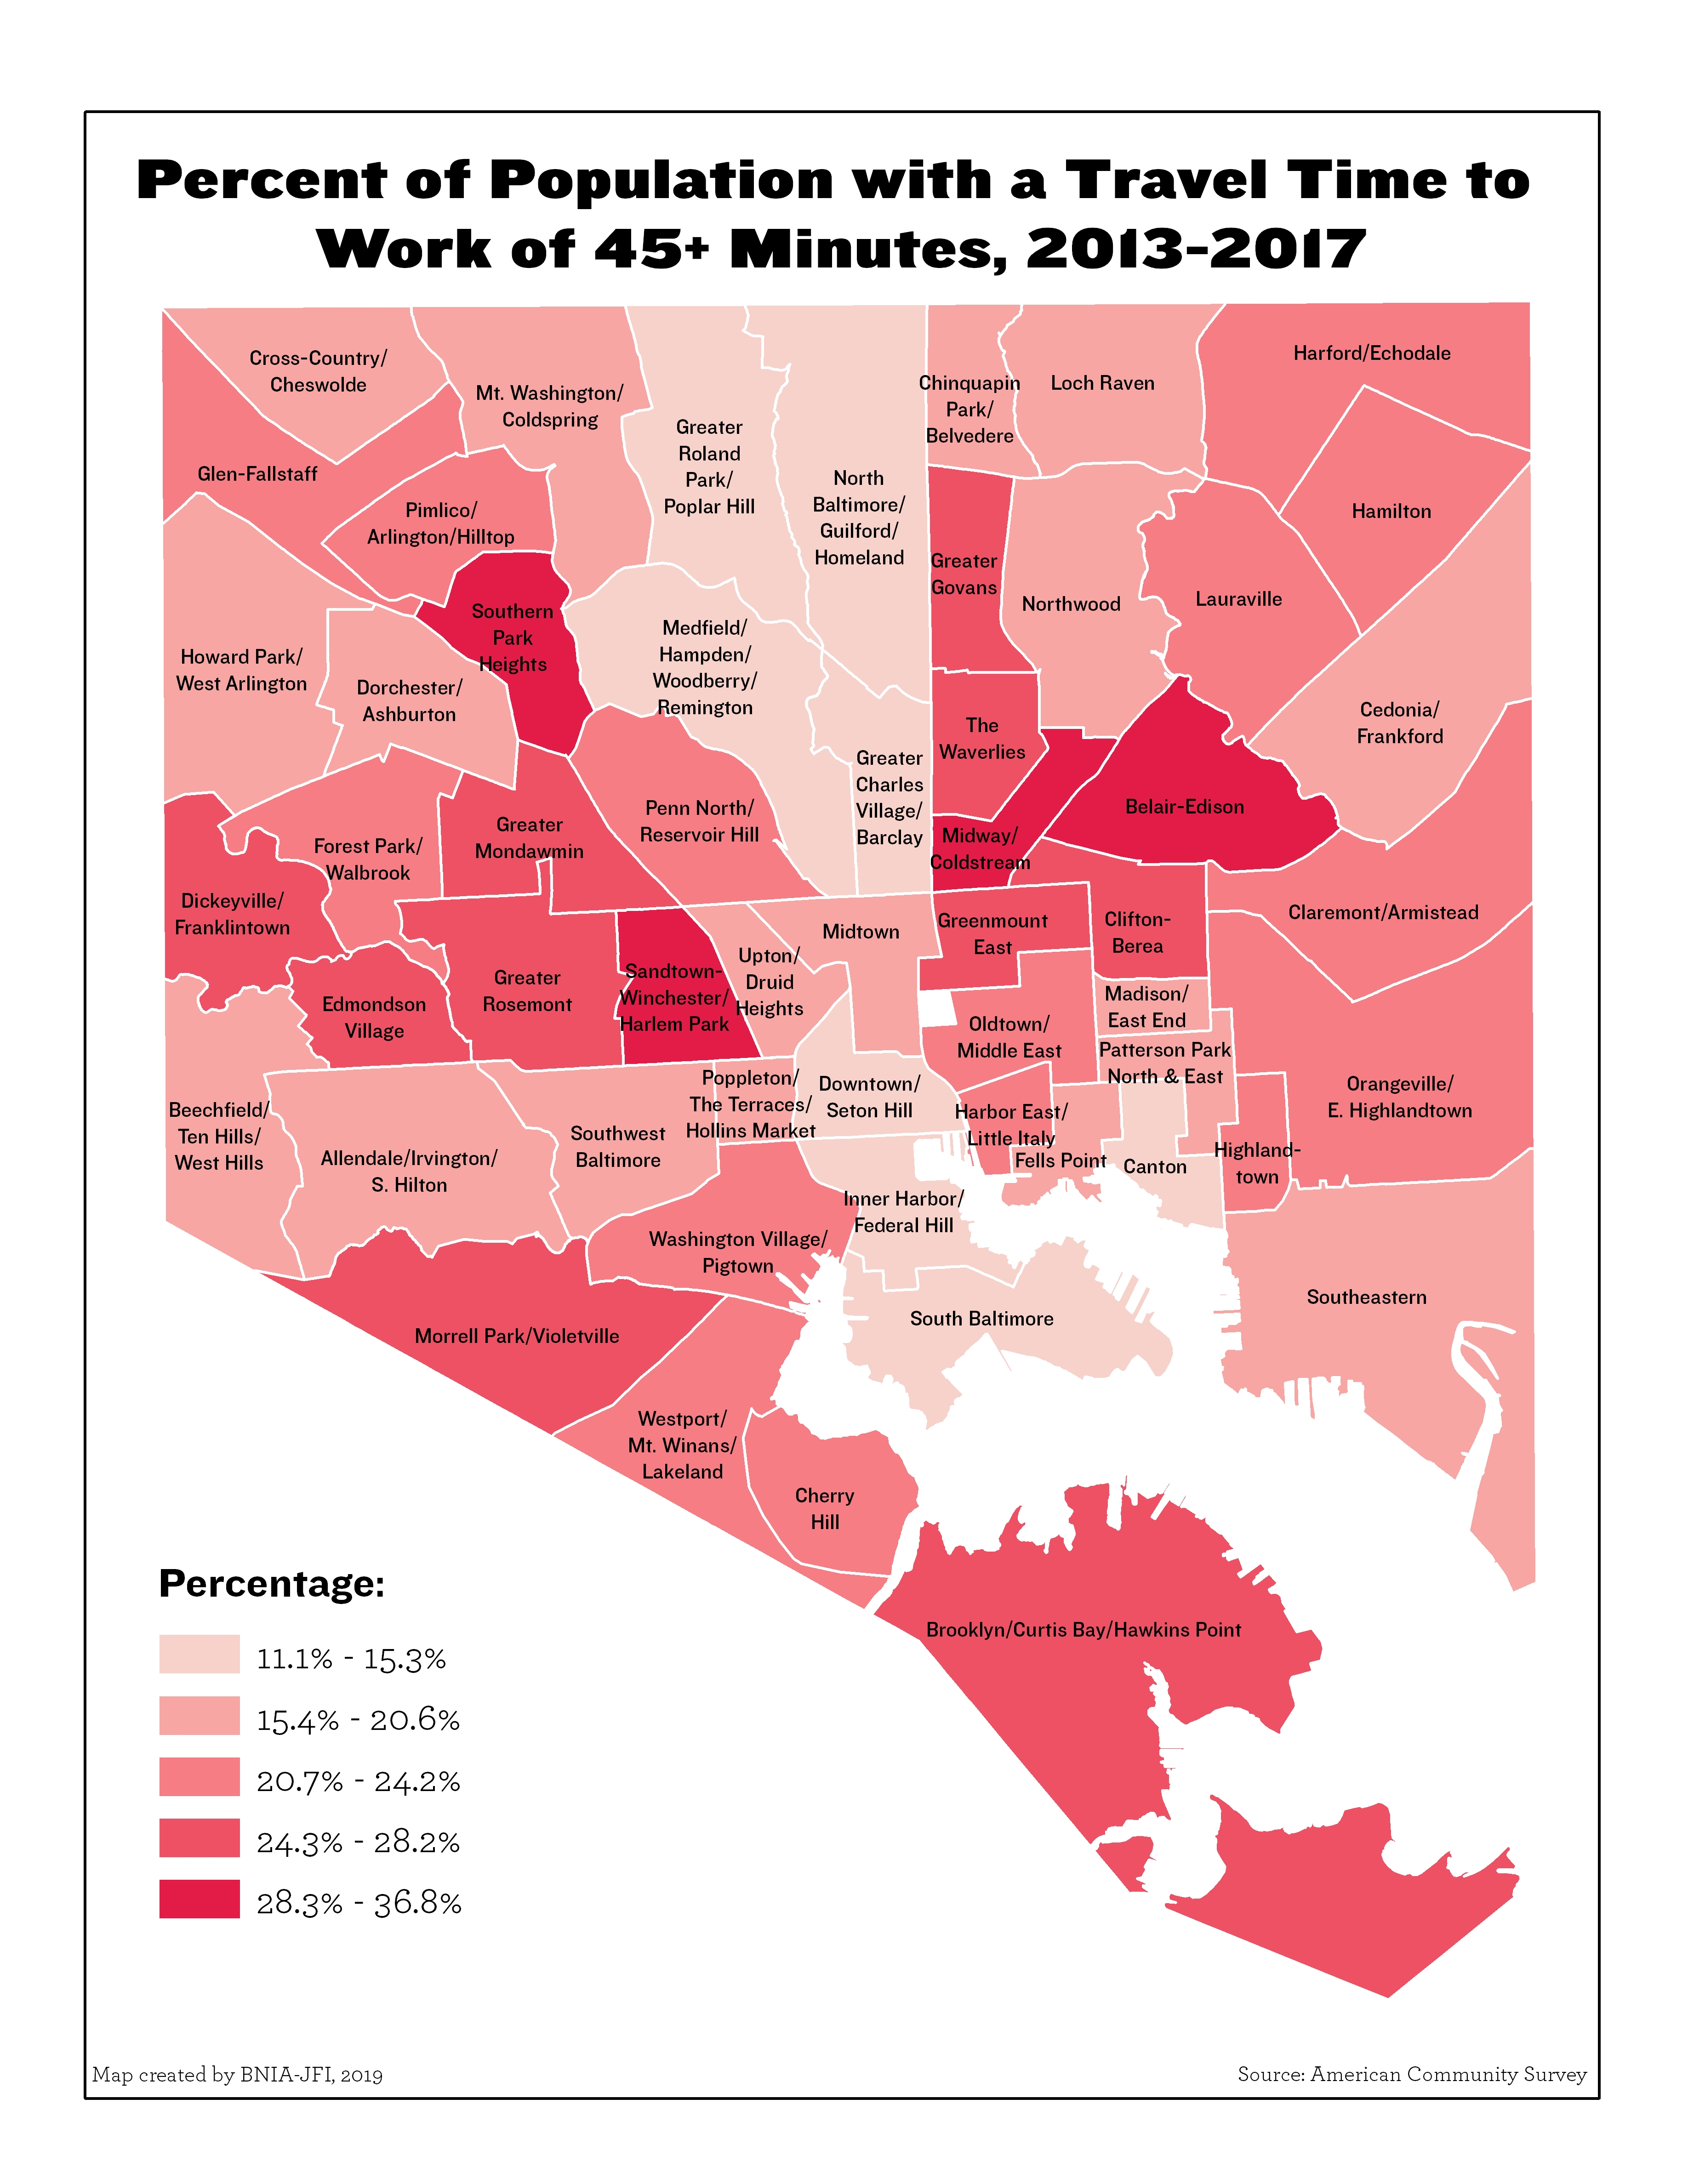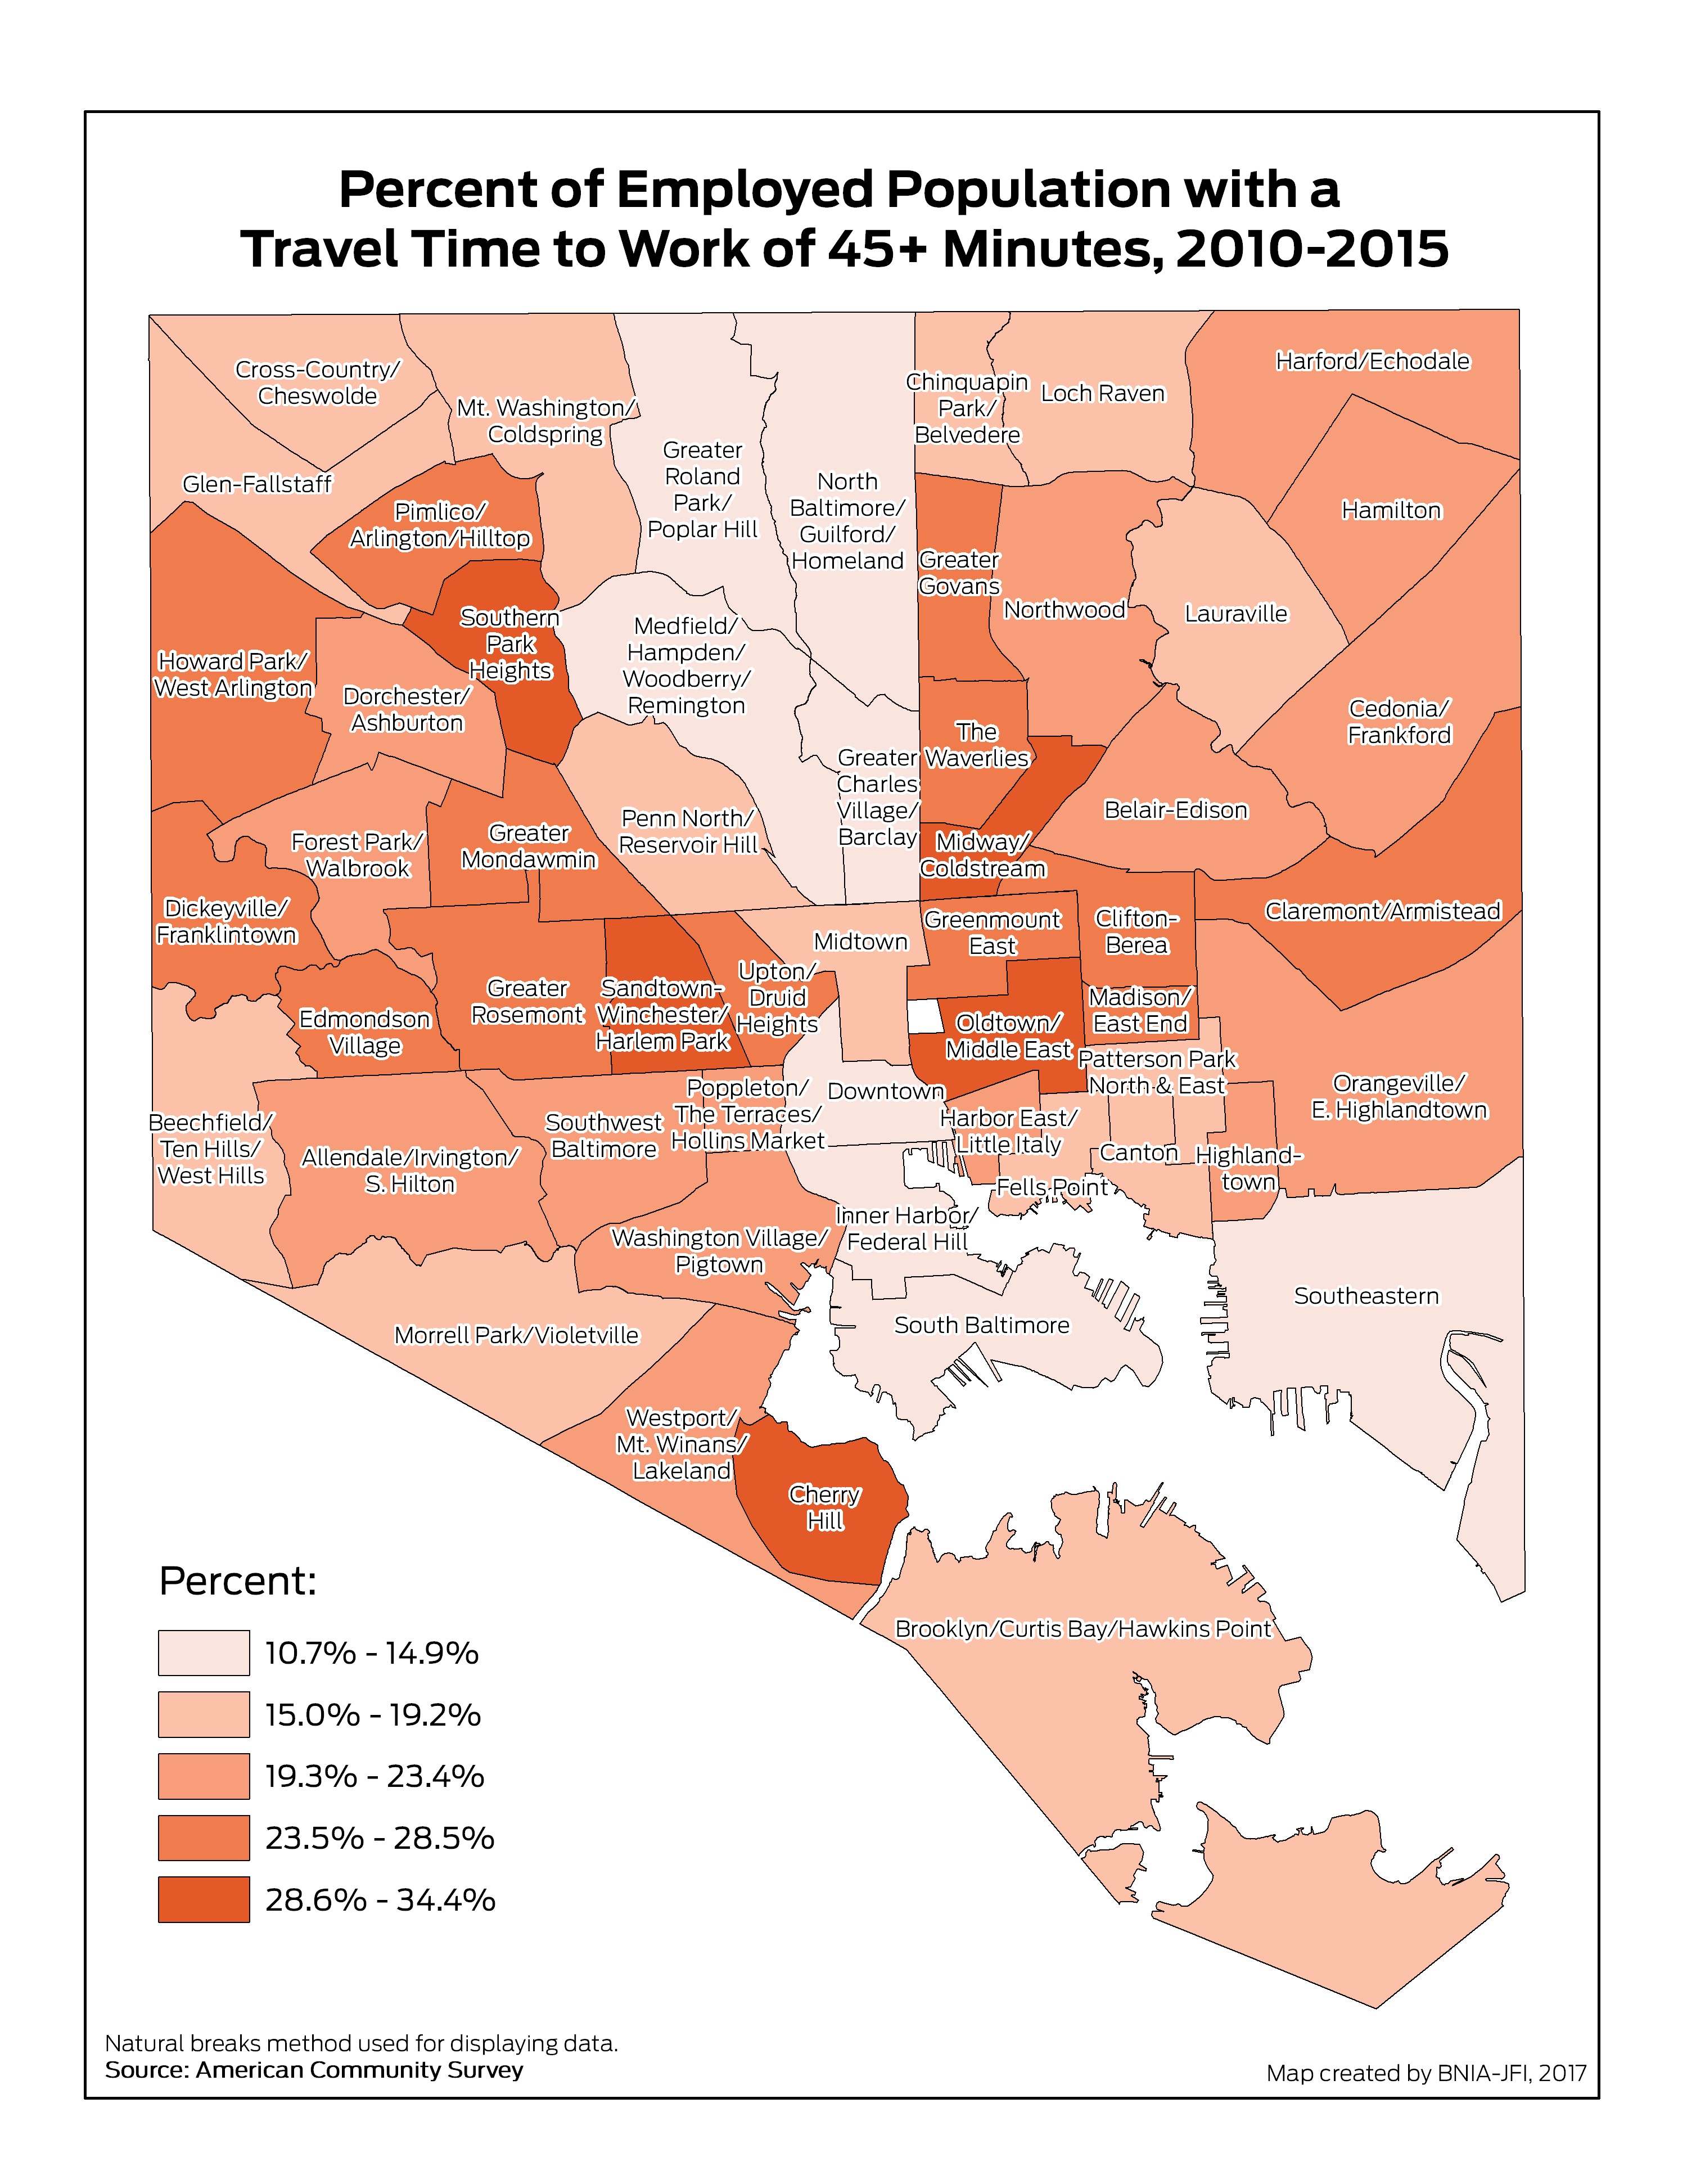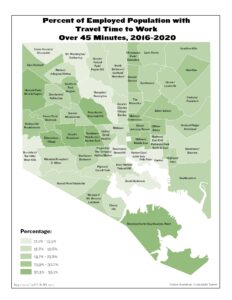
Percent of Employed Population with Travel Time to Work Over 45 Minutes (2020)
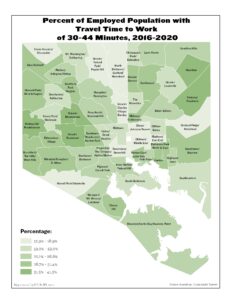
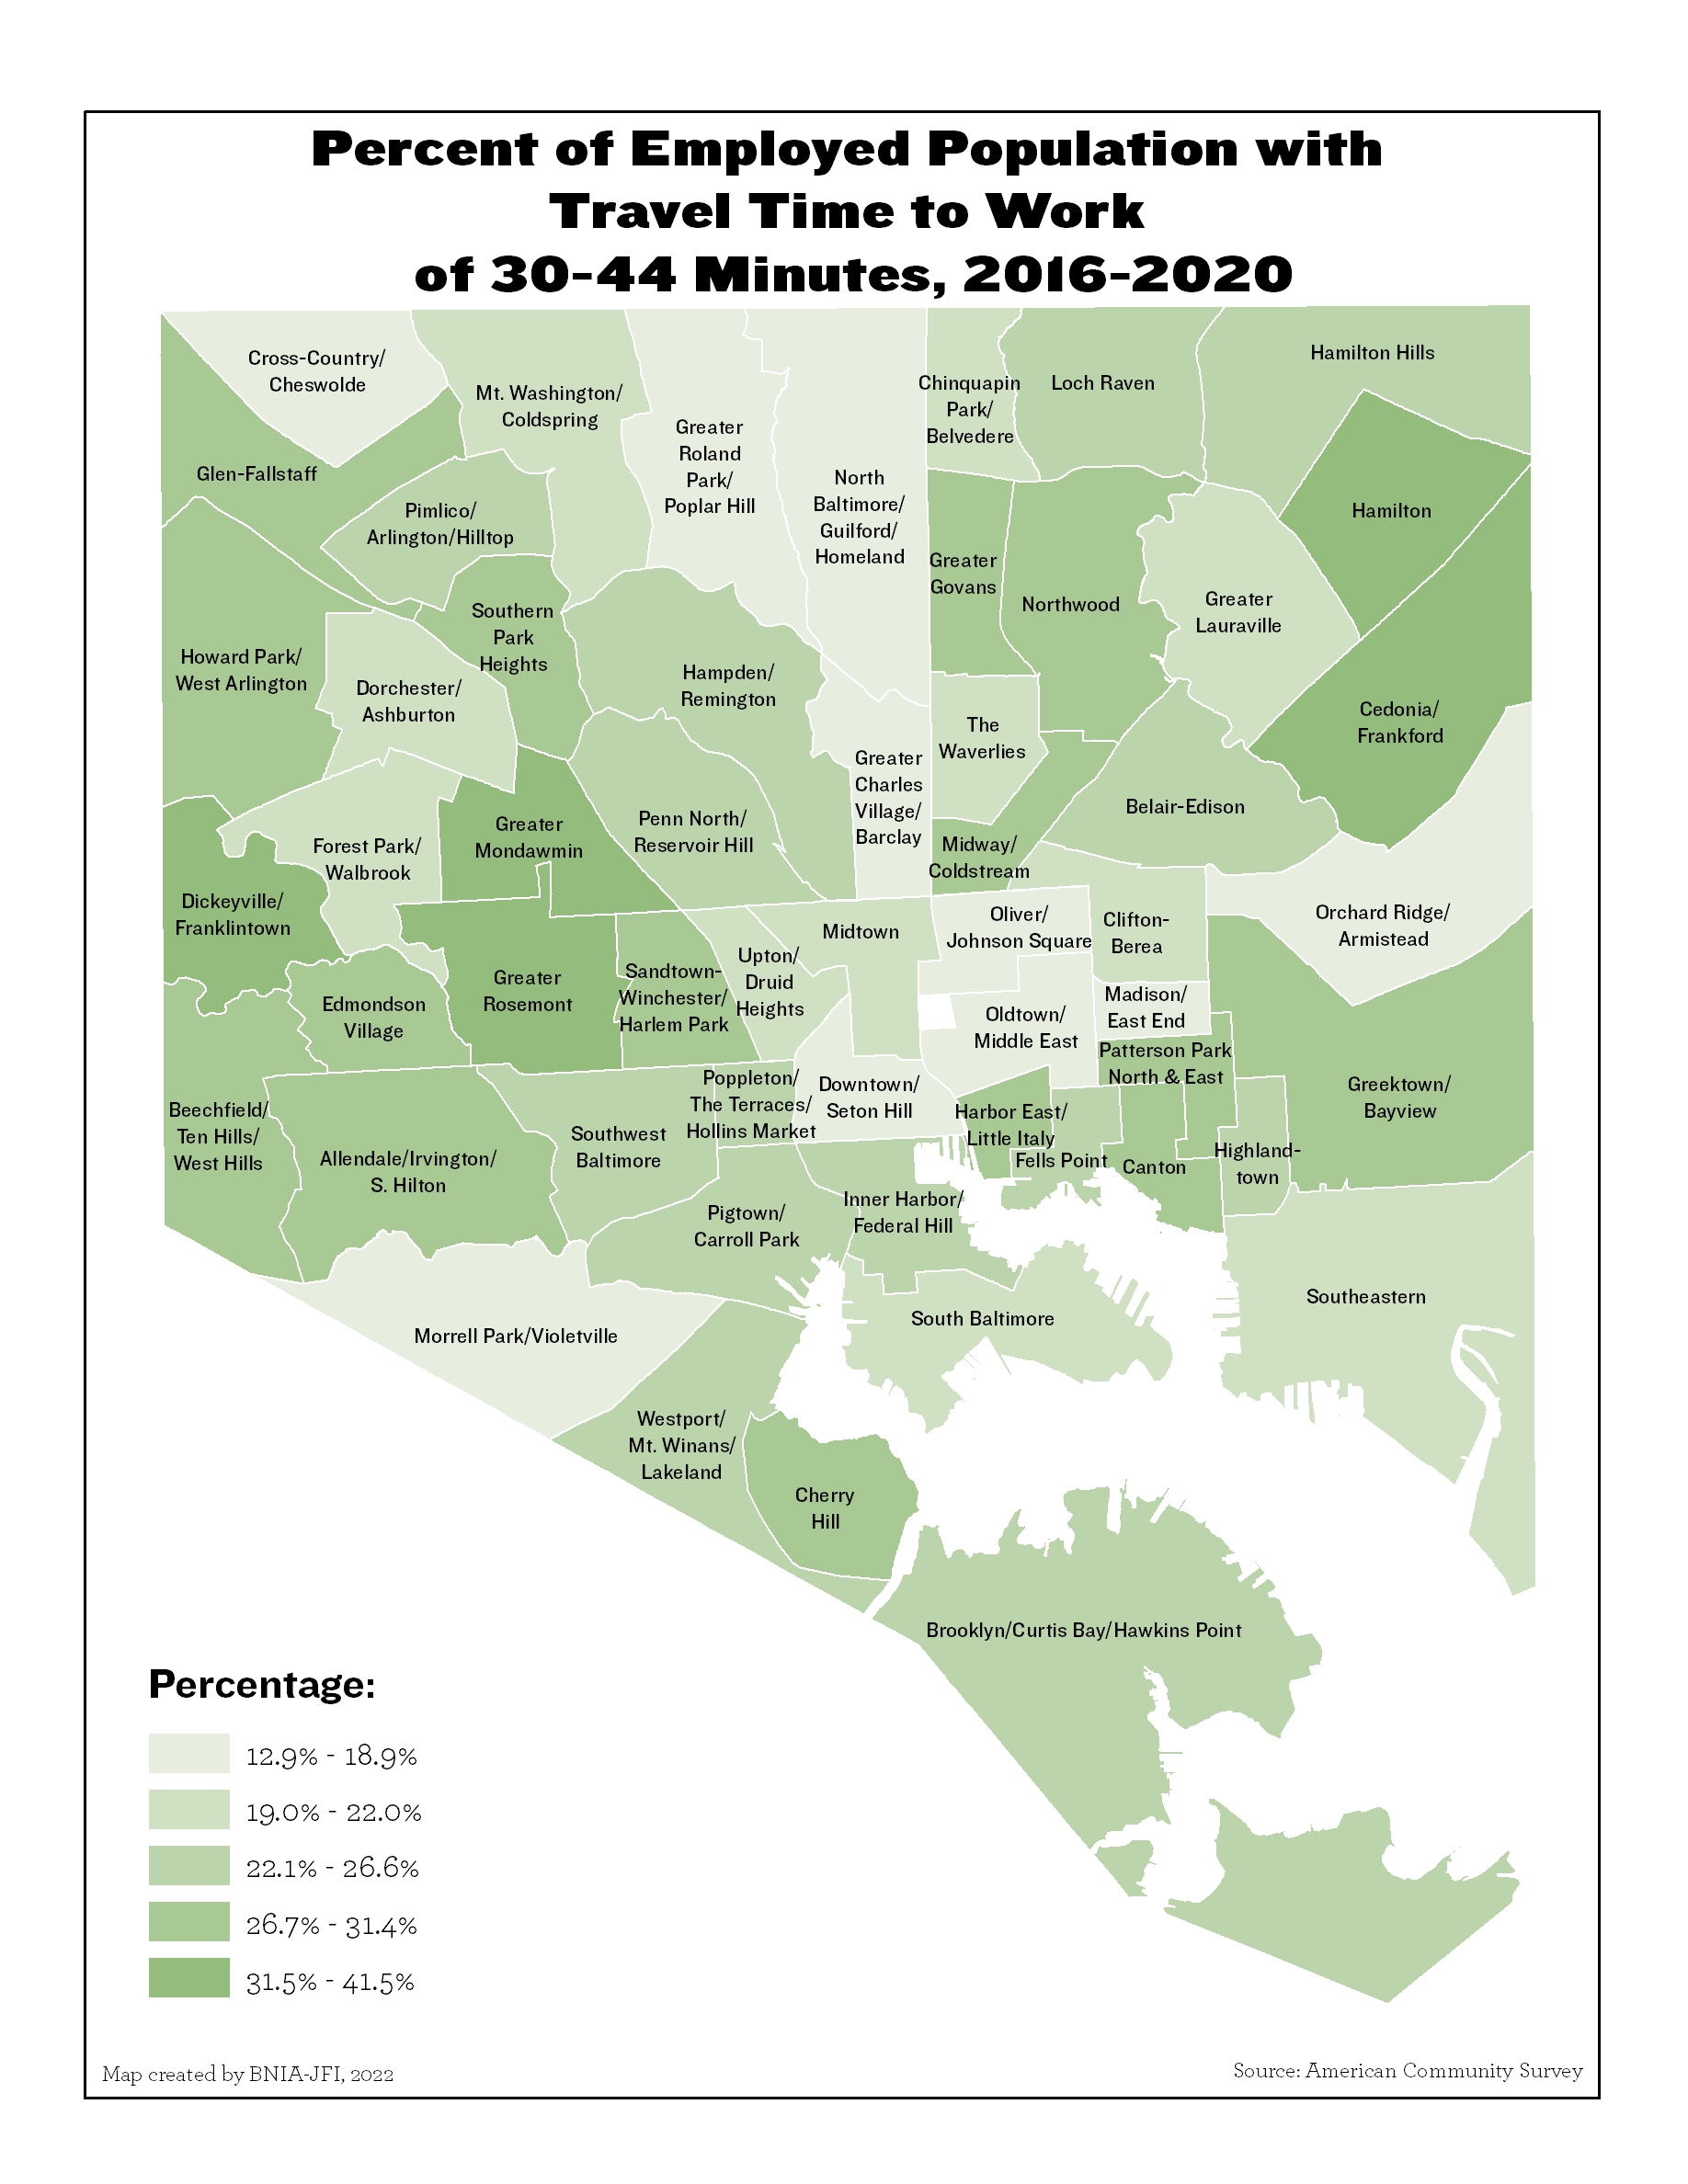
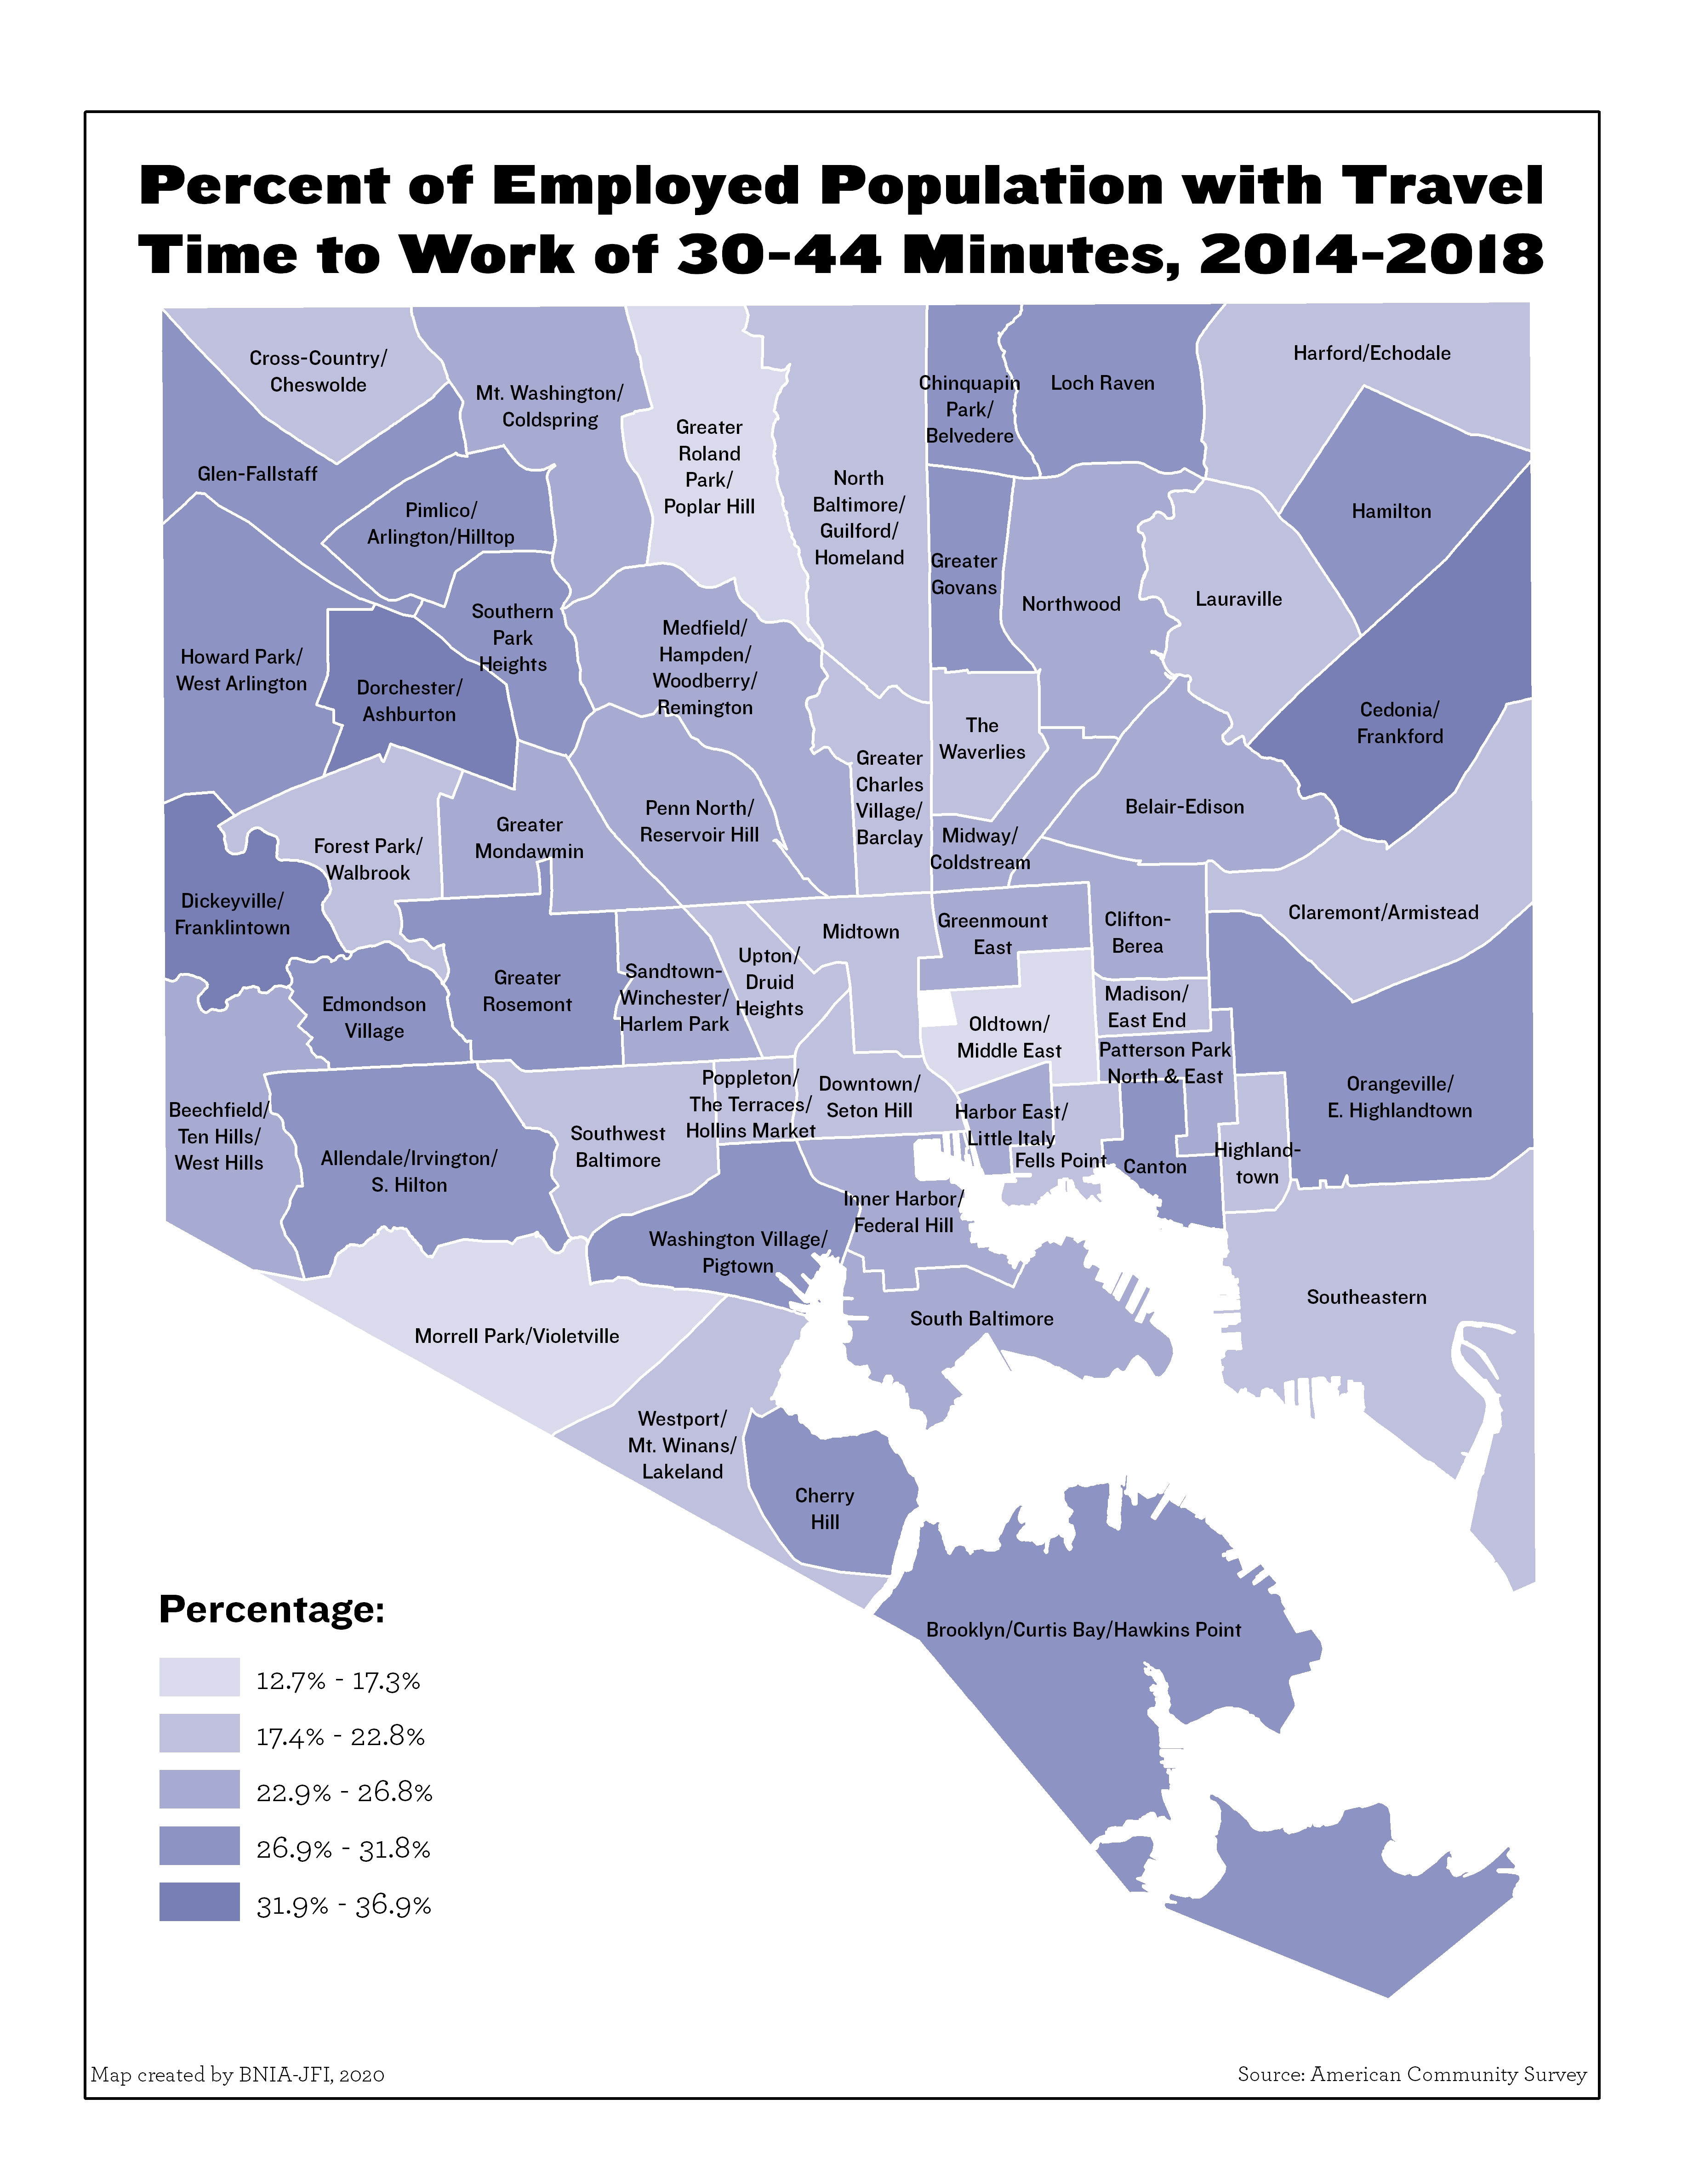
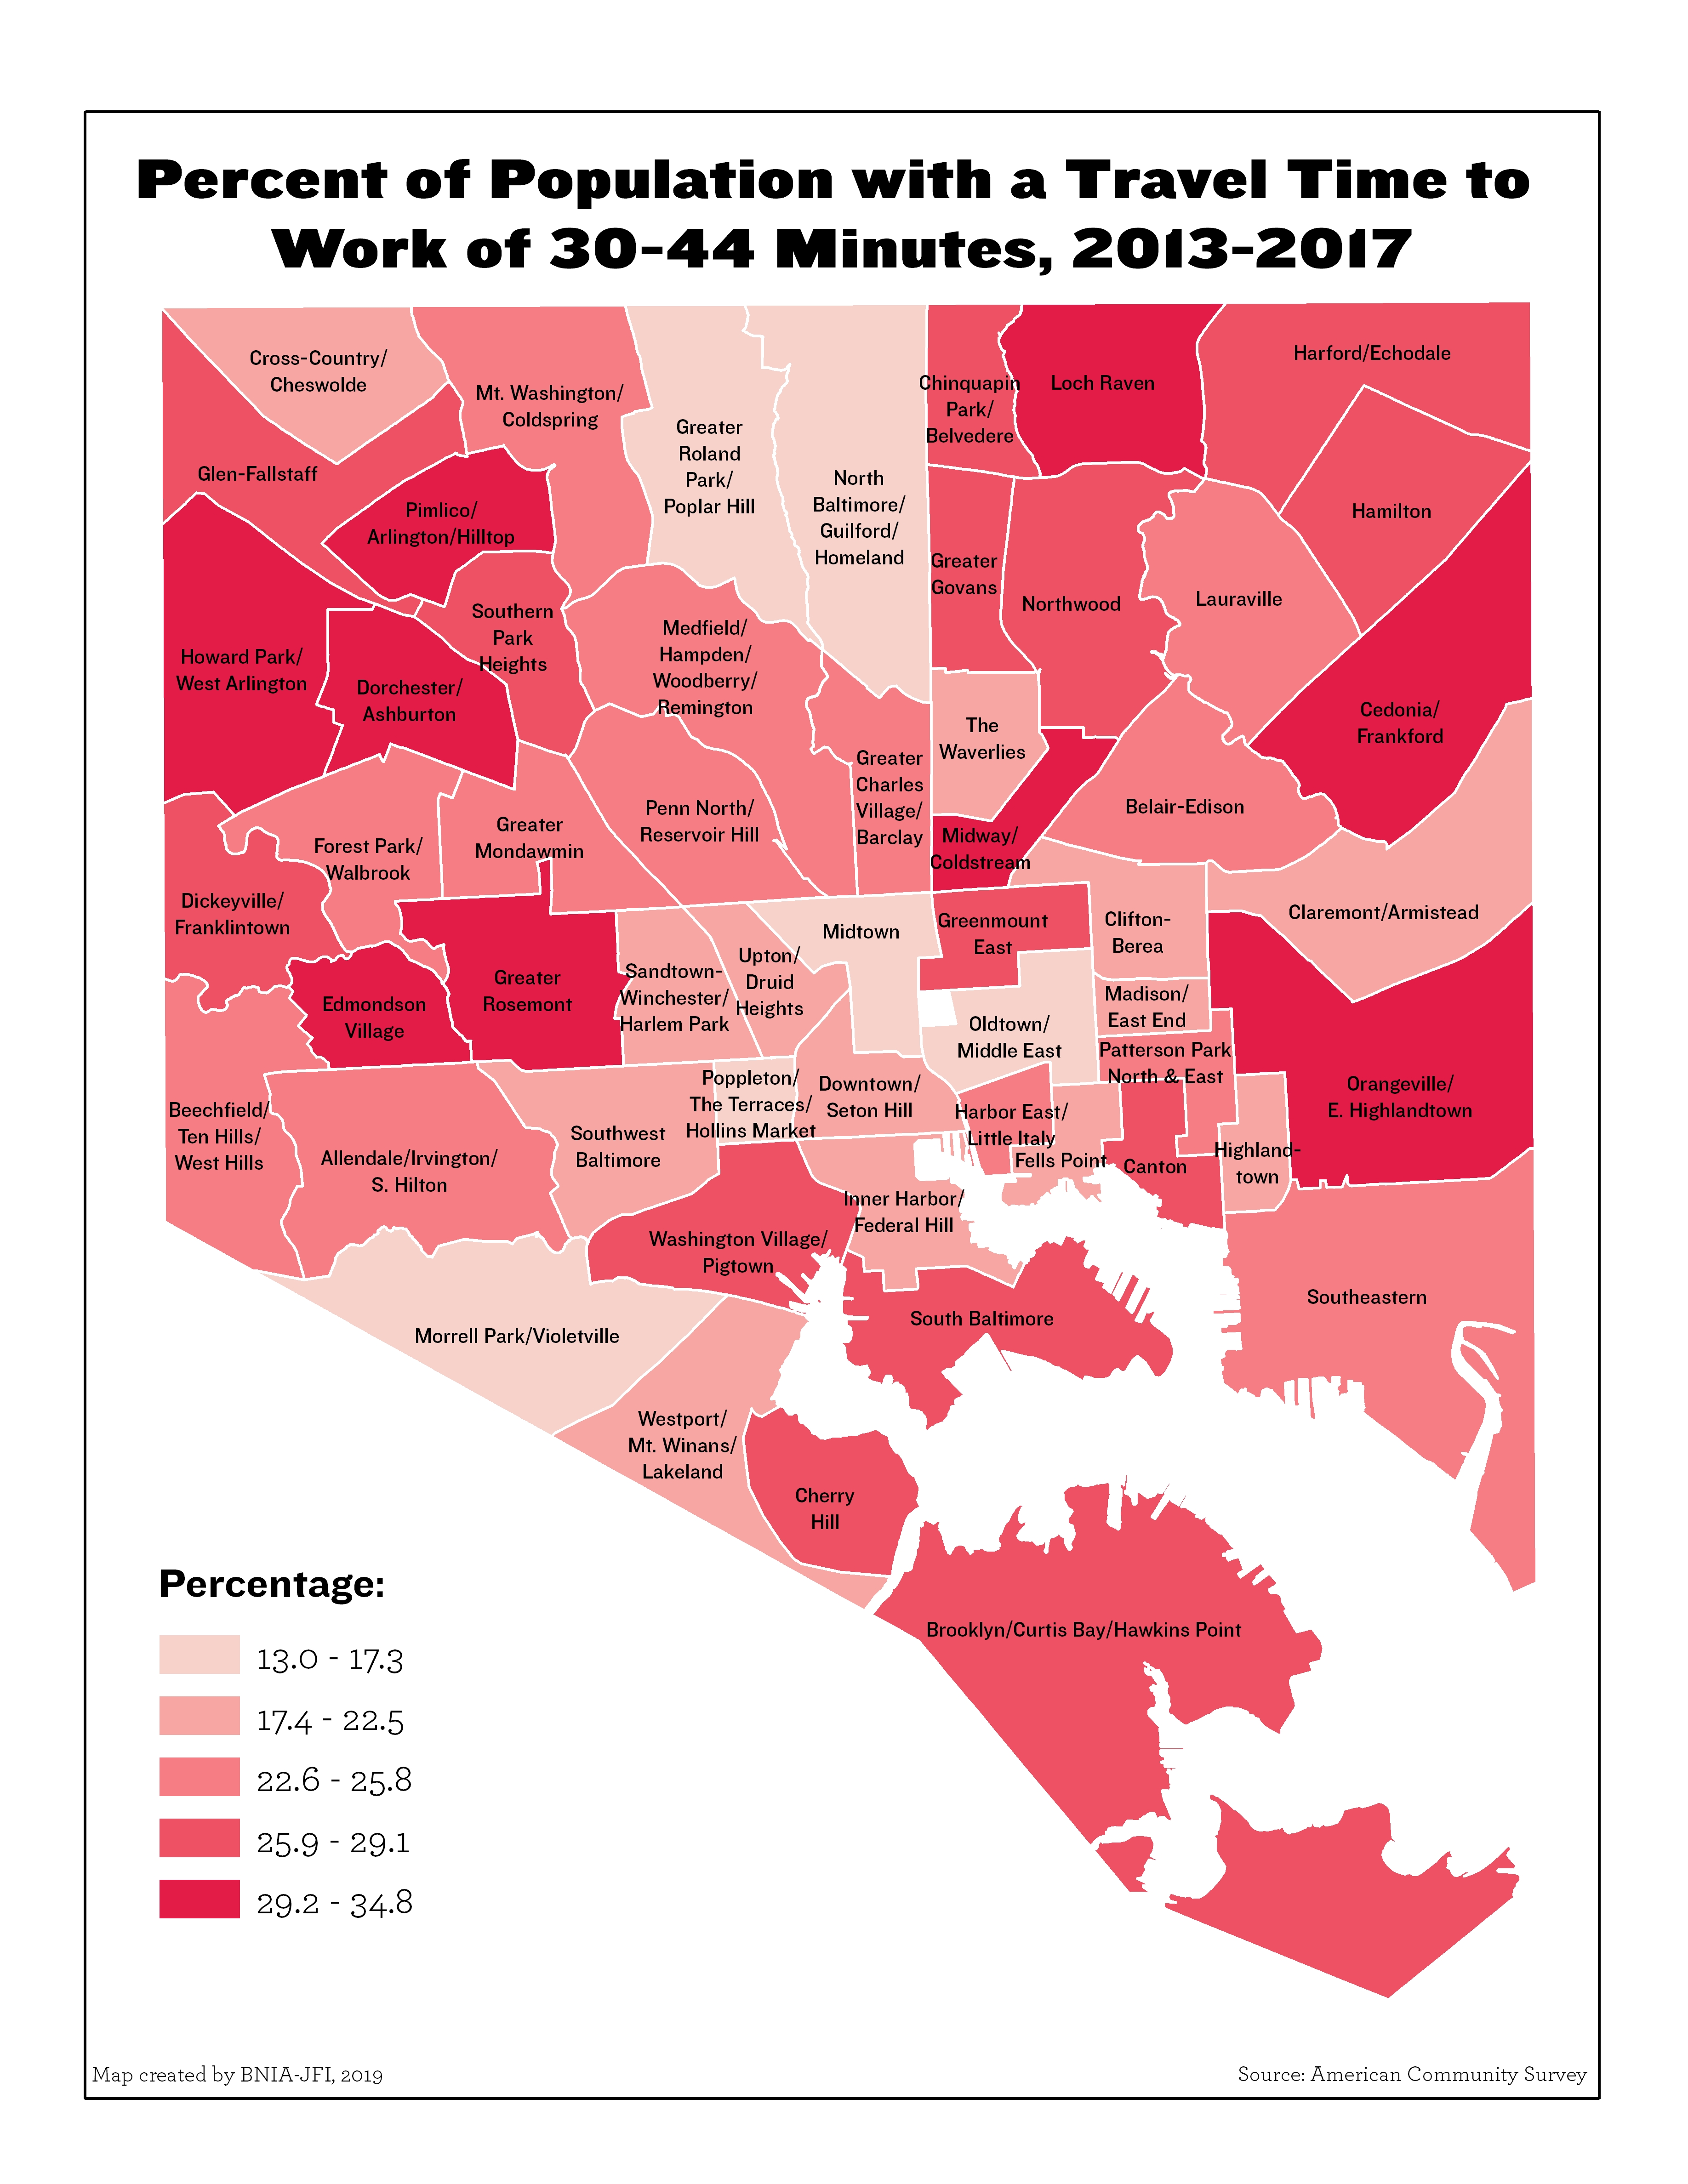
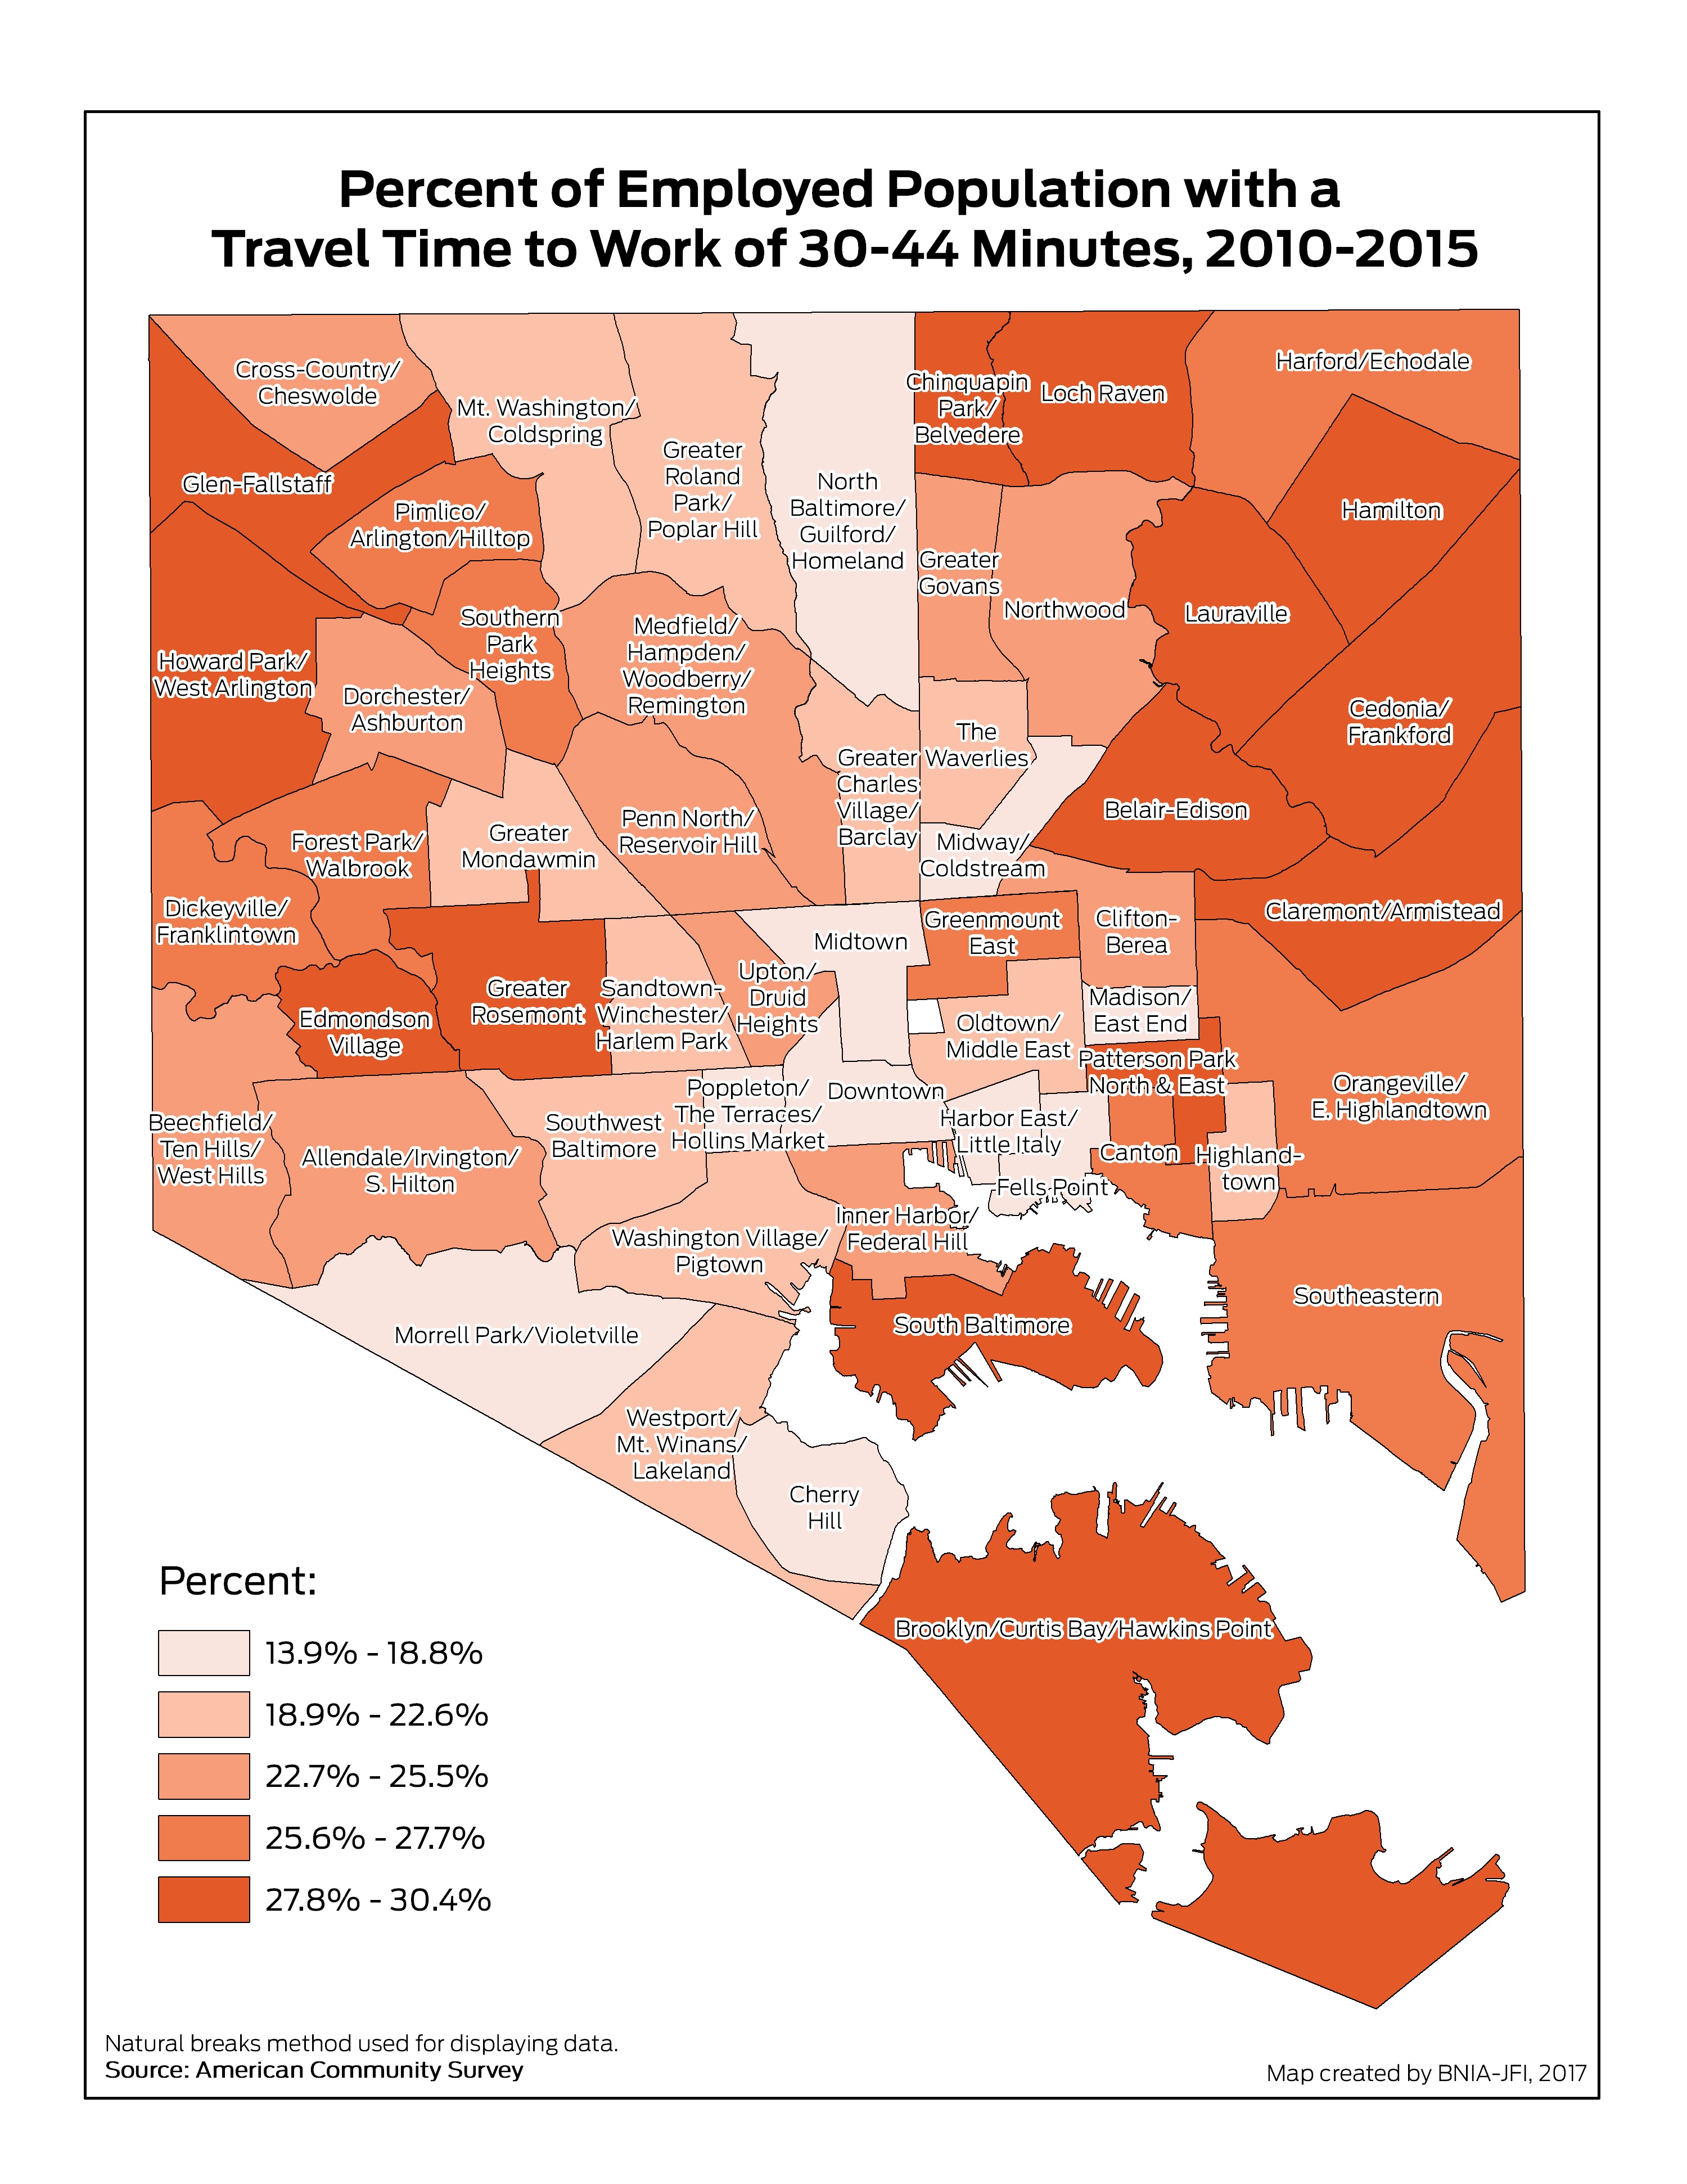
Percent of Employed Population with Travel Time to Work of 30-44 Minutes (2020)
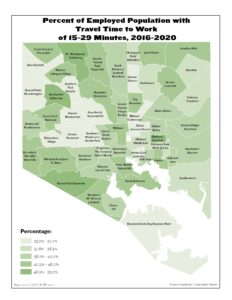
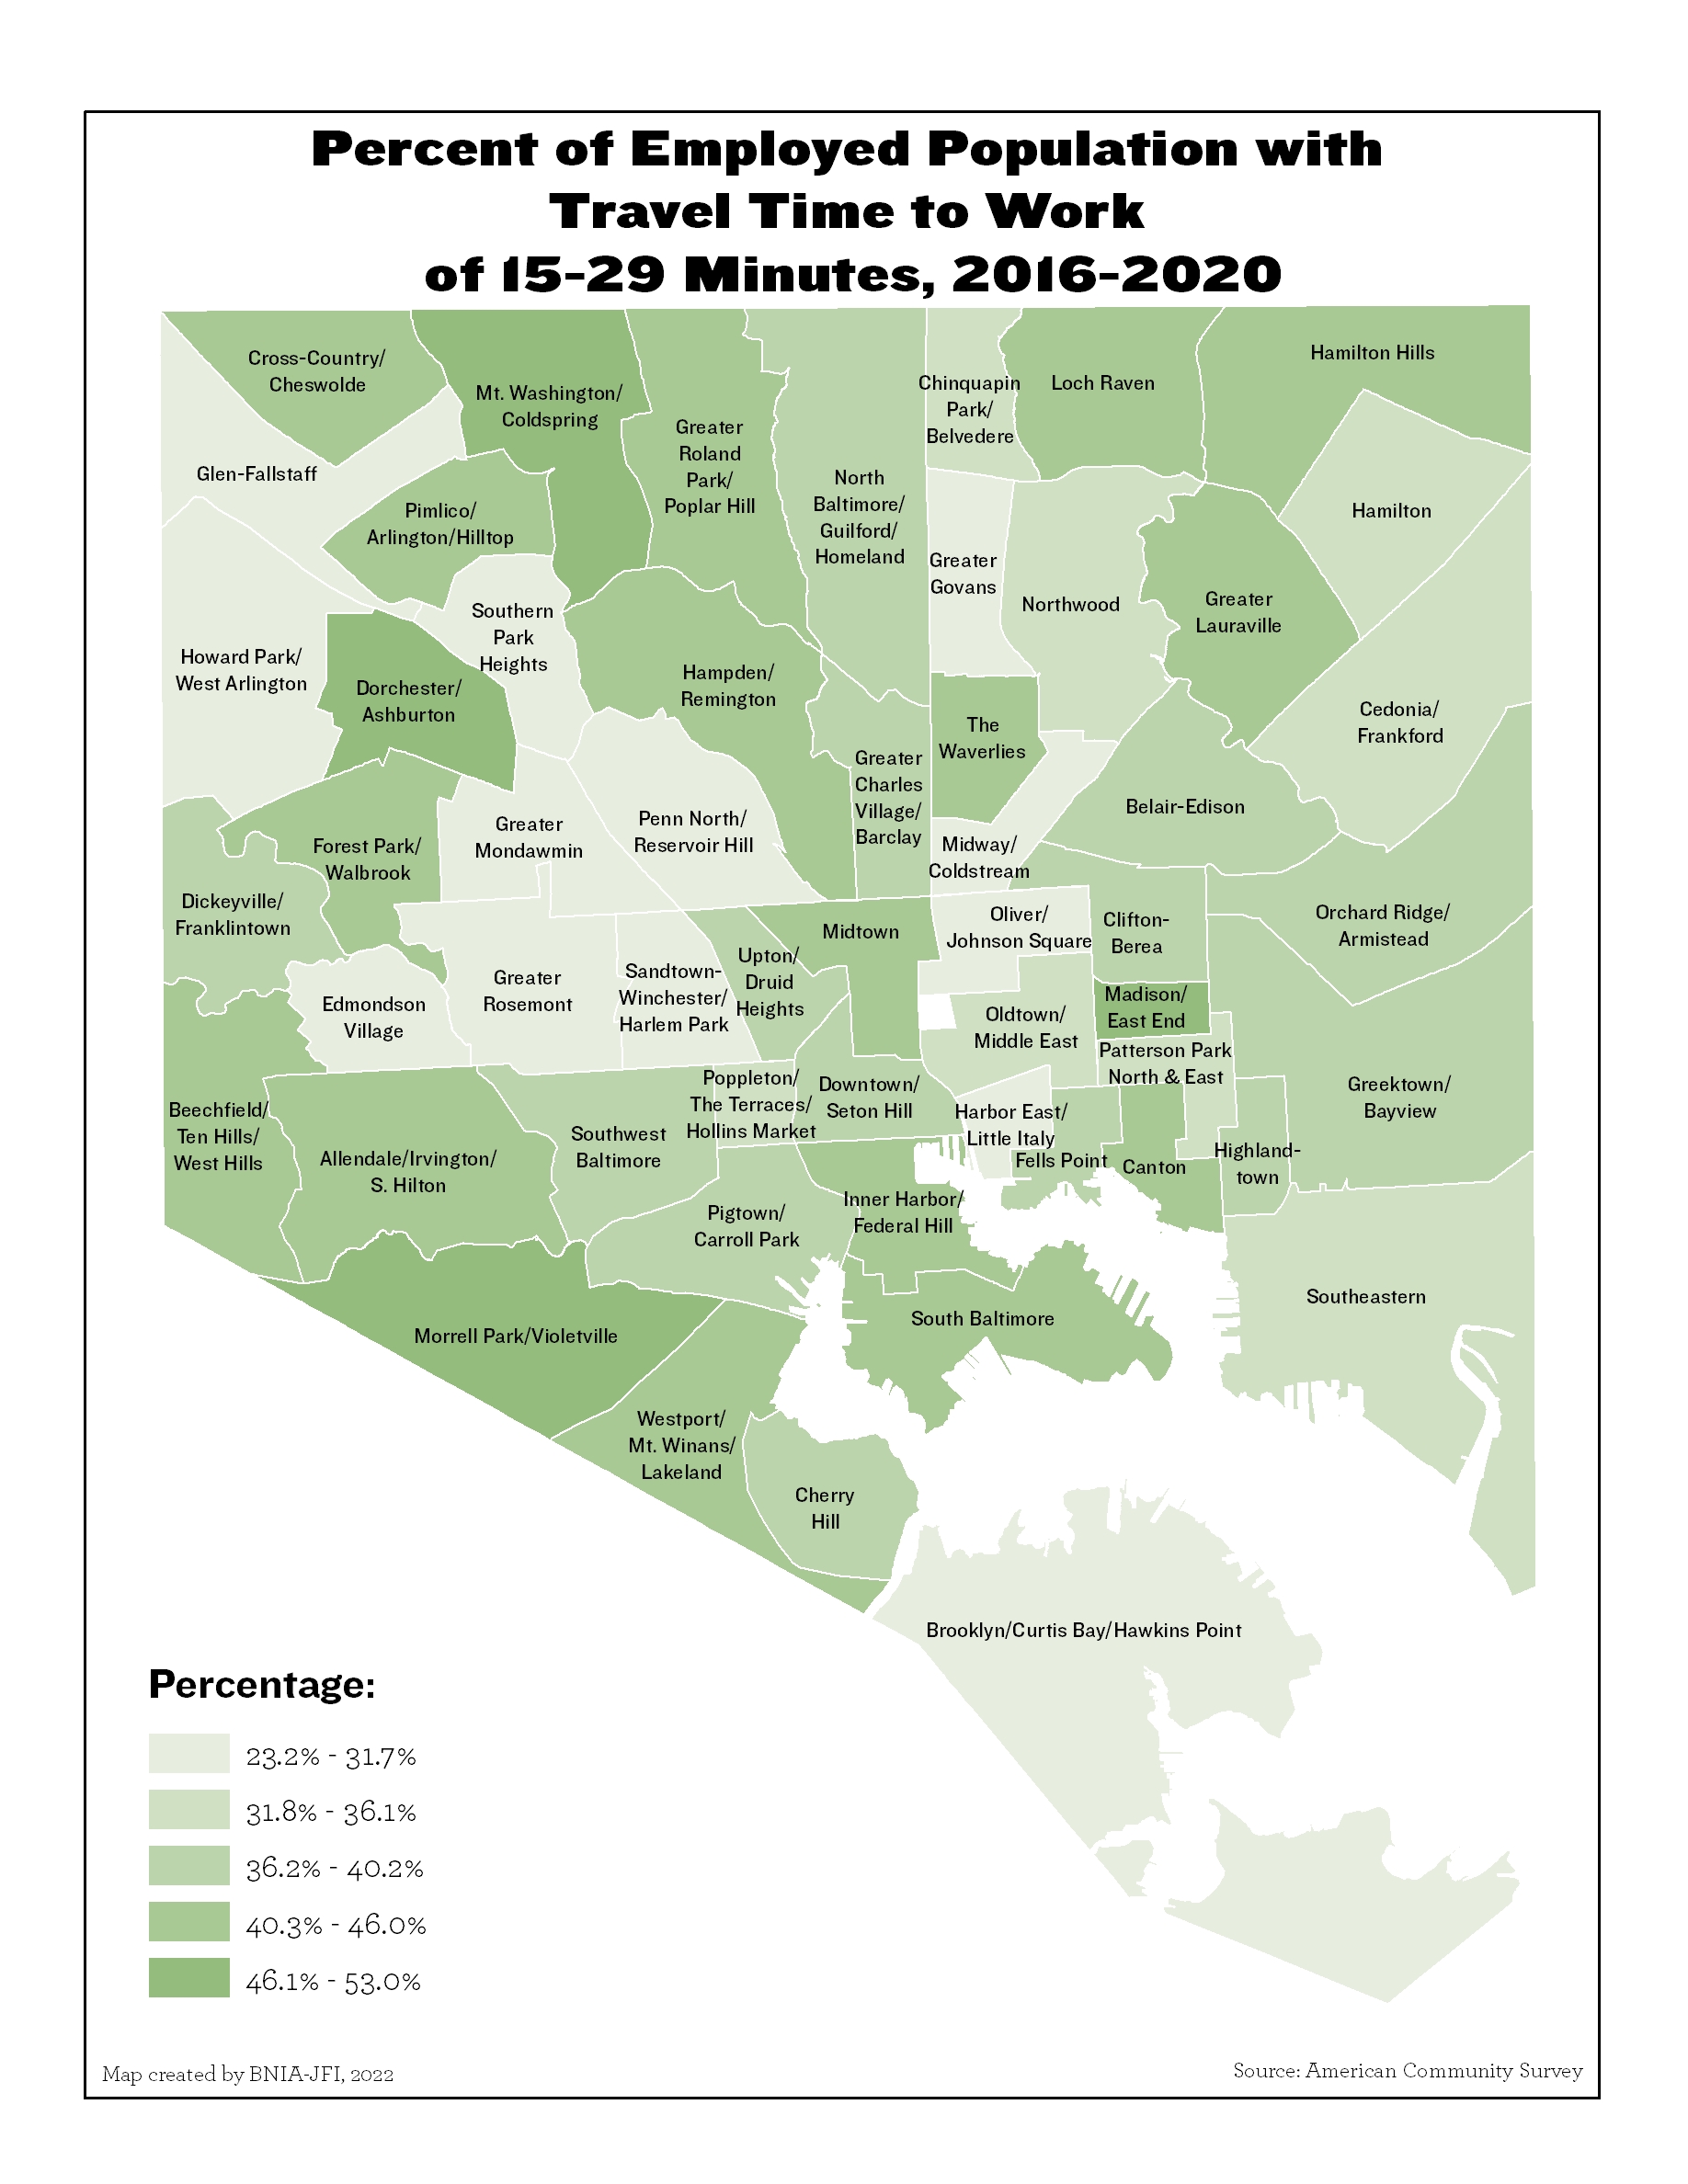
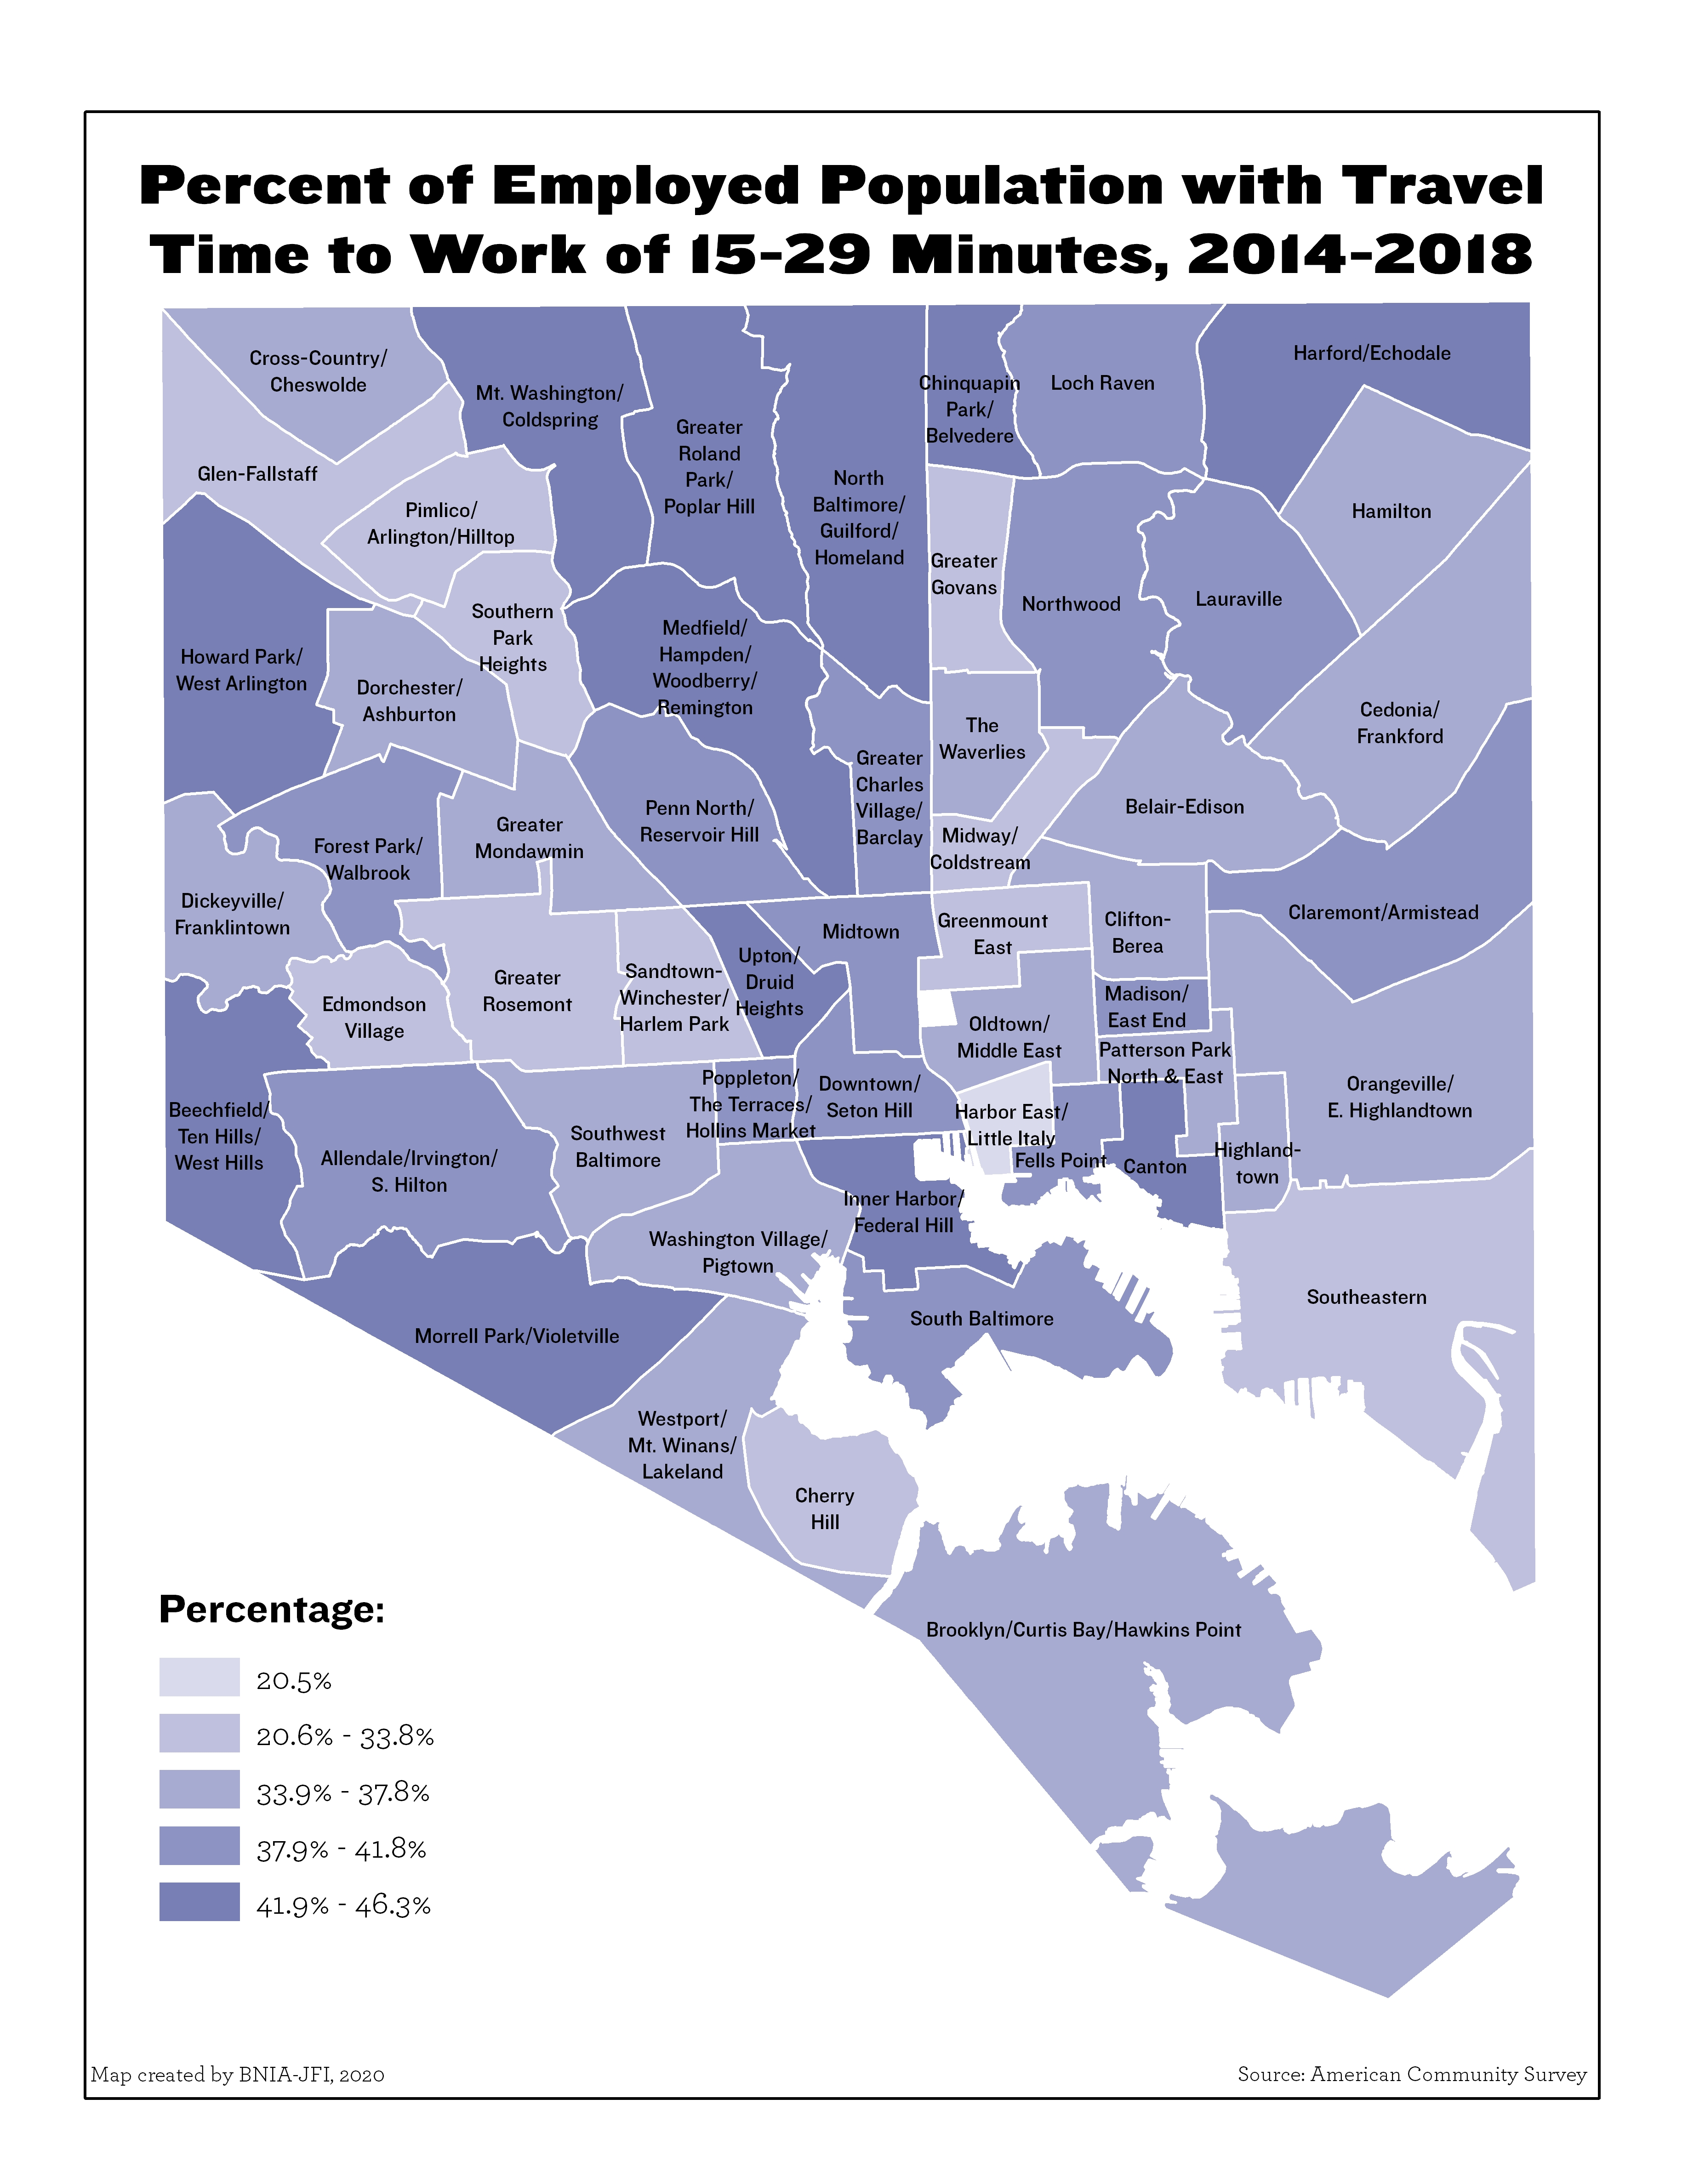
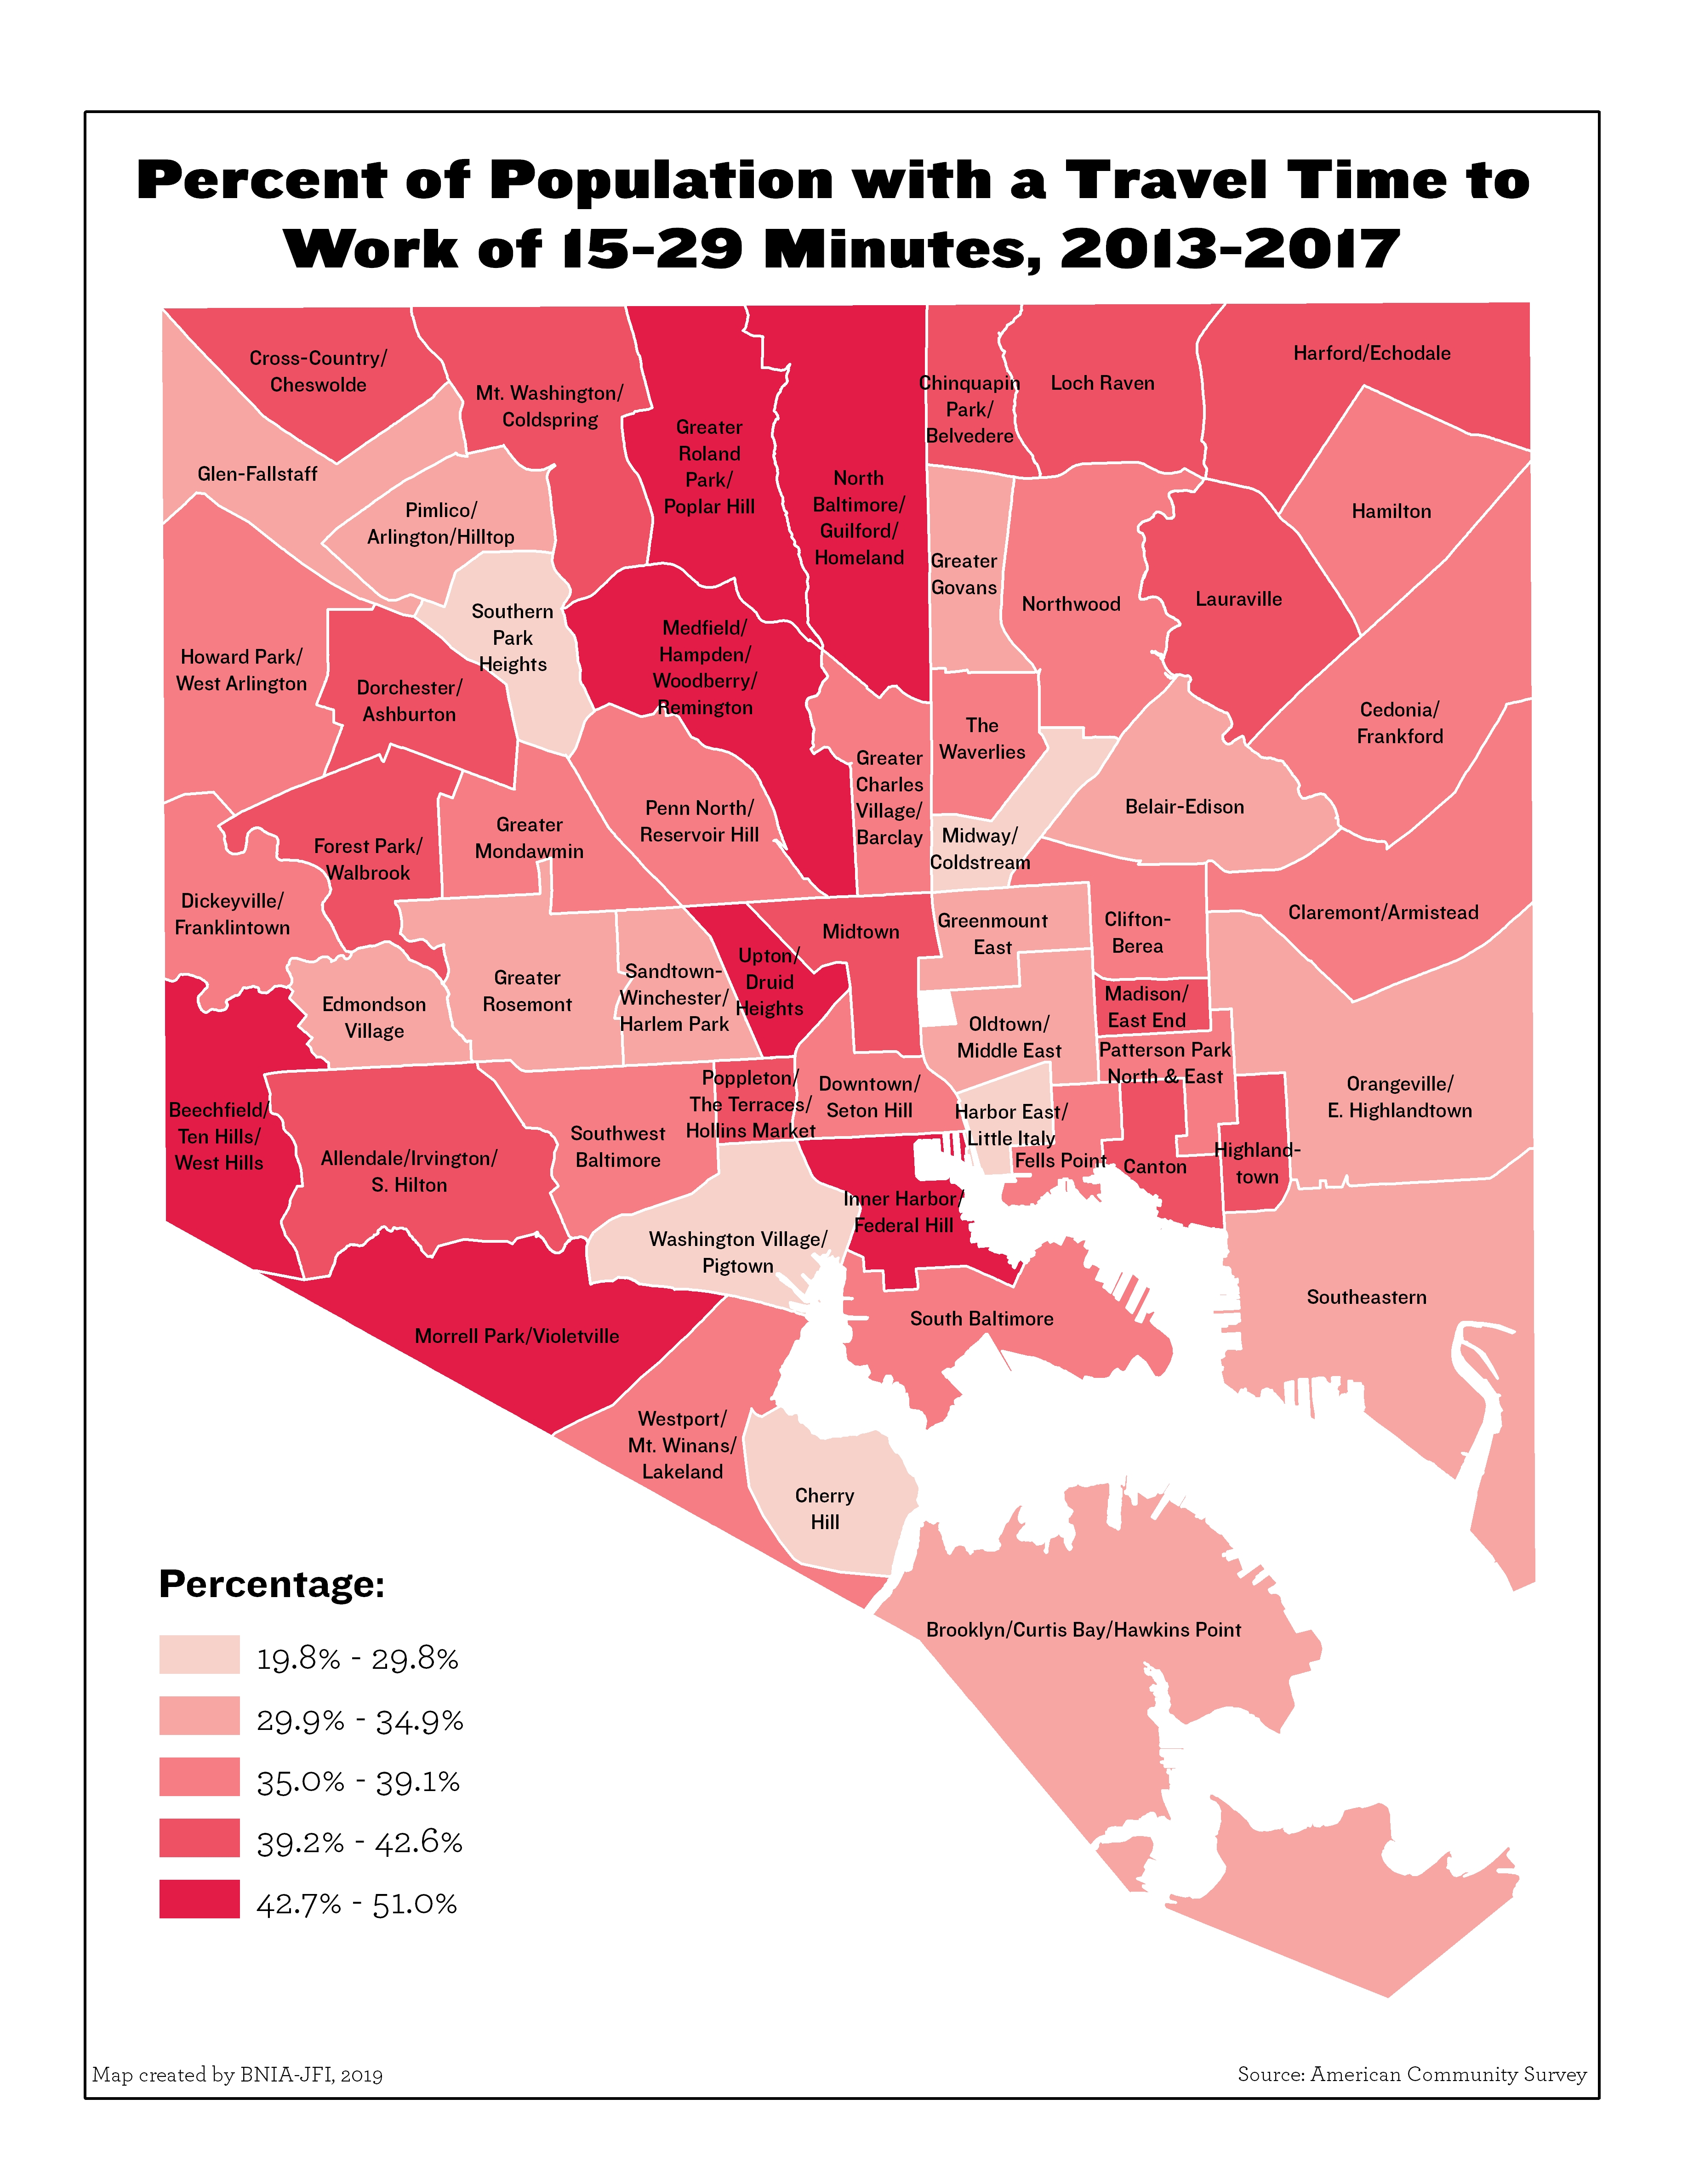
Percent of Employed Population with Travel Time to Work of 15-29 Minutes (2020)
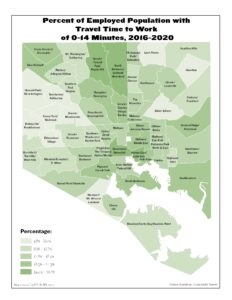
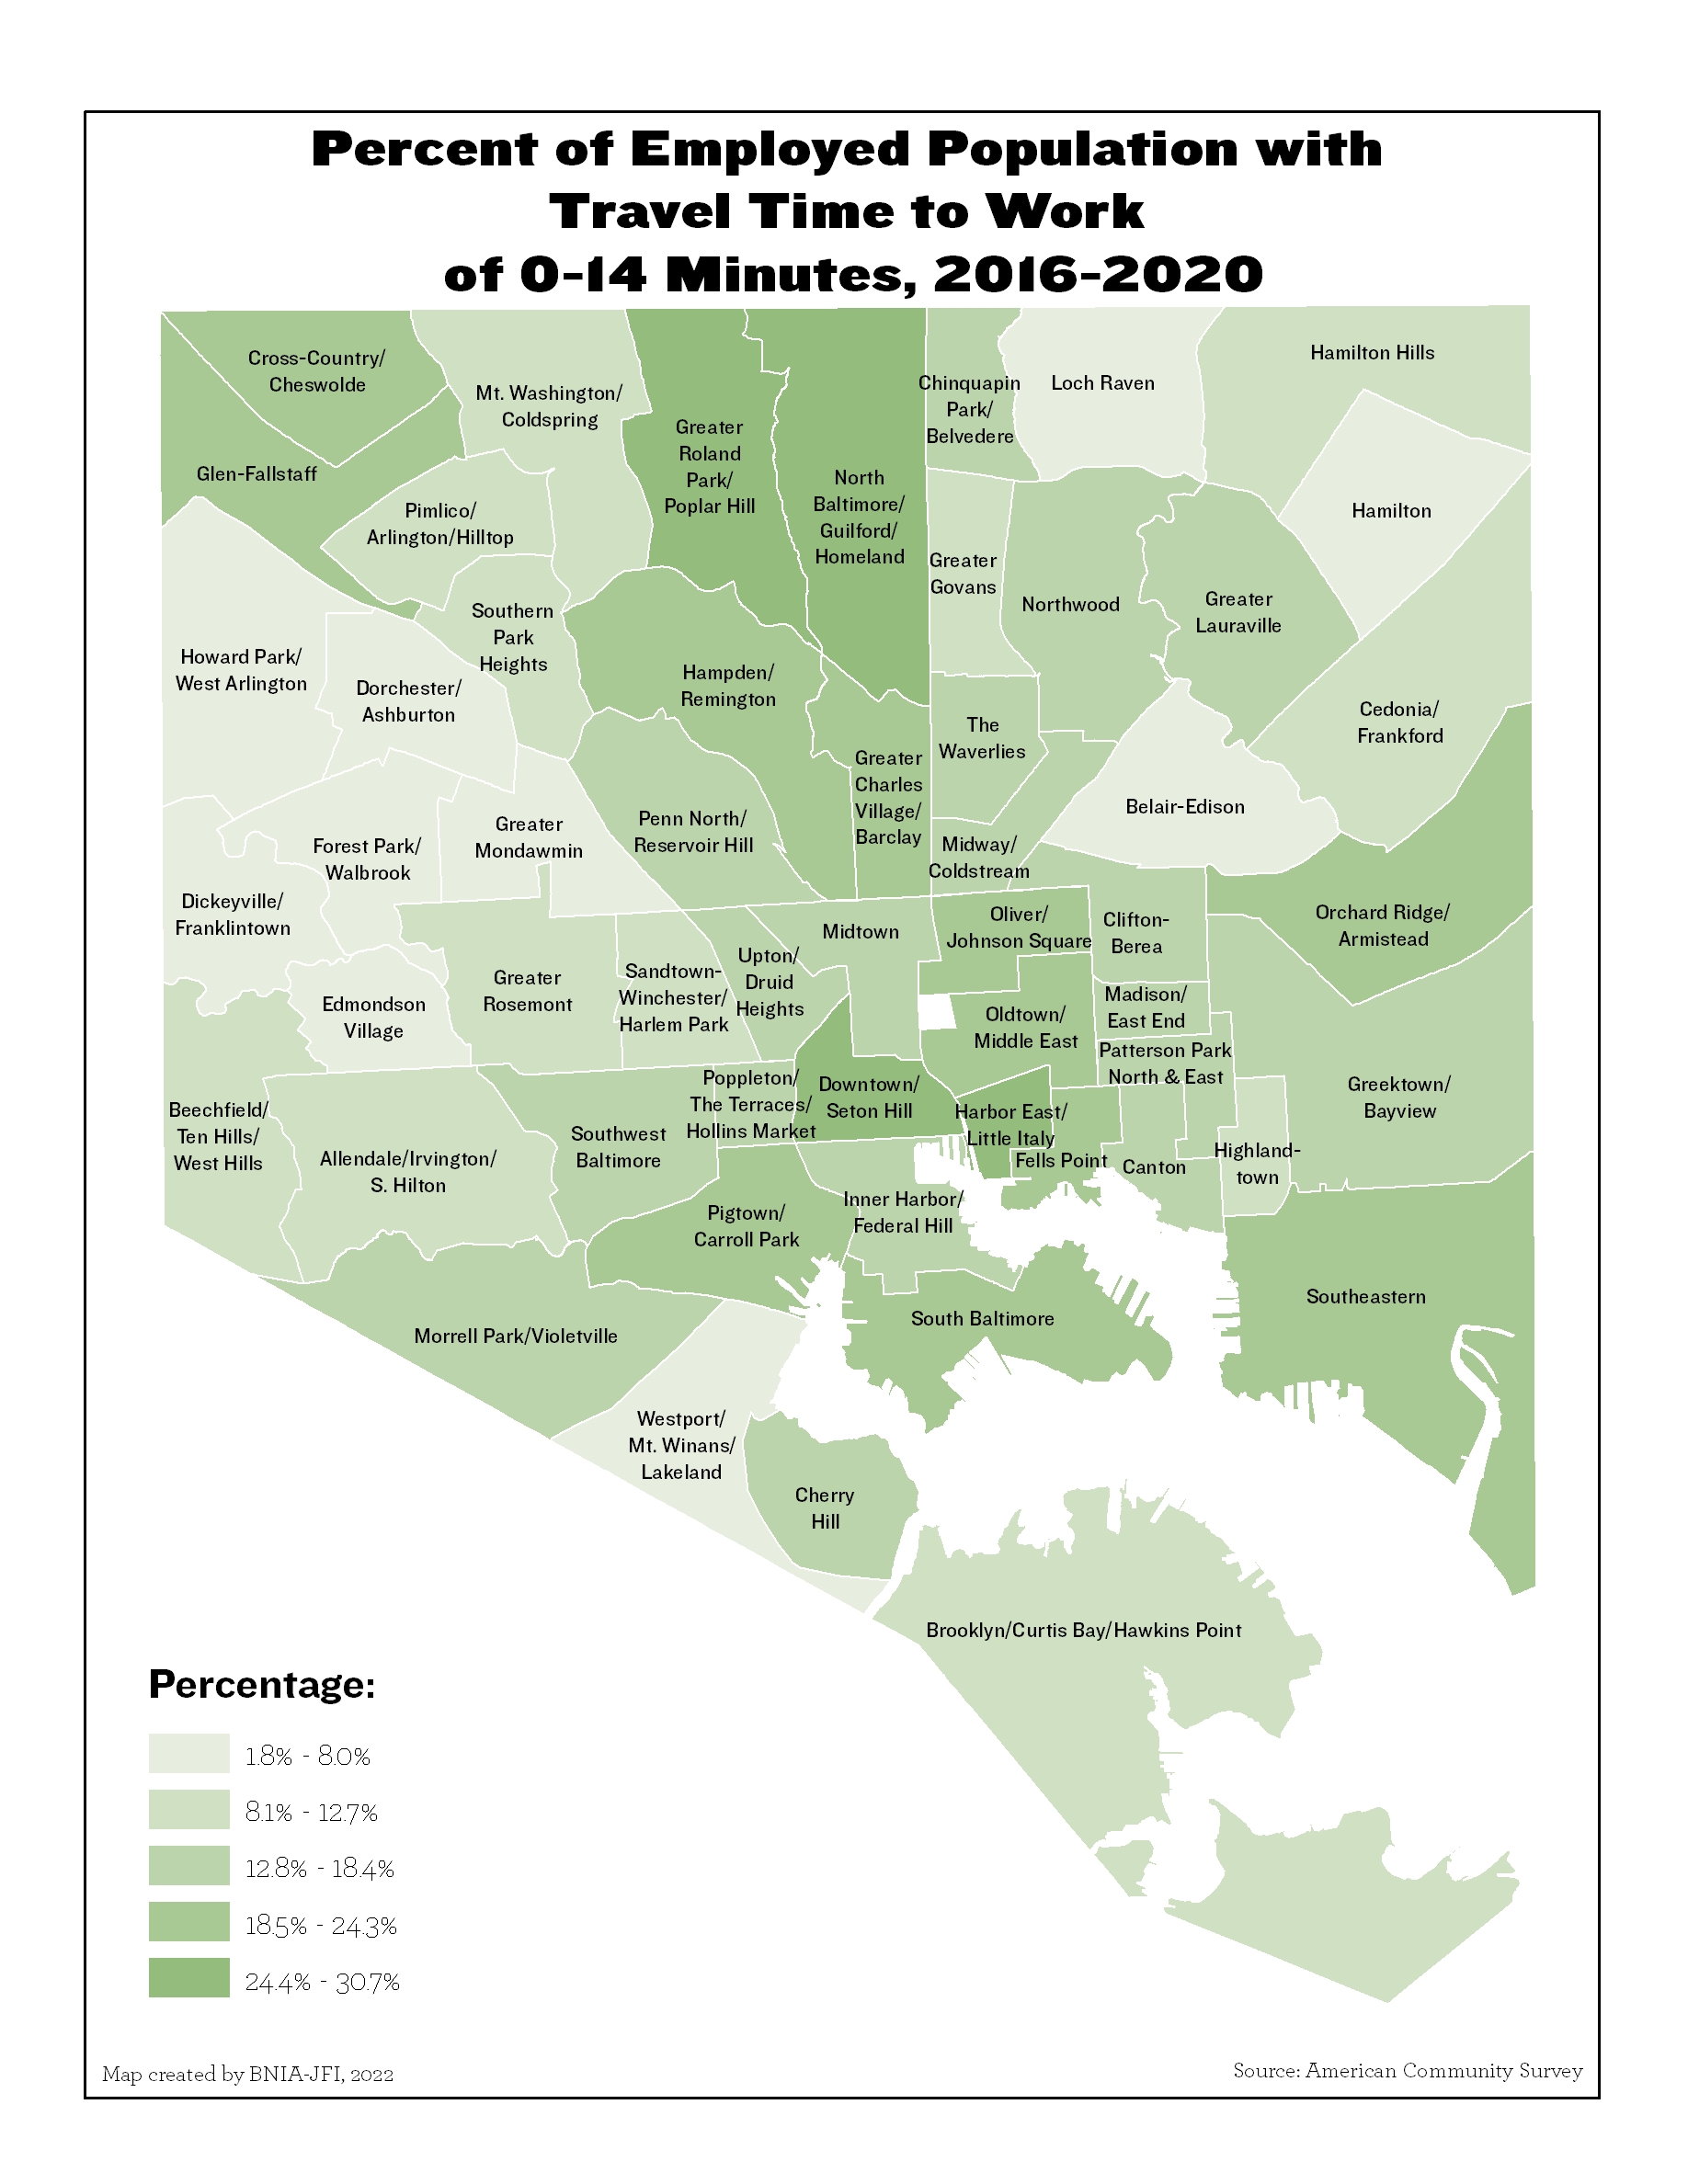
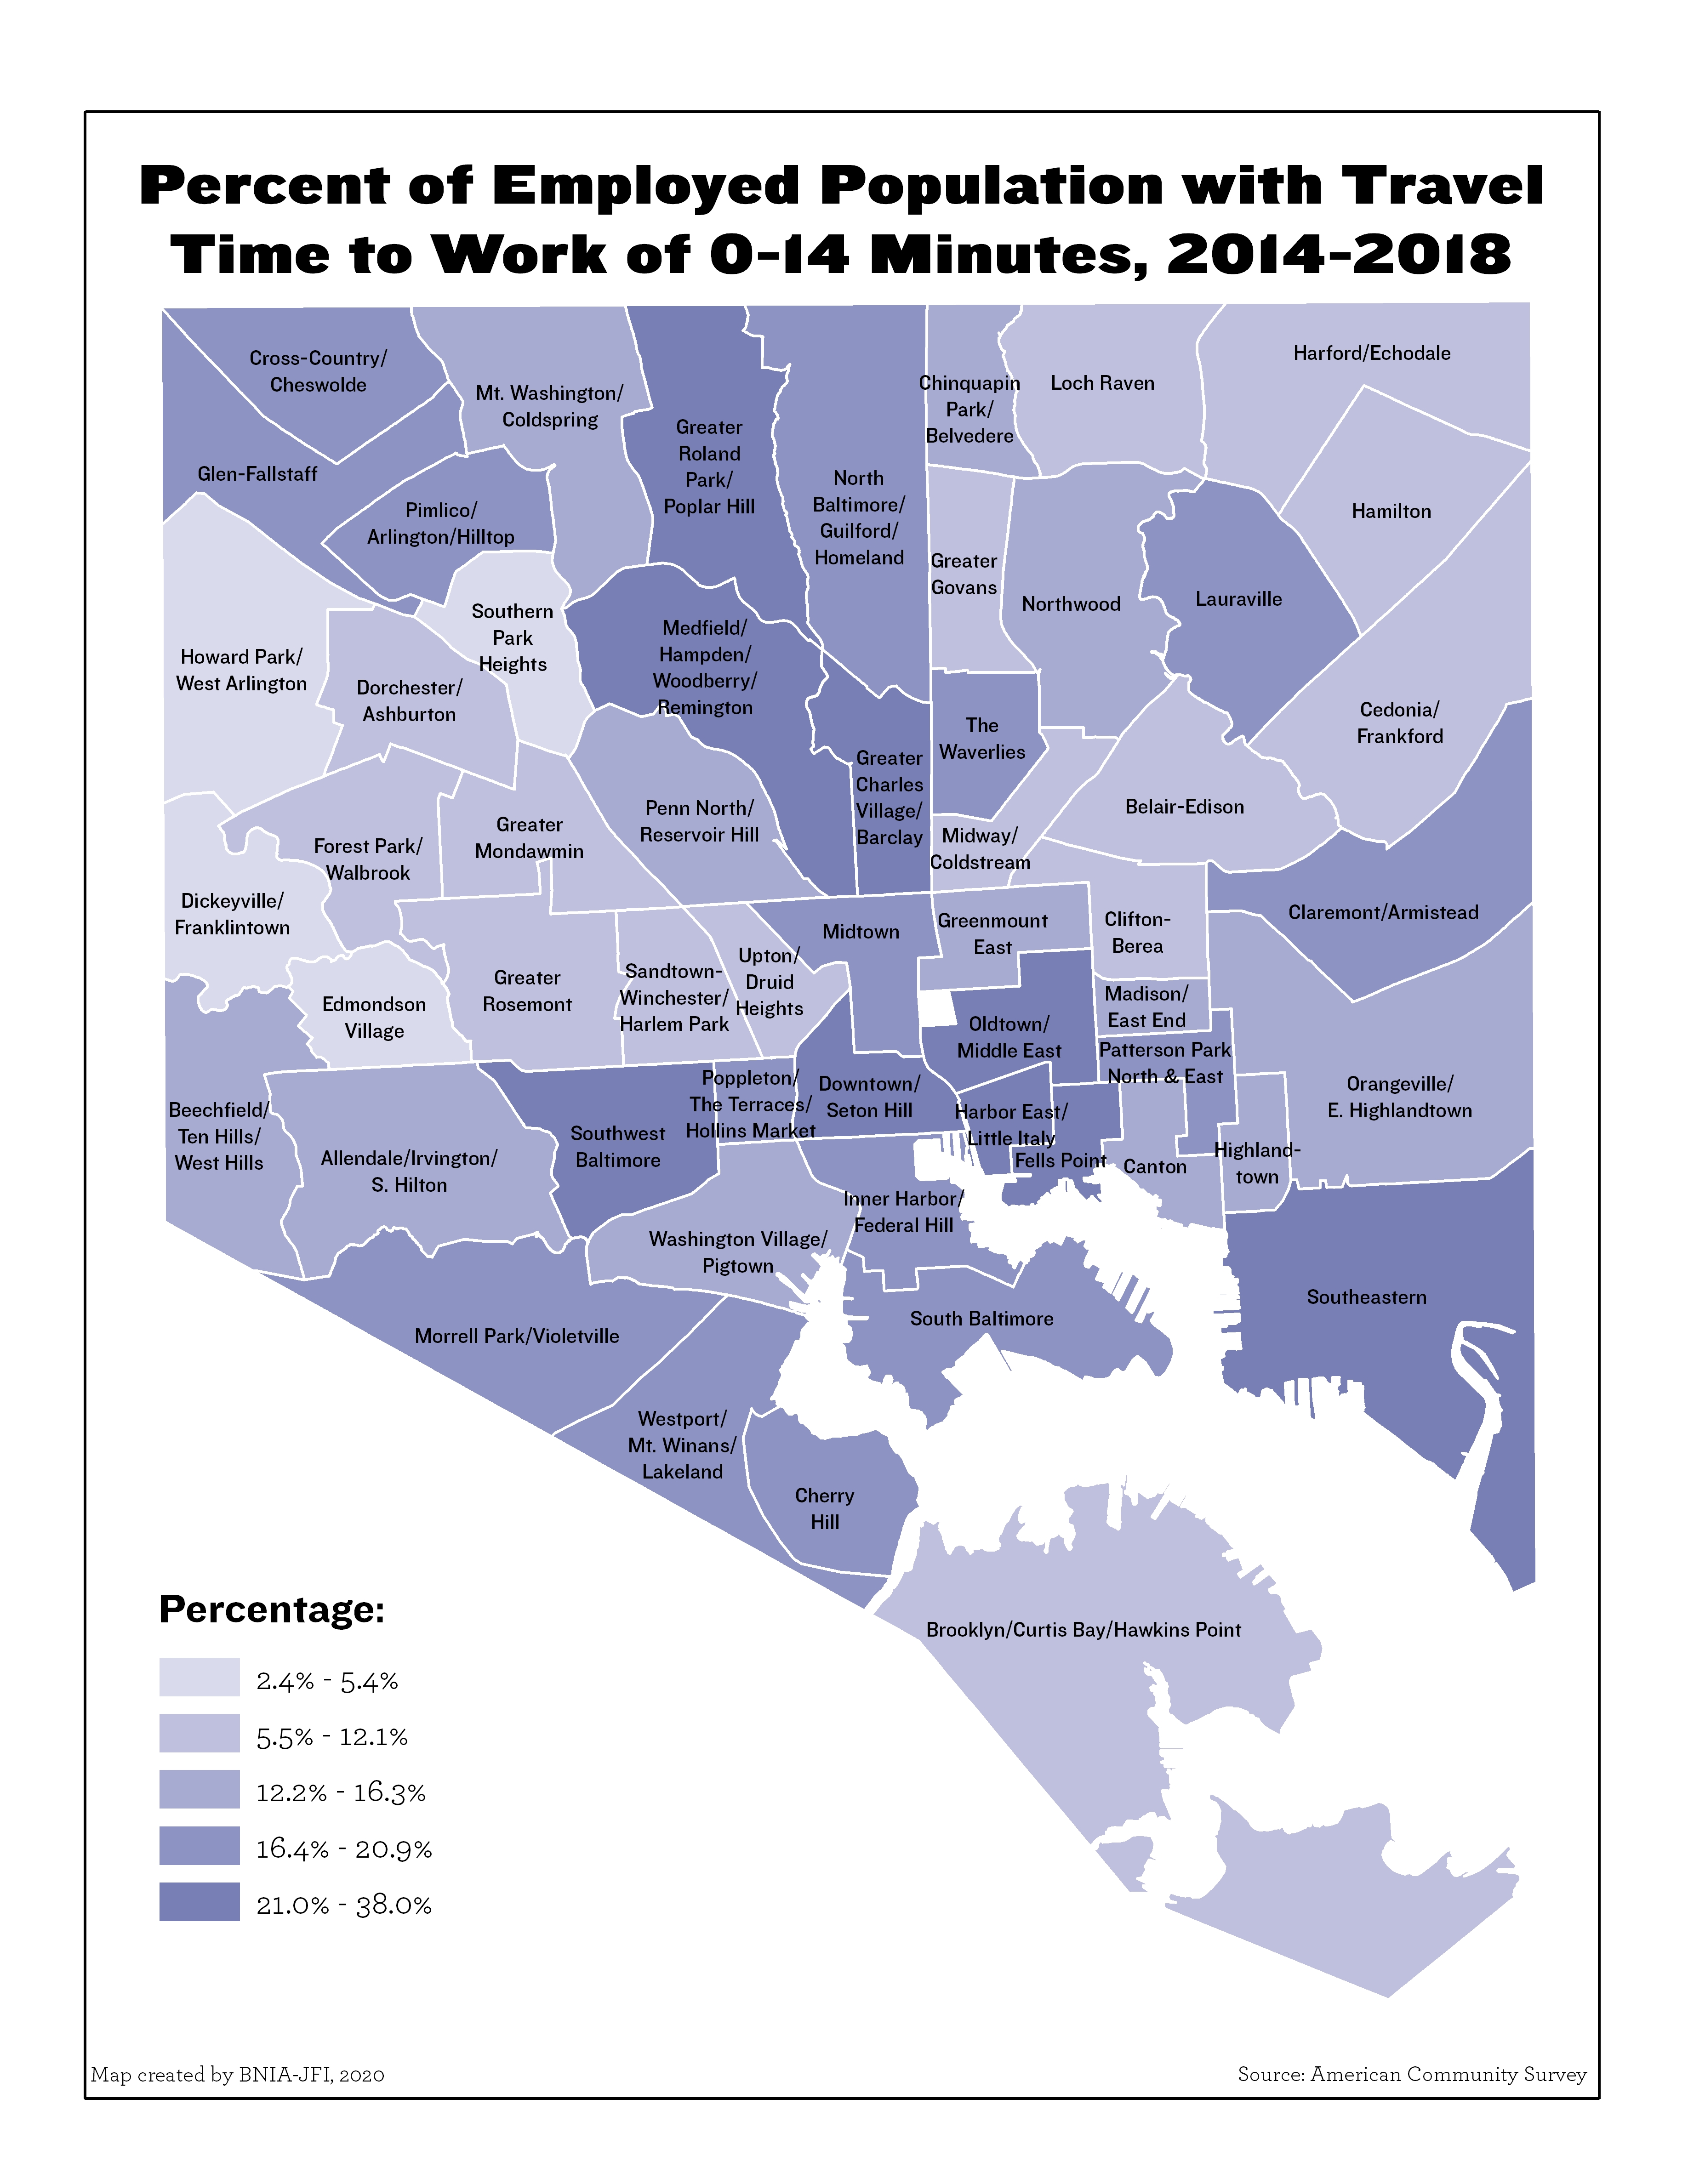
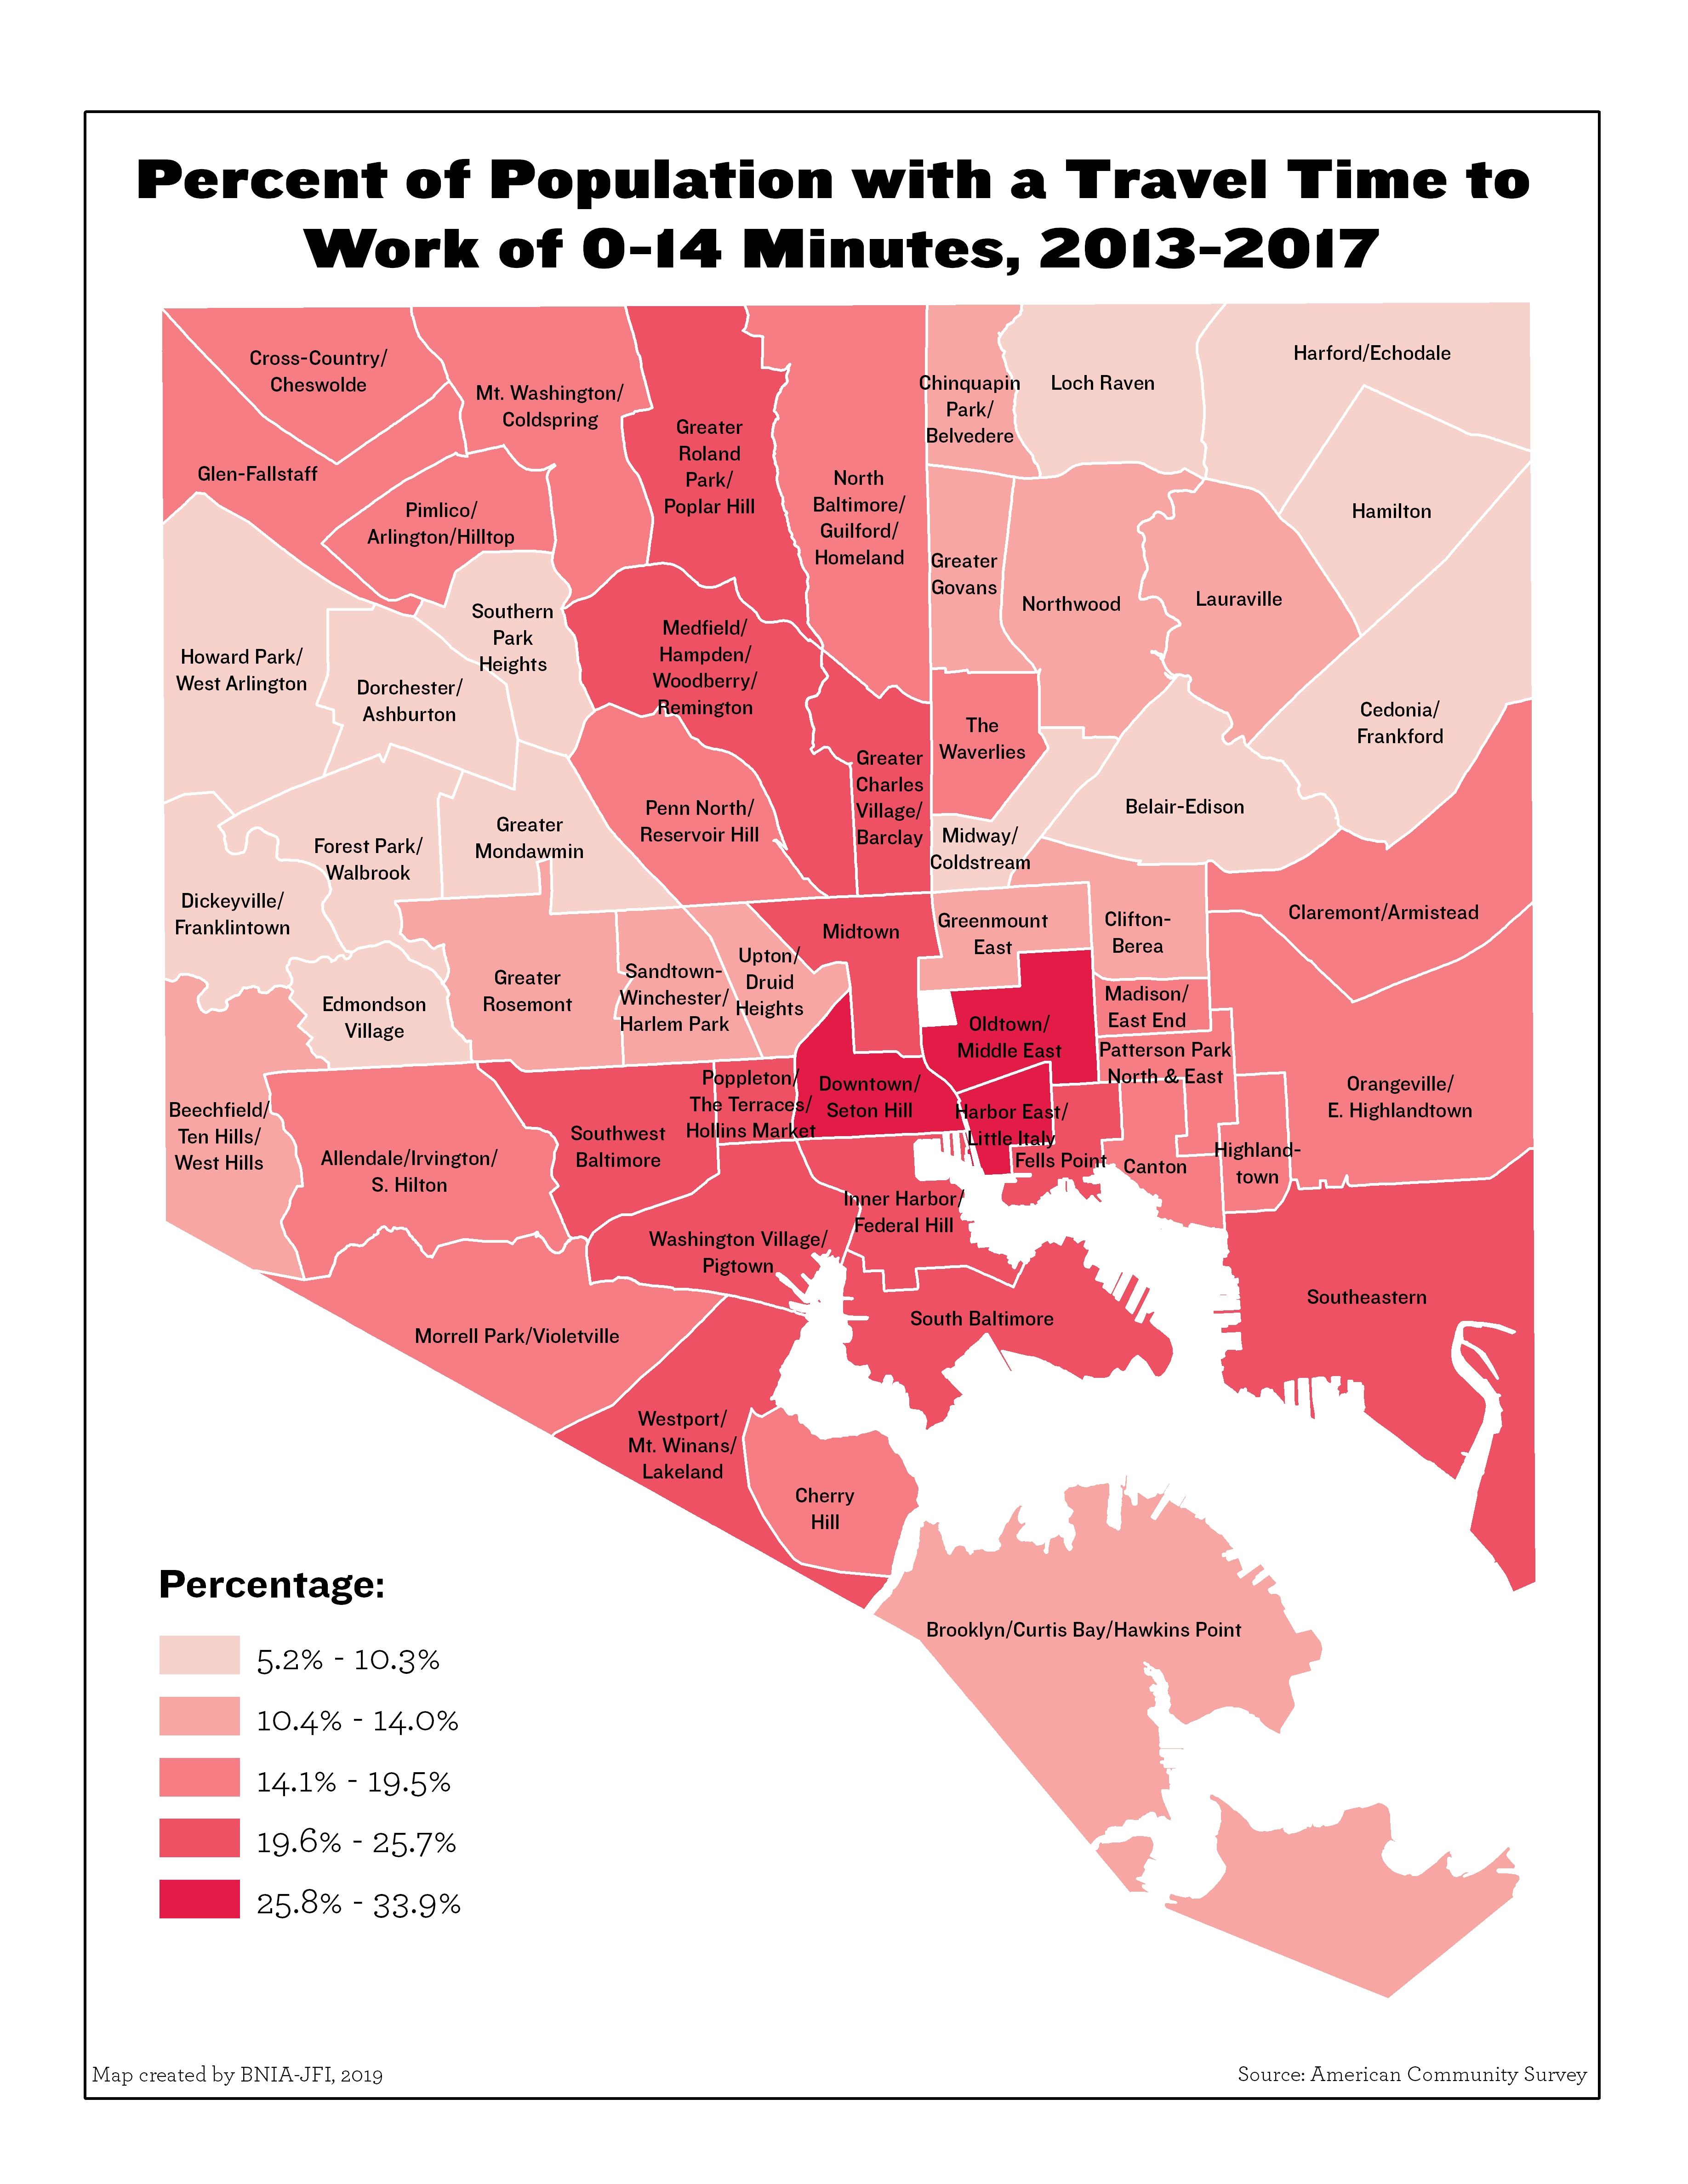
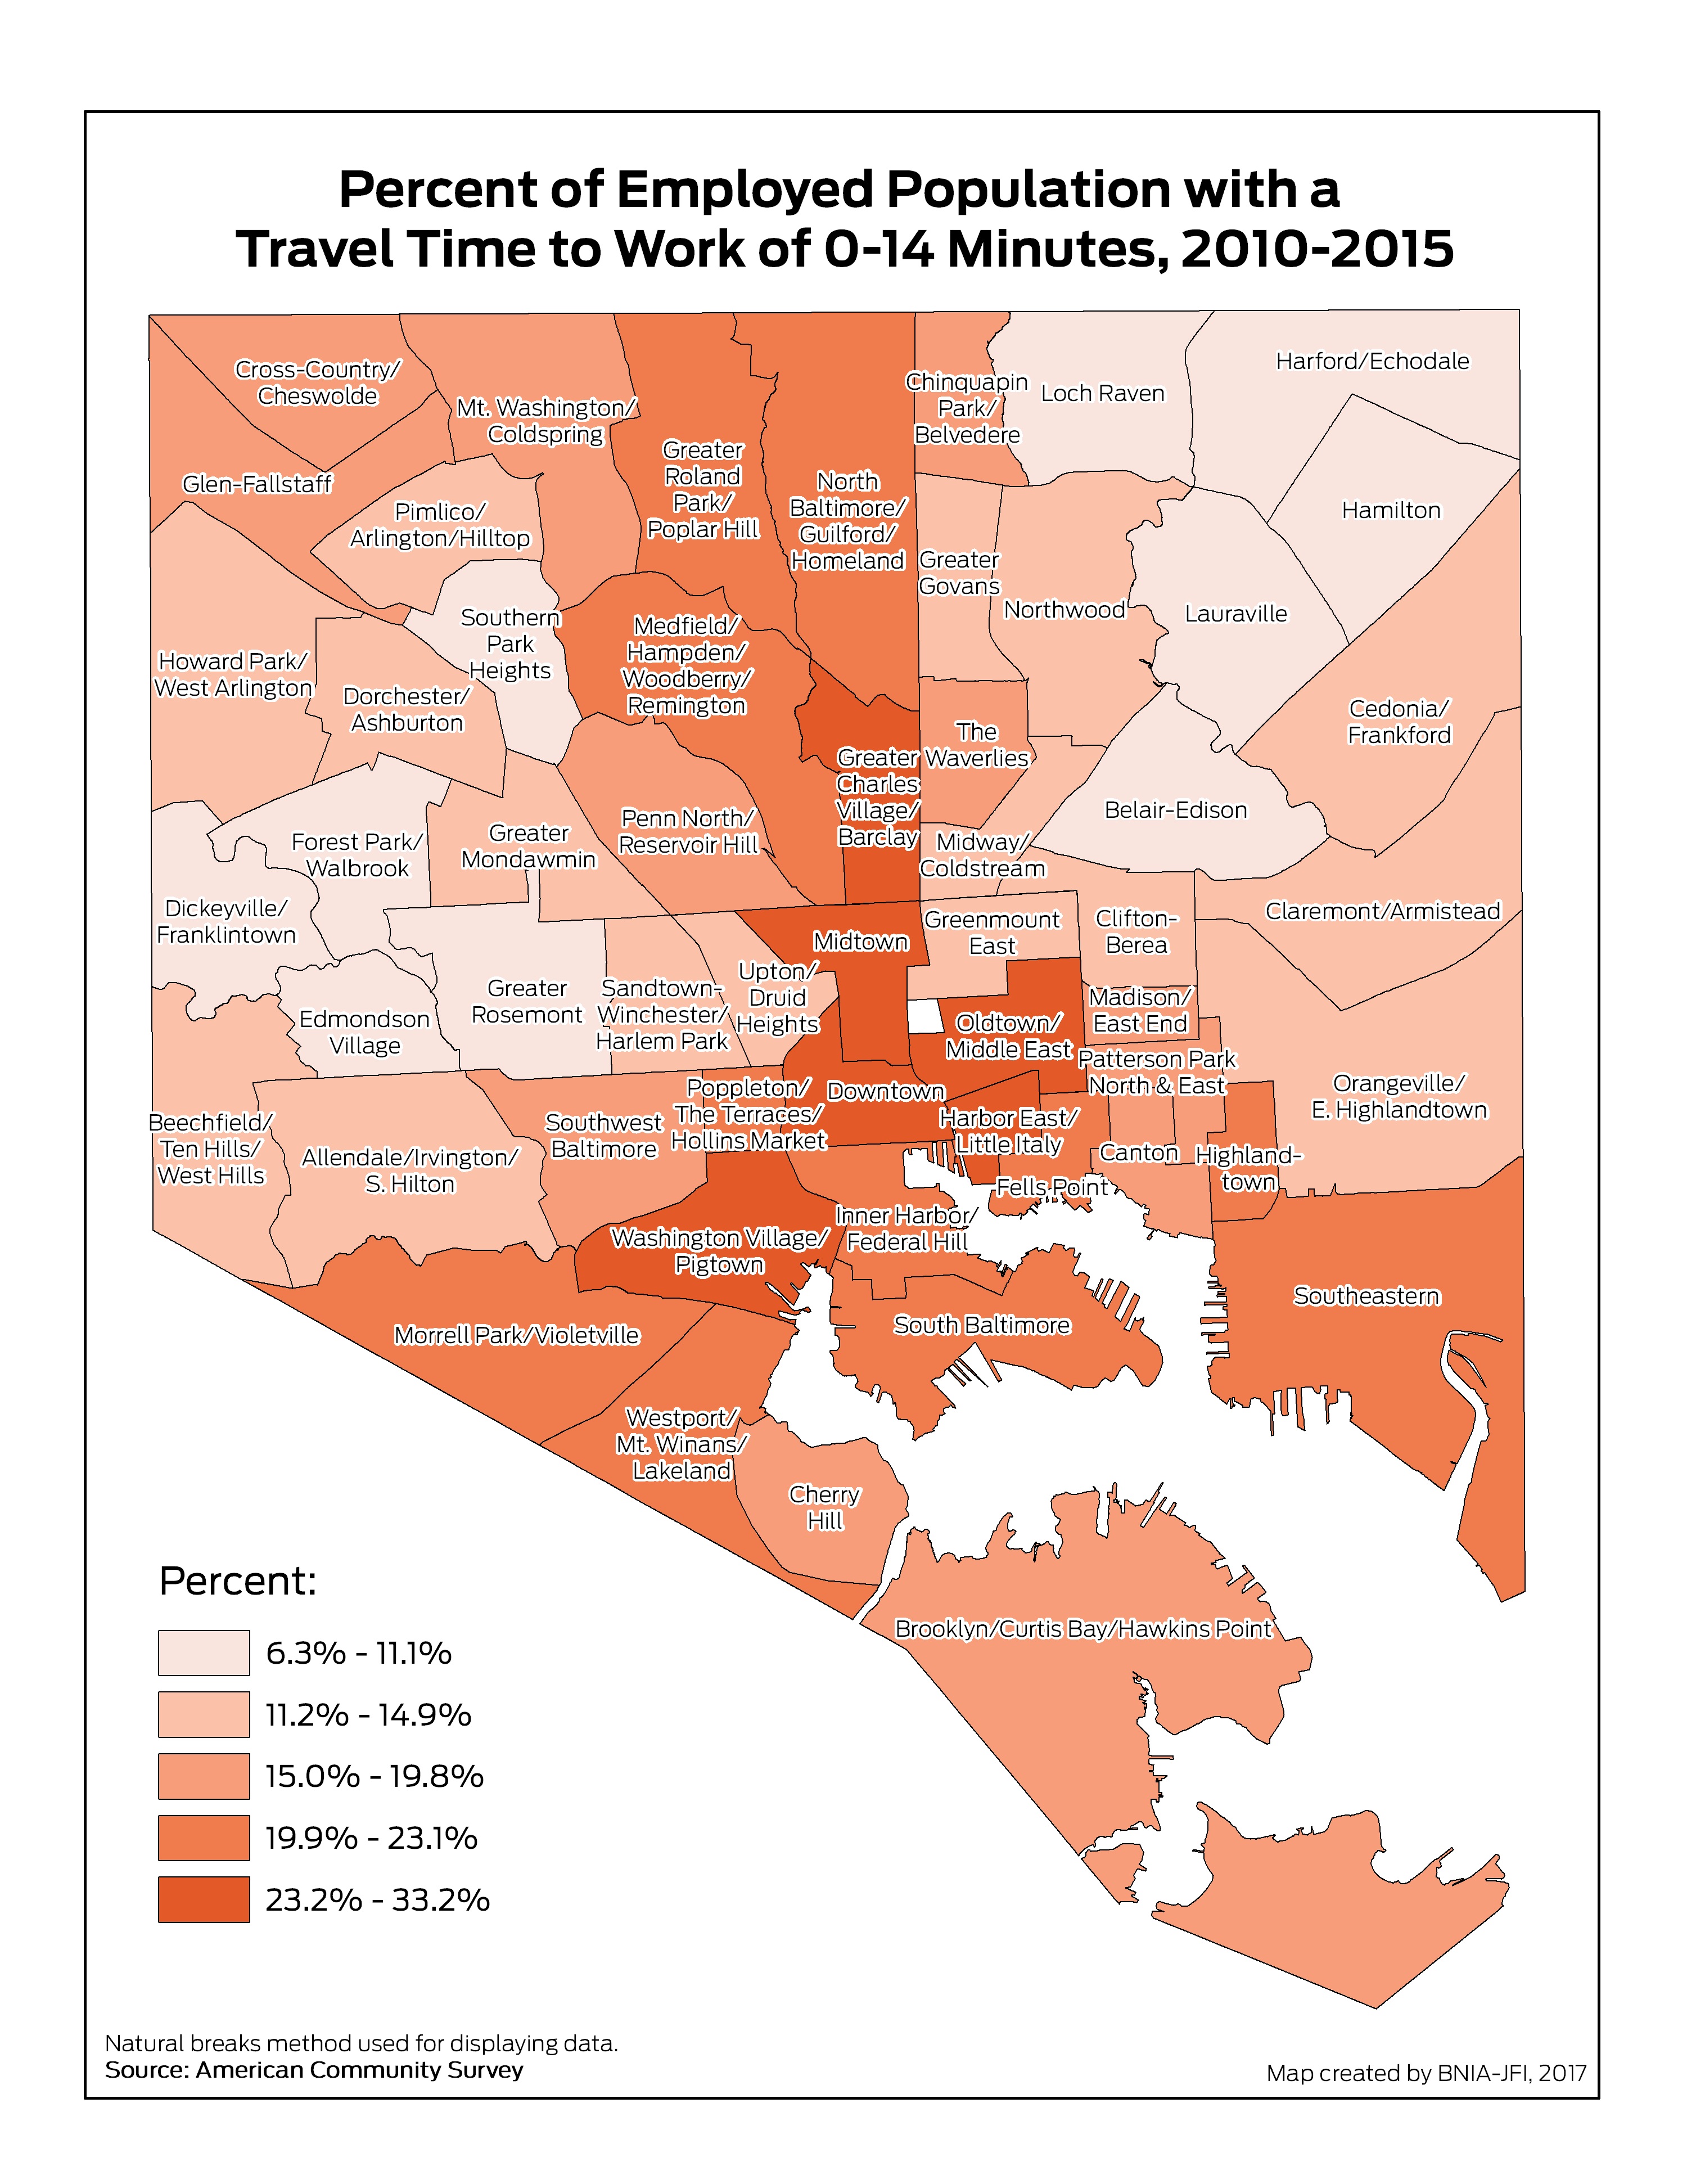
Percent of Employed Population with Travel Time to Work of 0-14 Minutes (2020)
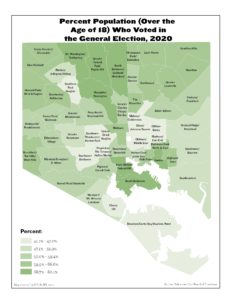
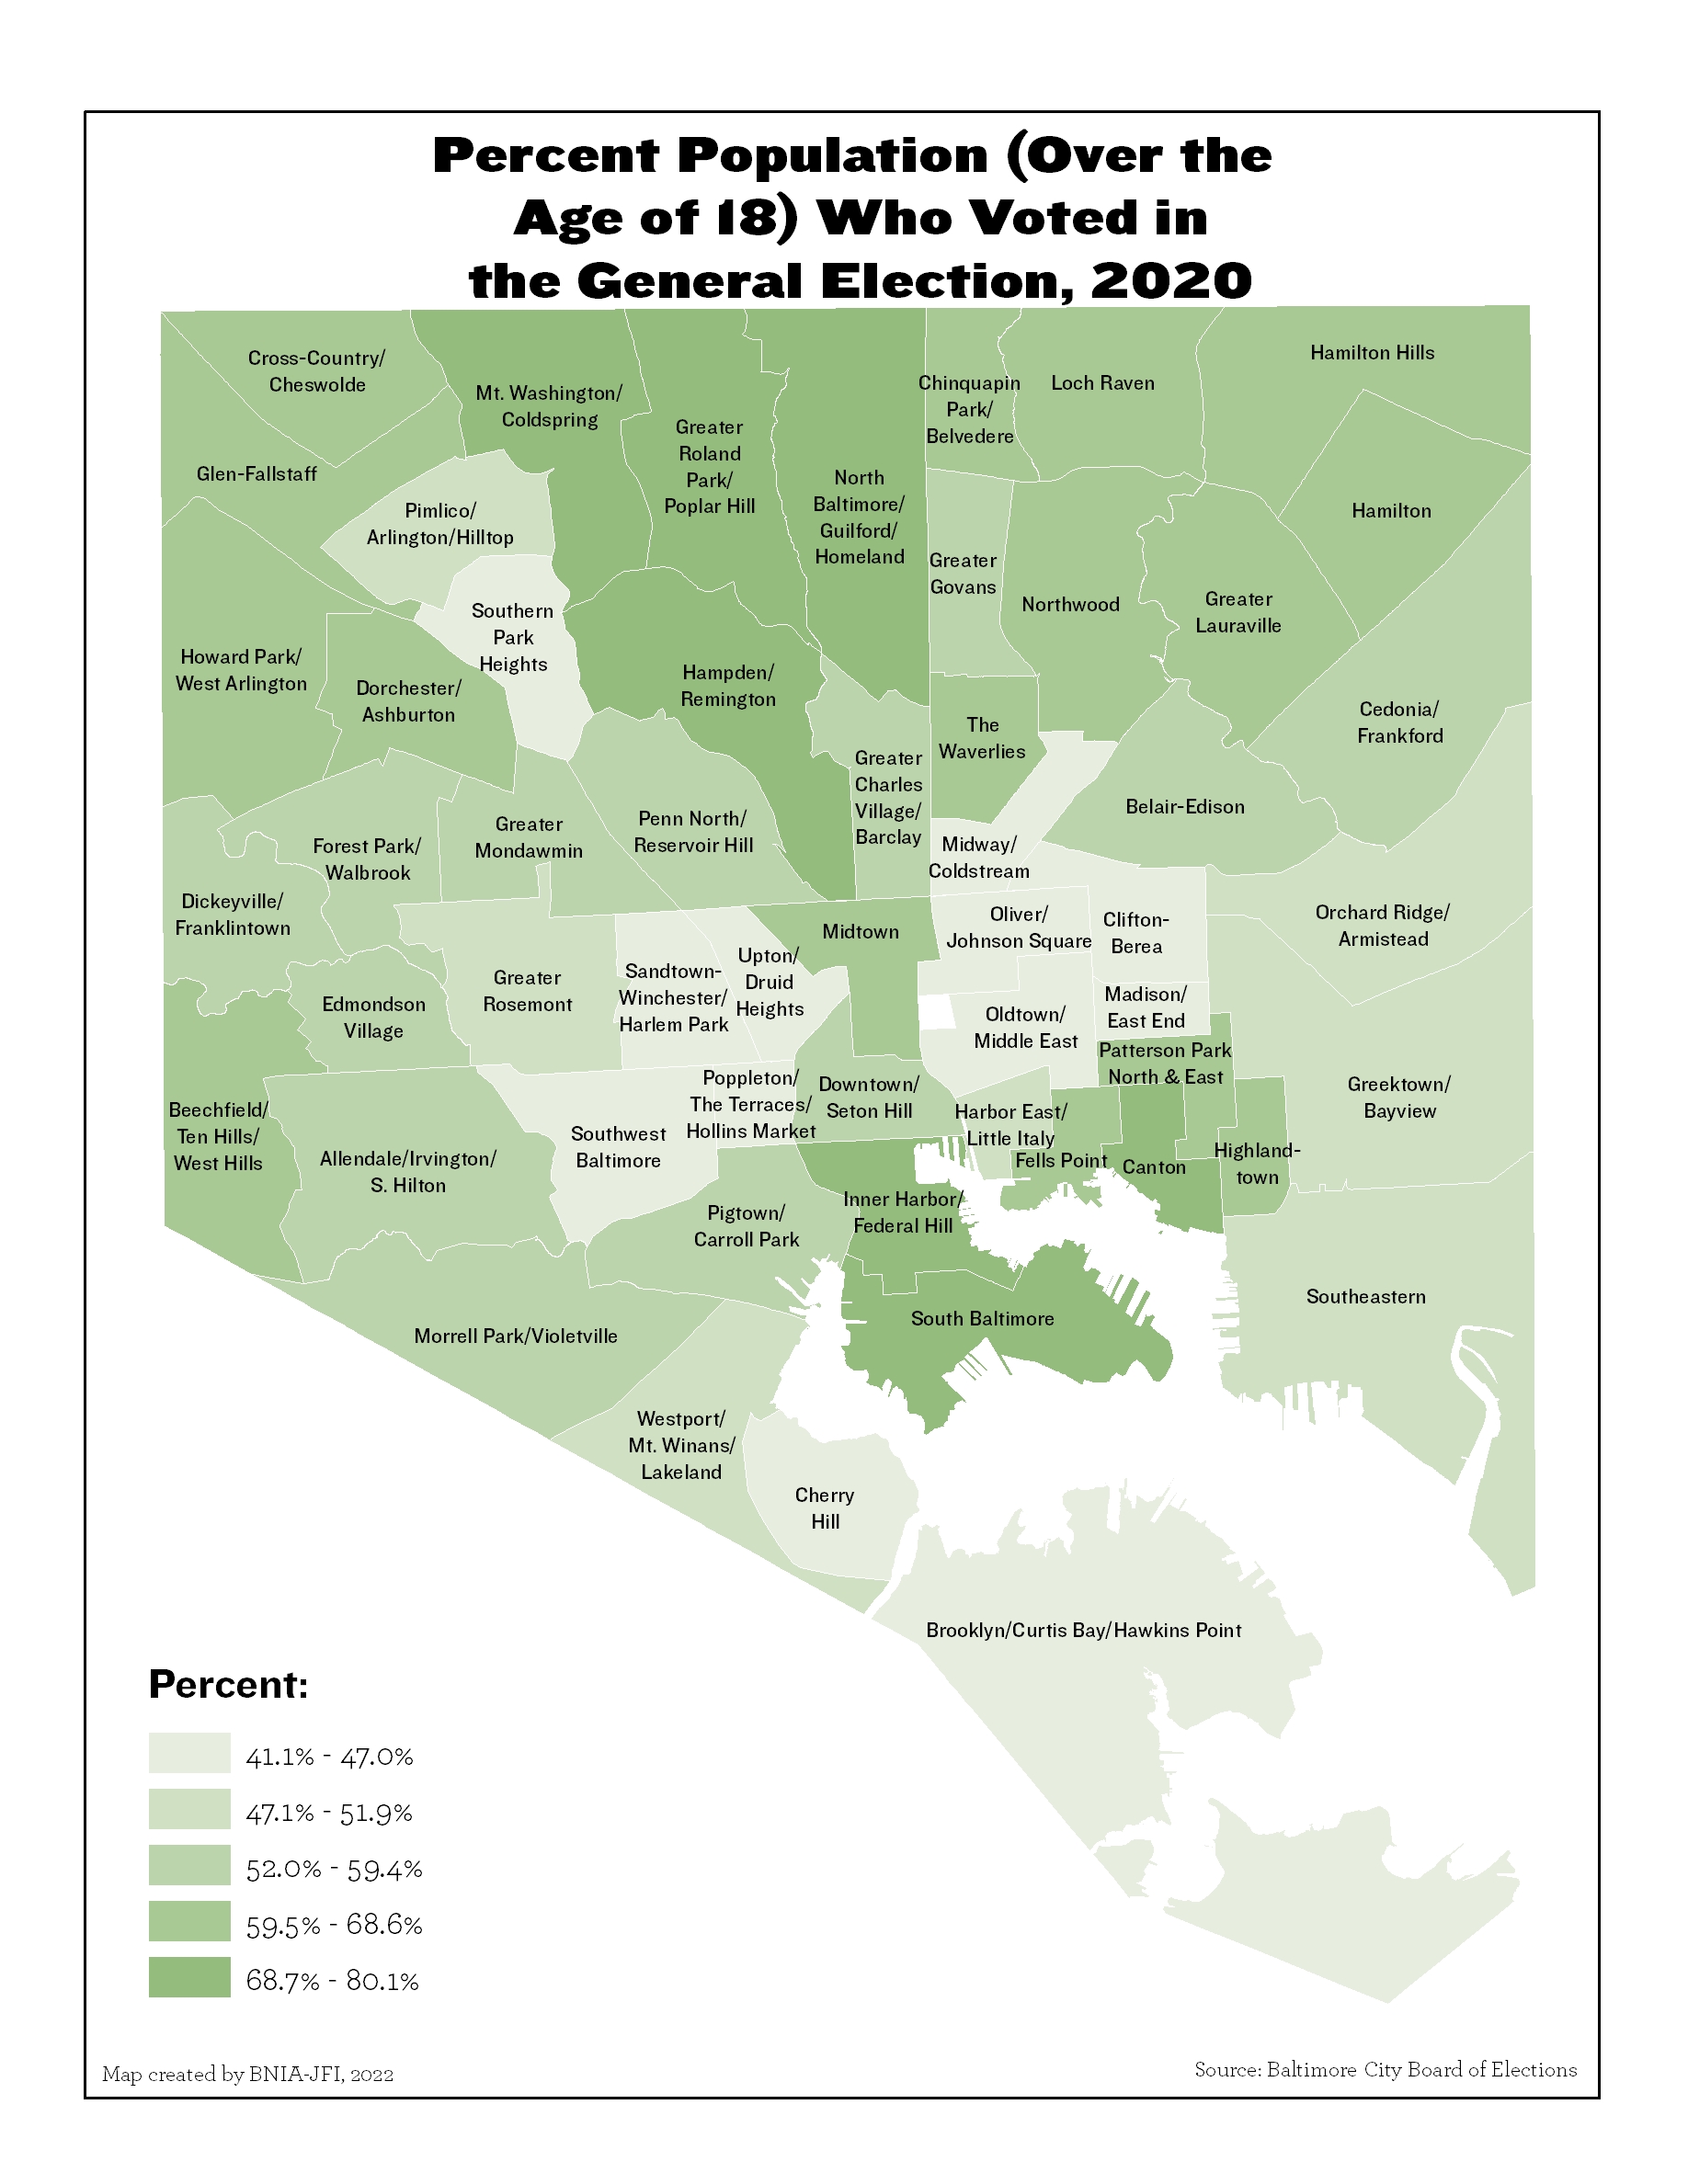
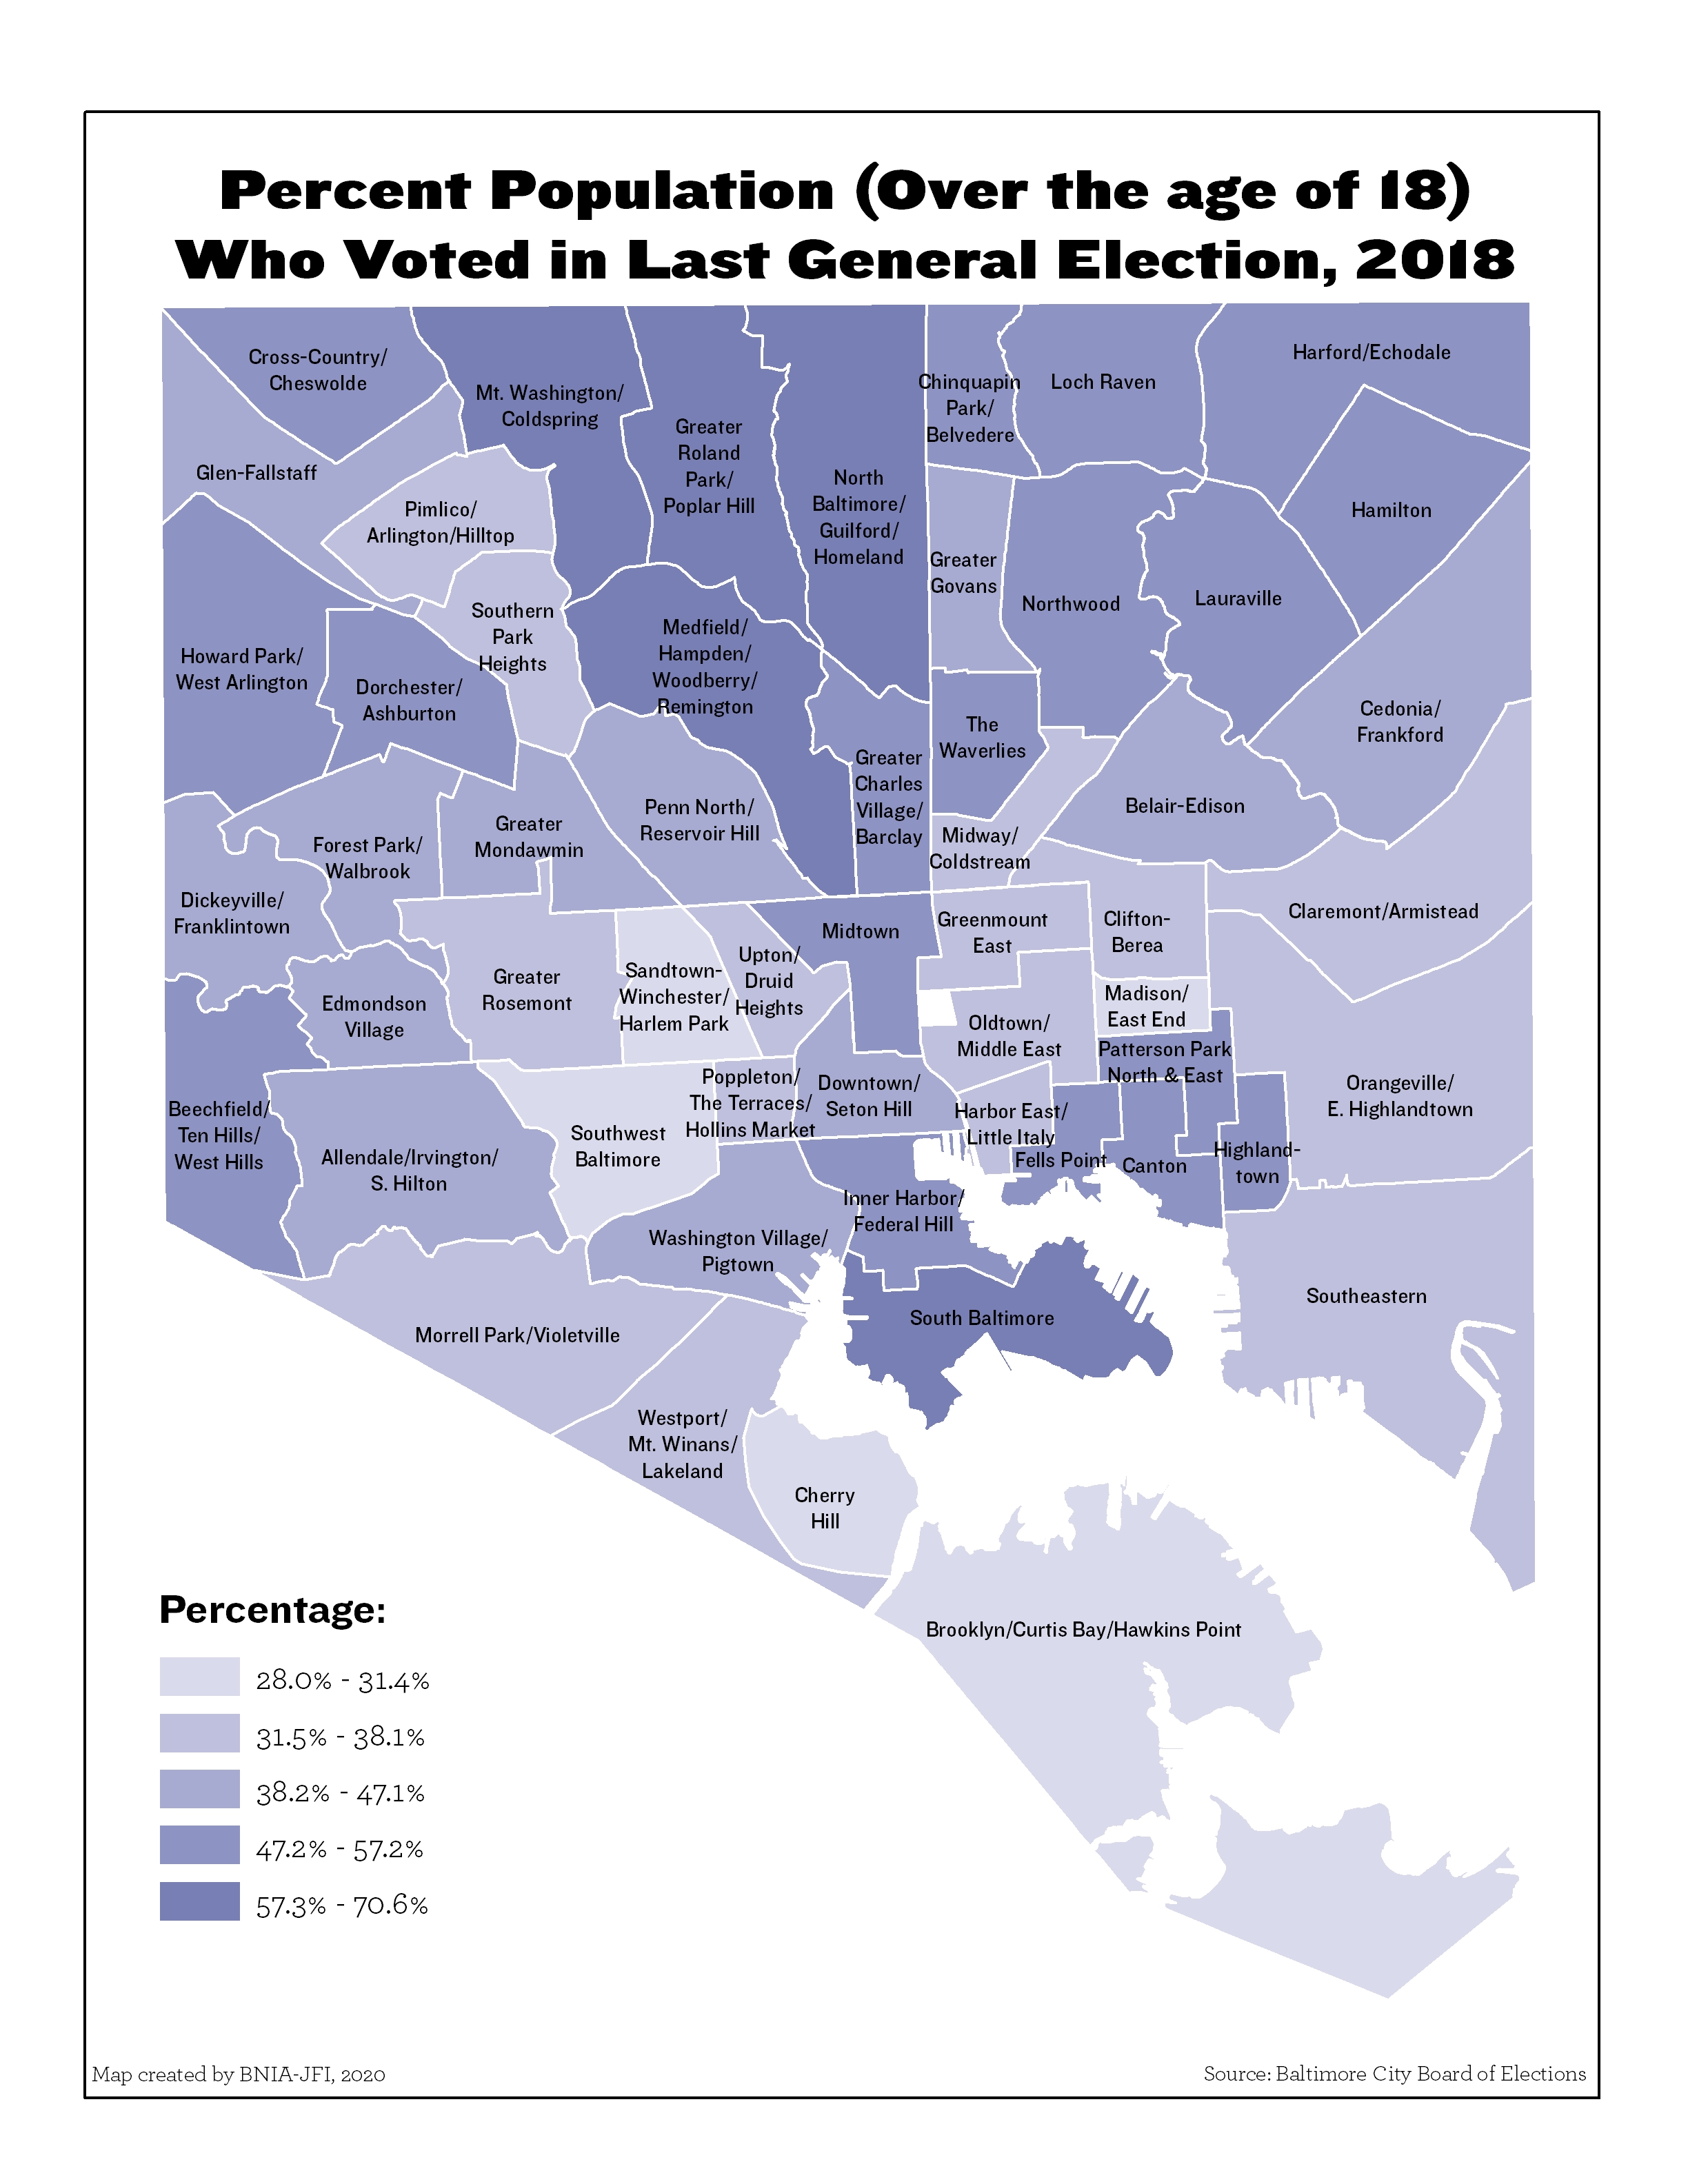
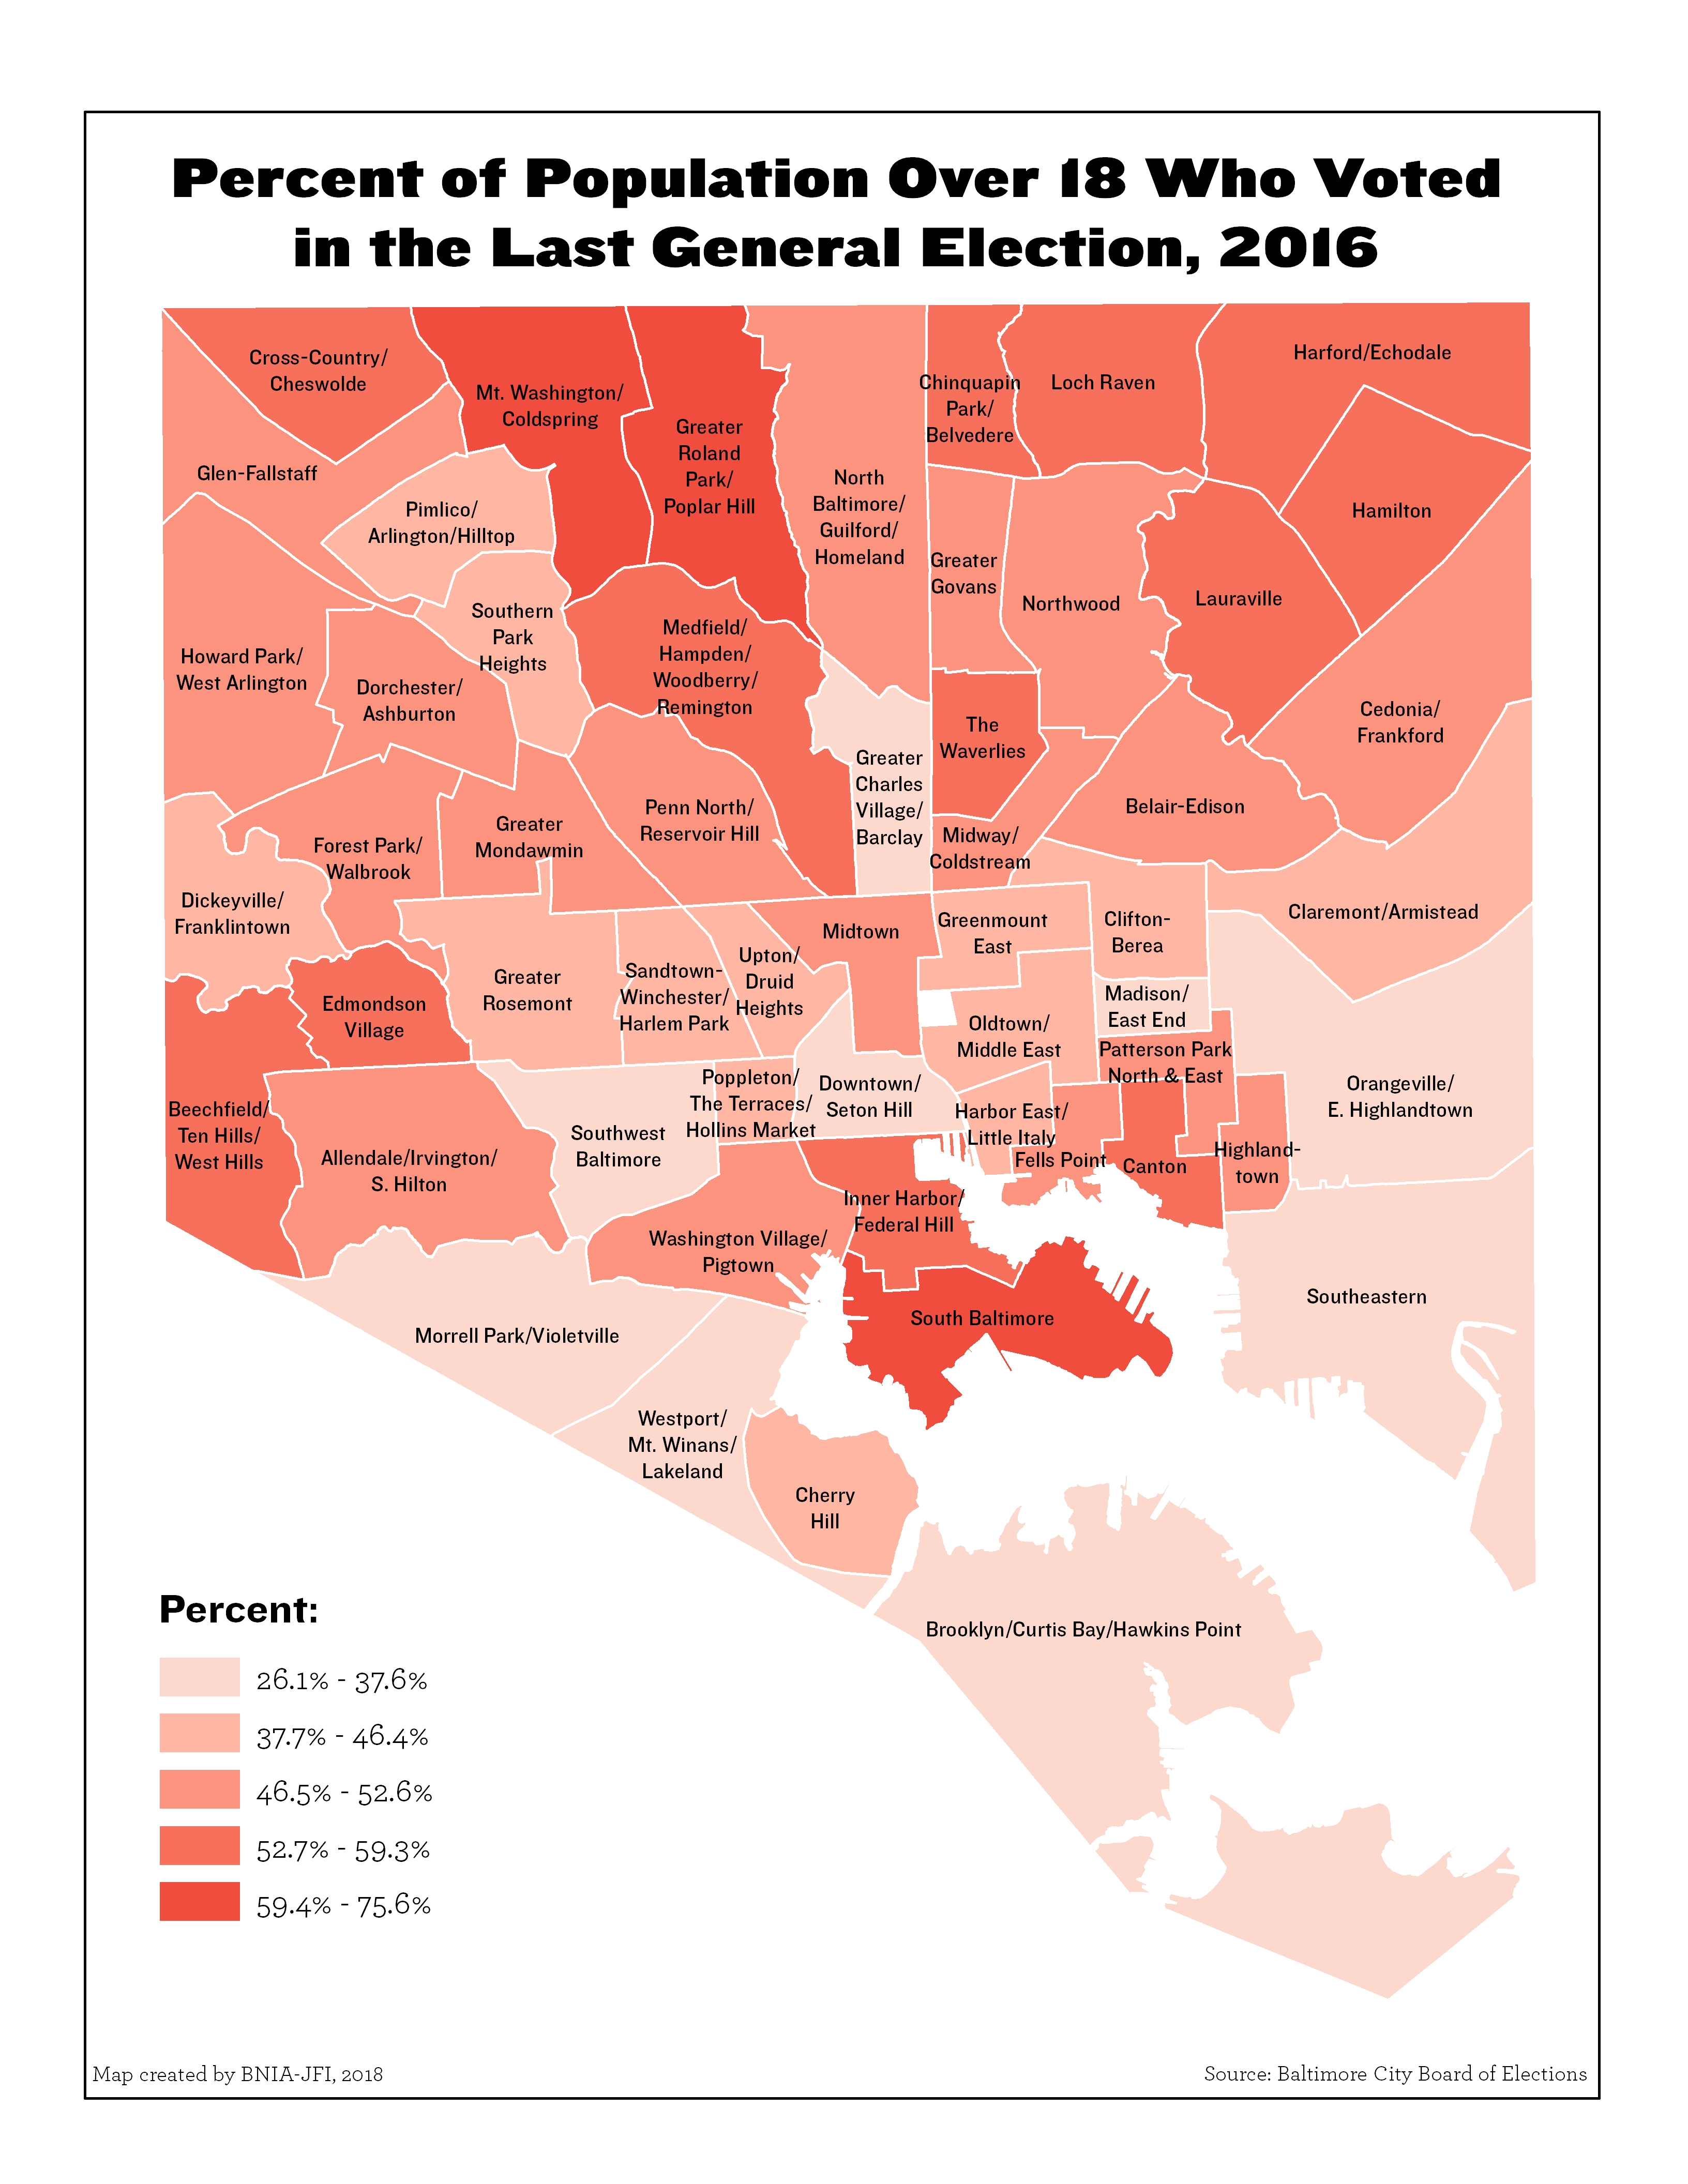
Percent Population (Over the Age of 18) Who Voted in the General Election
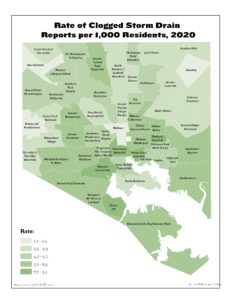
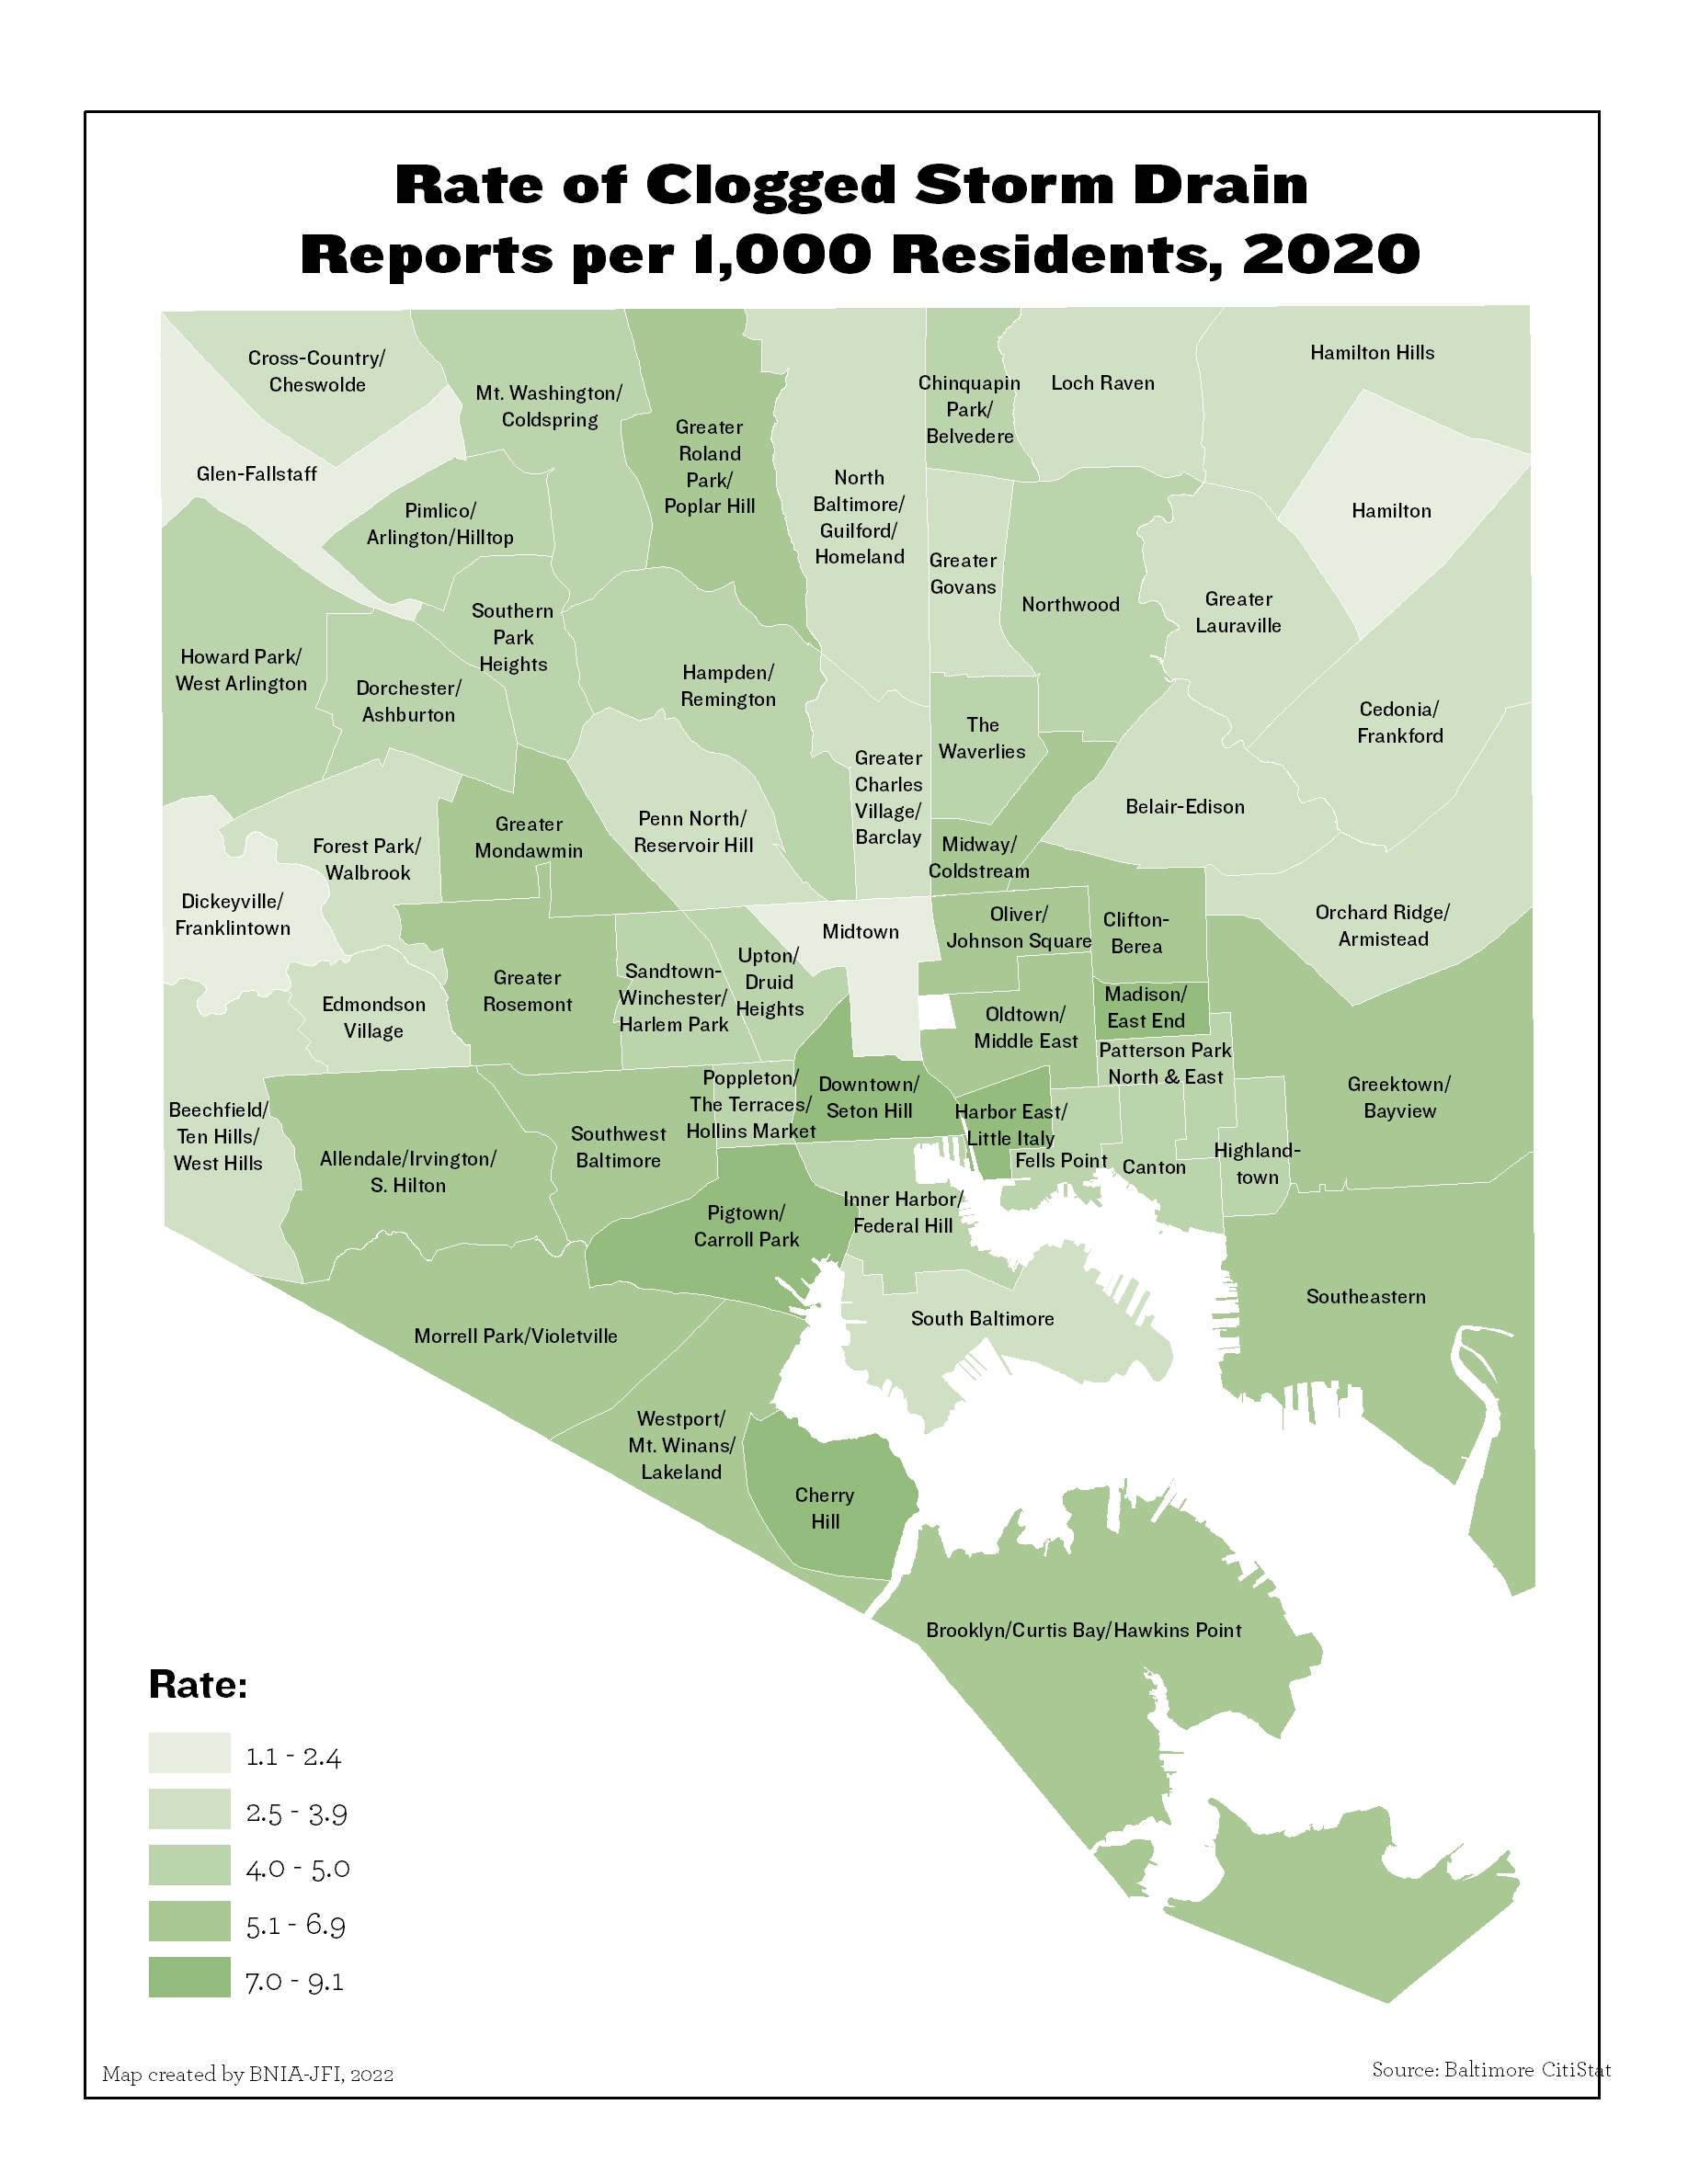
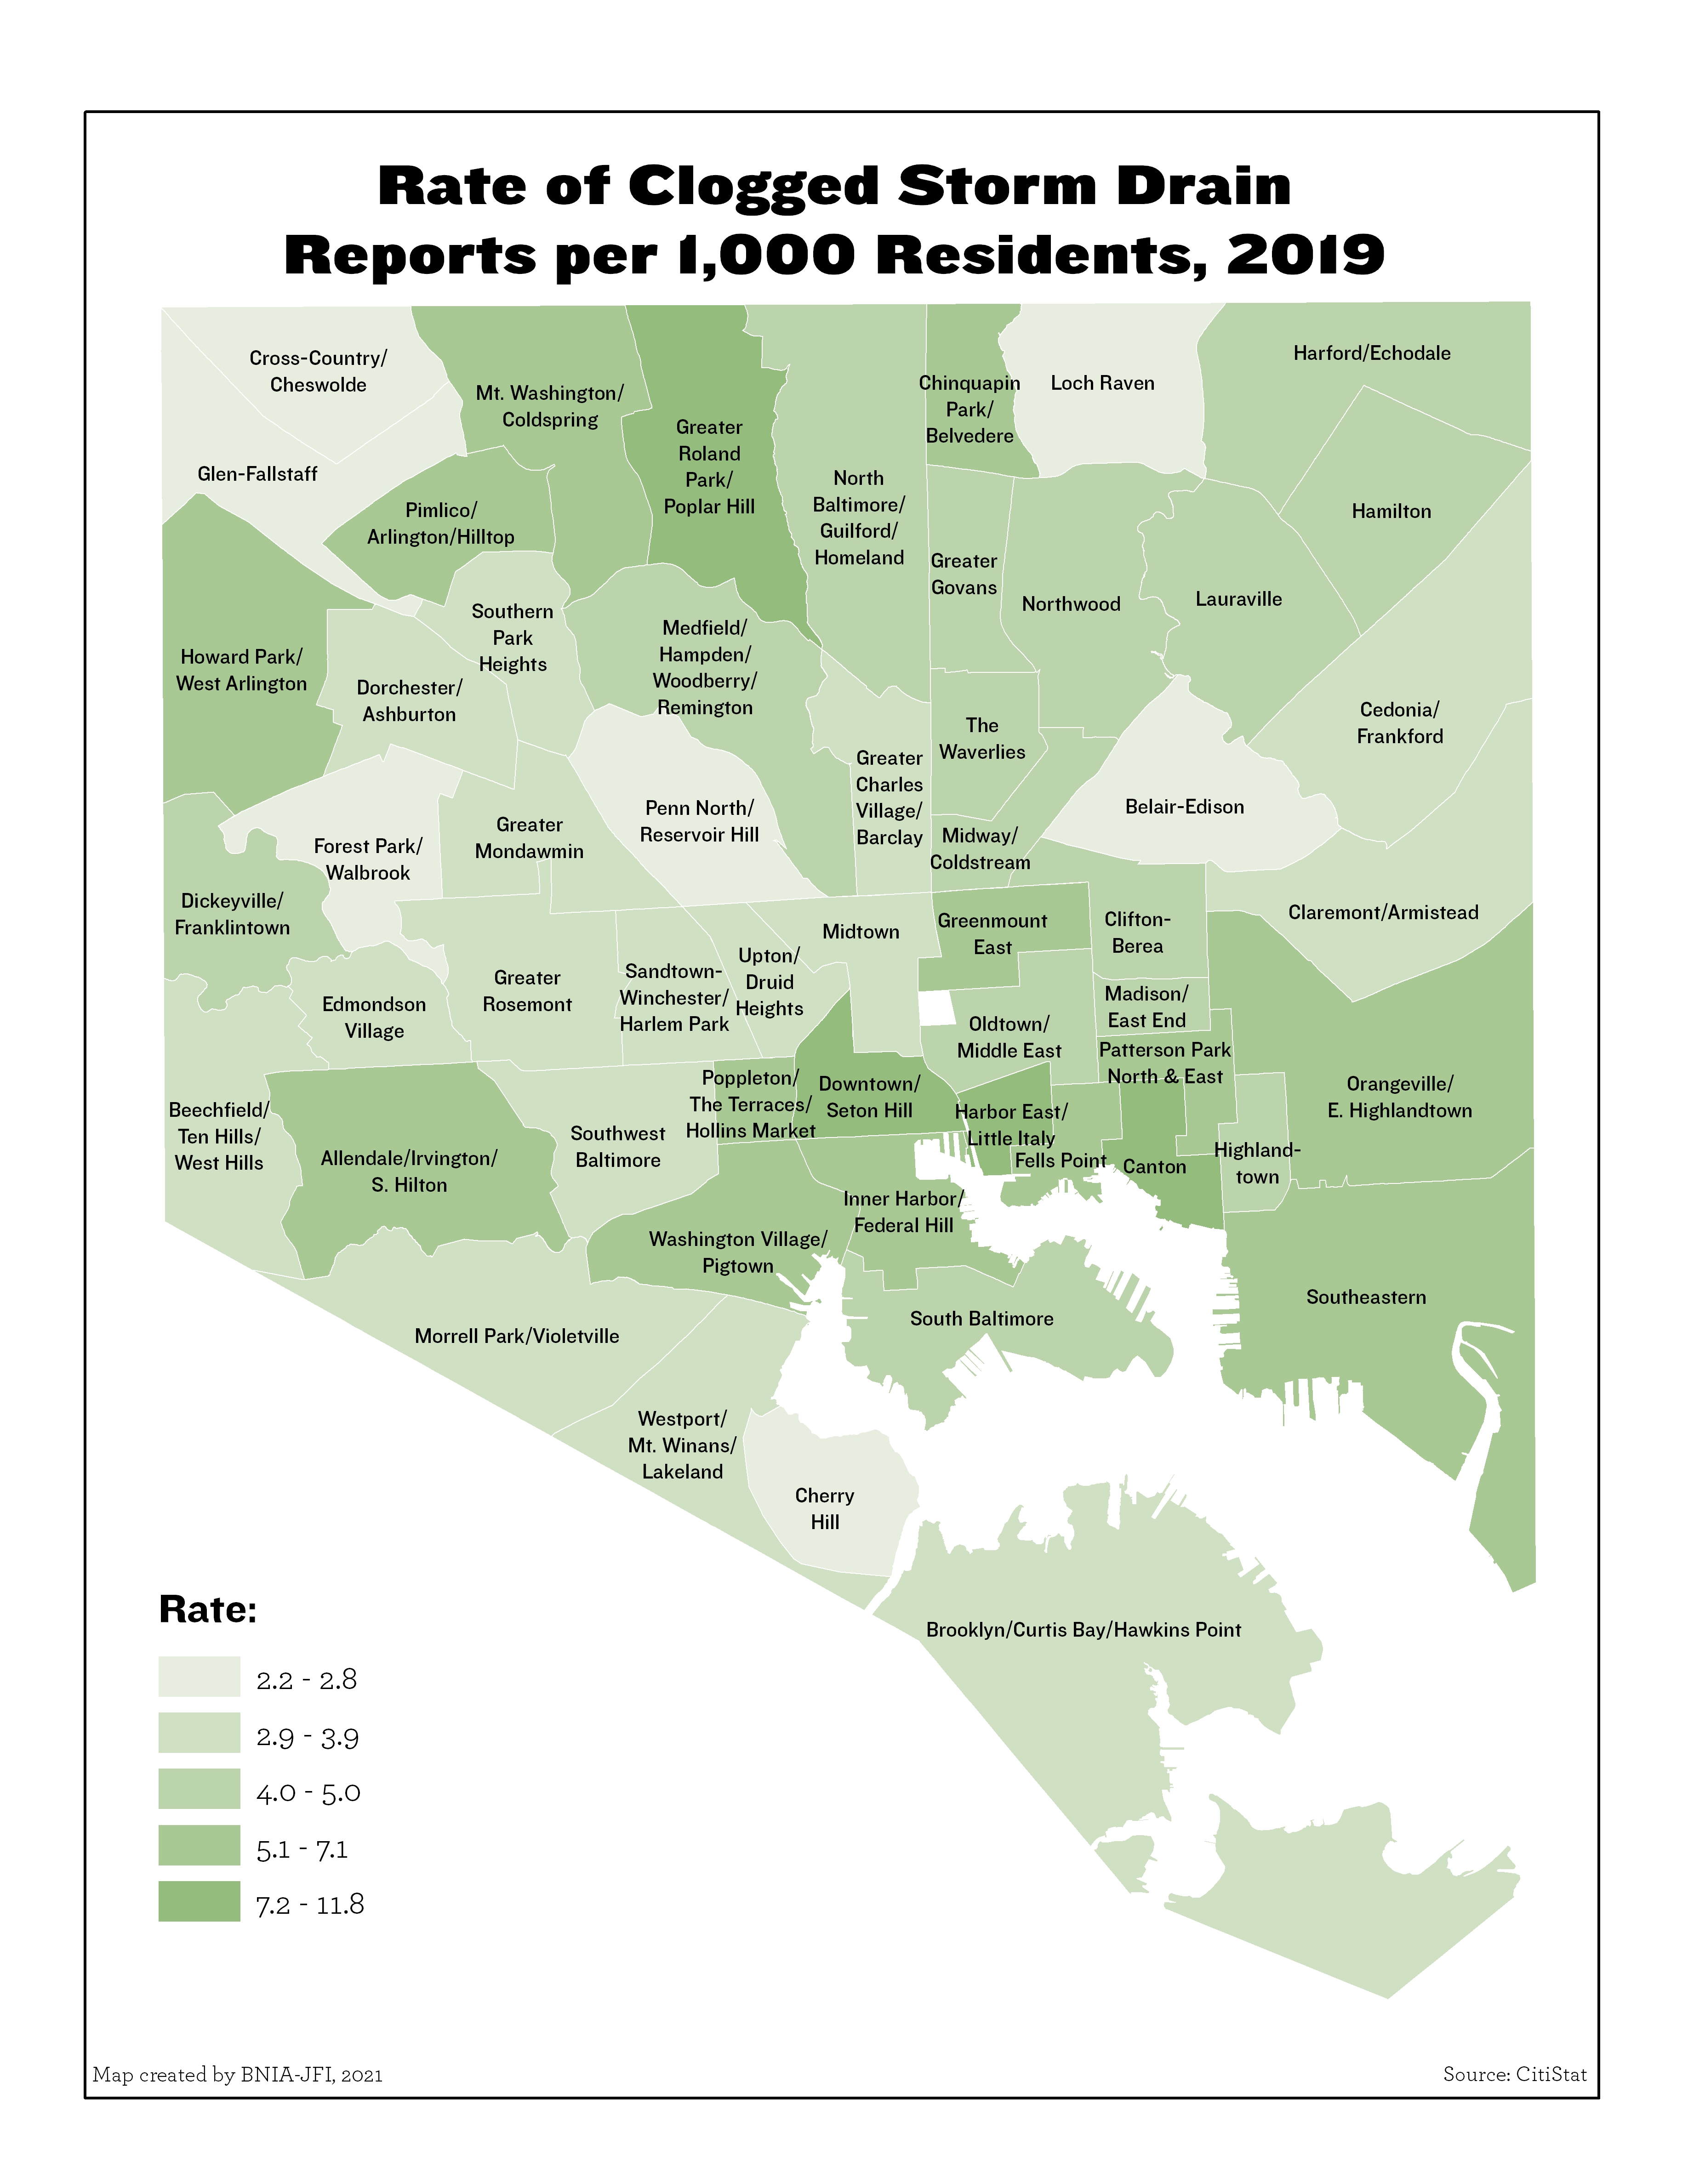
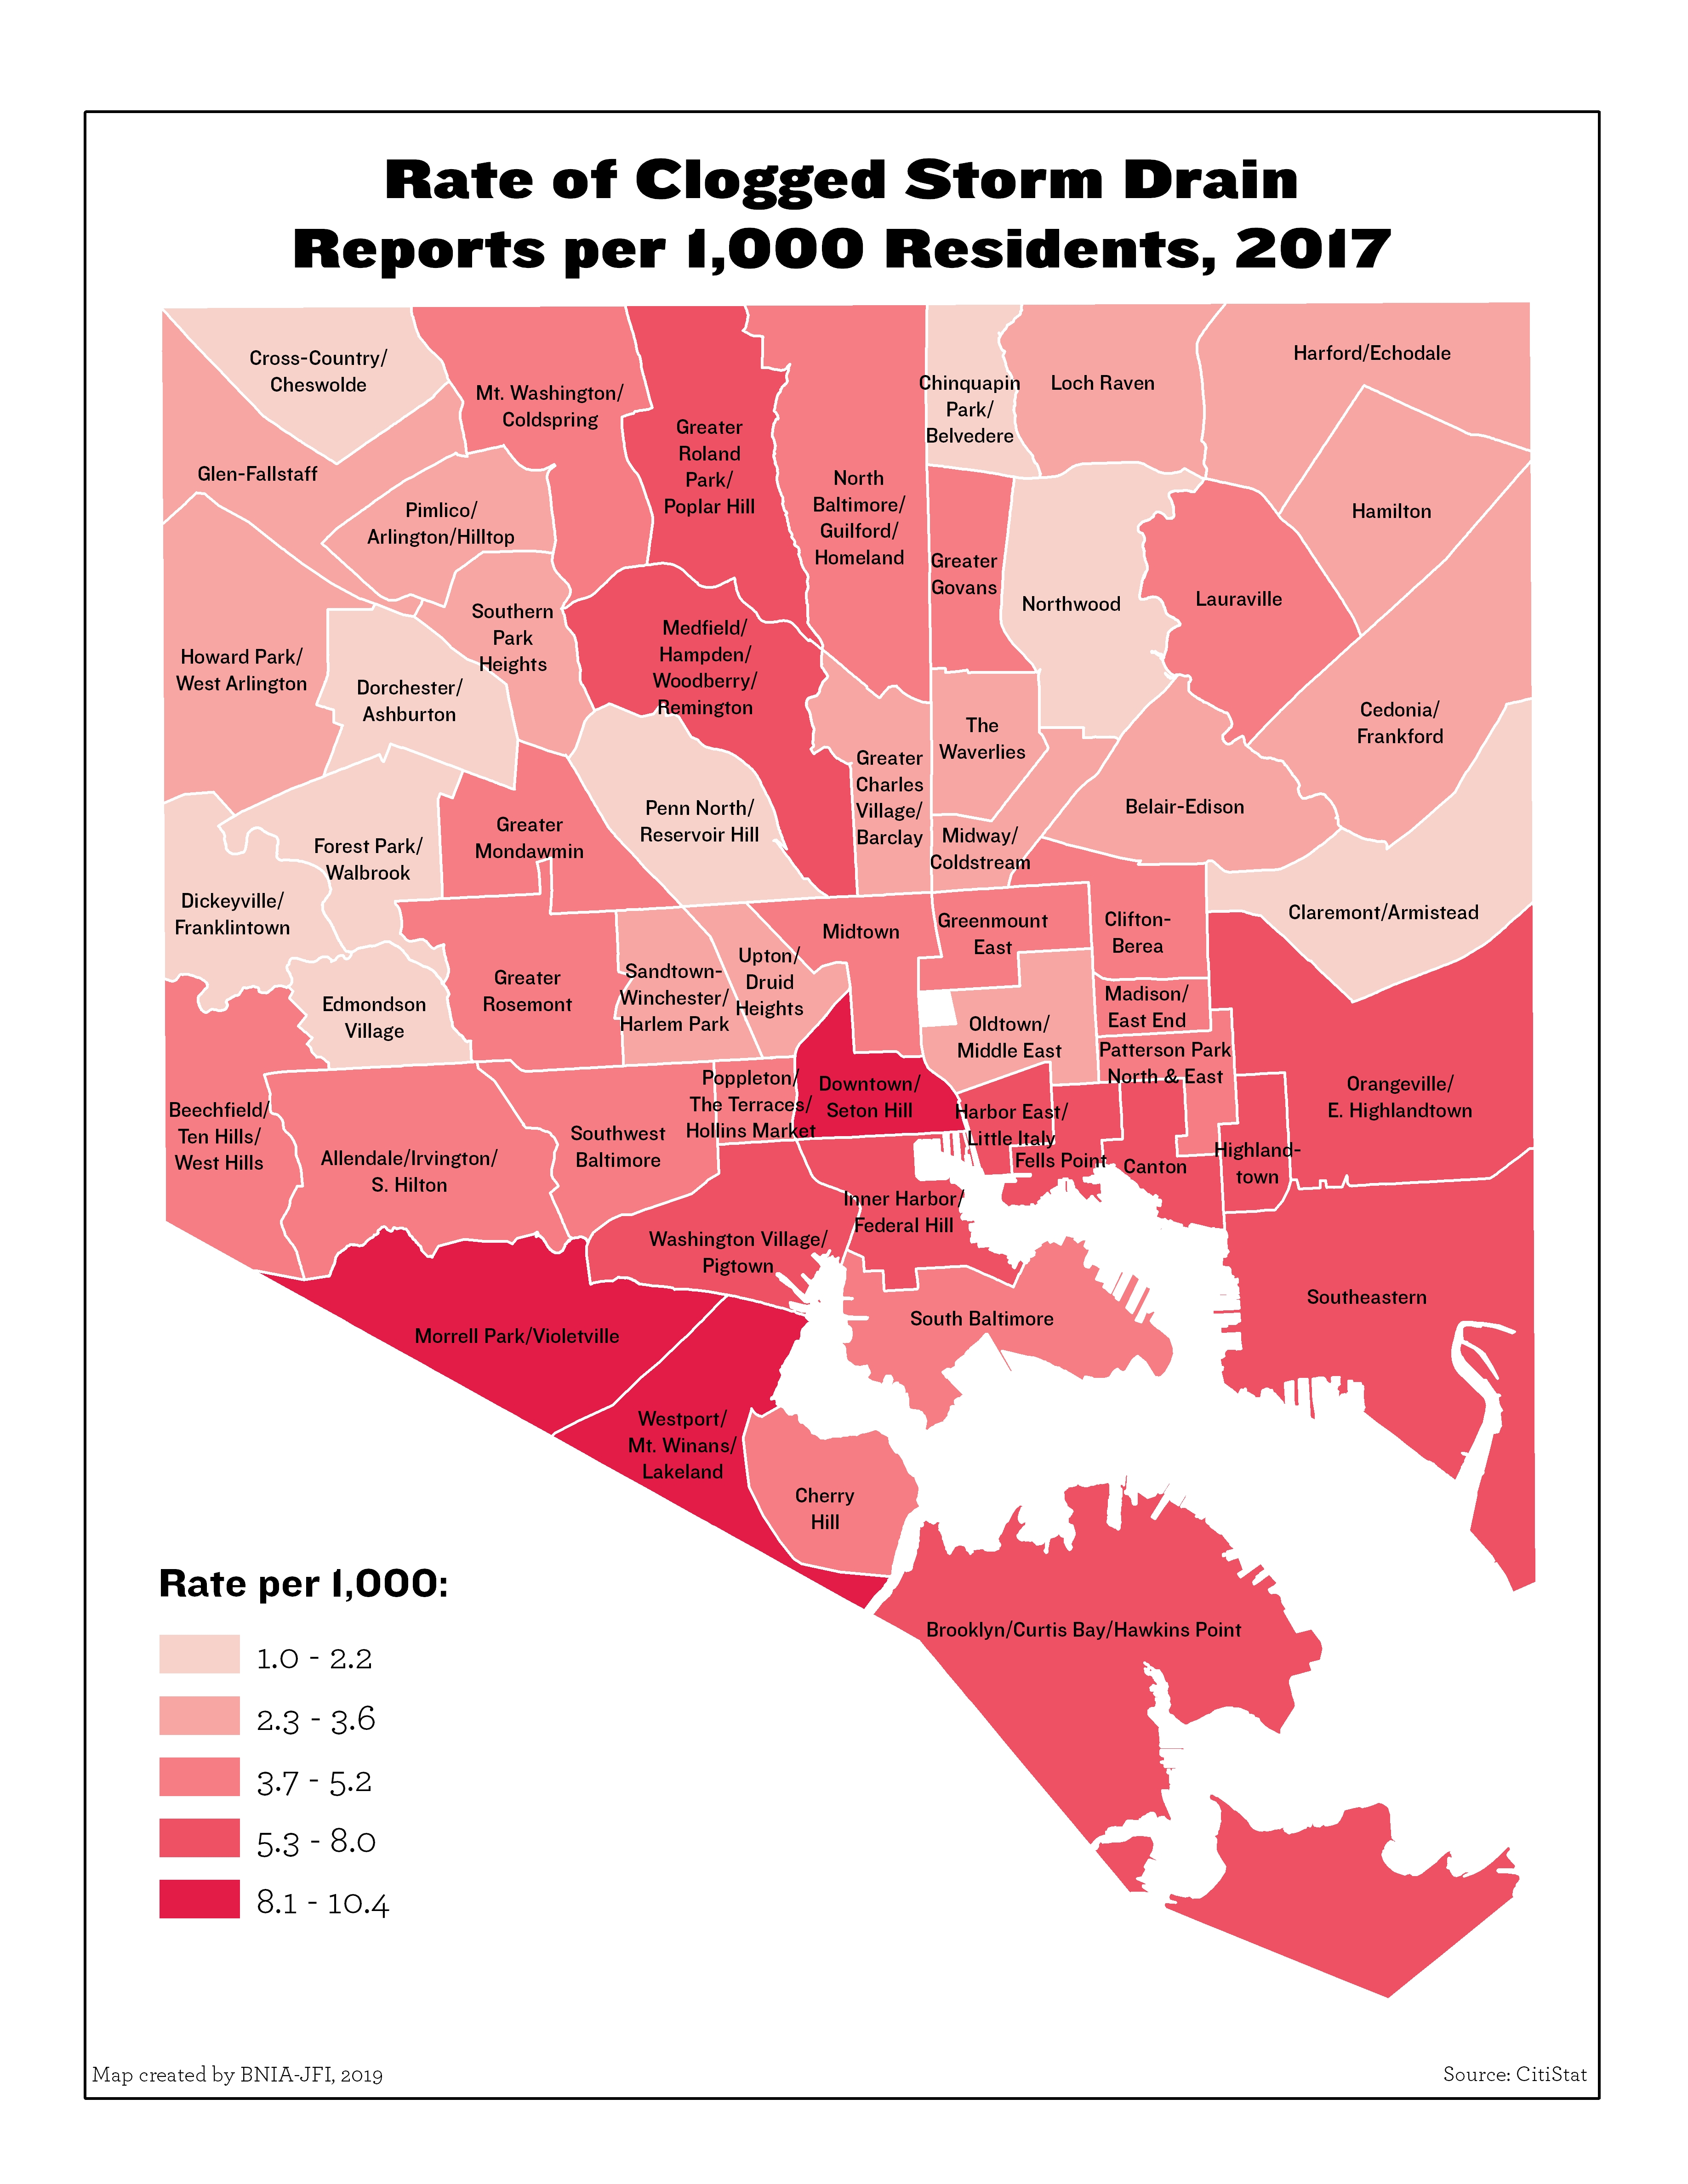
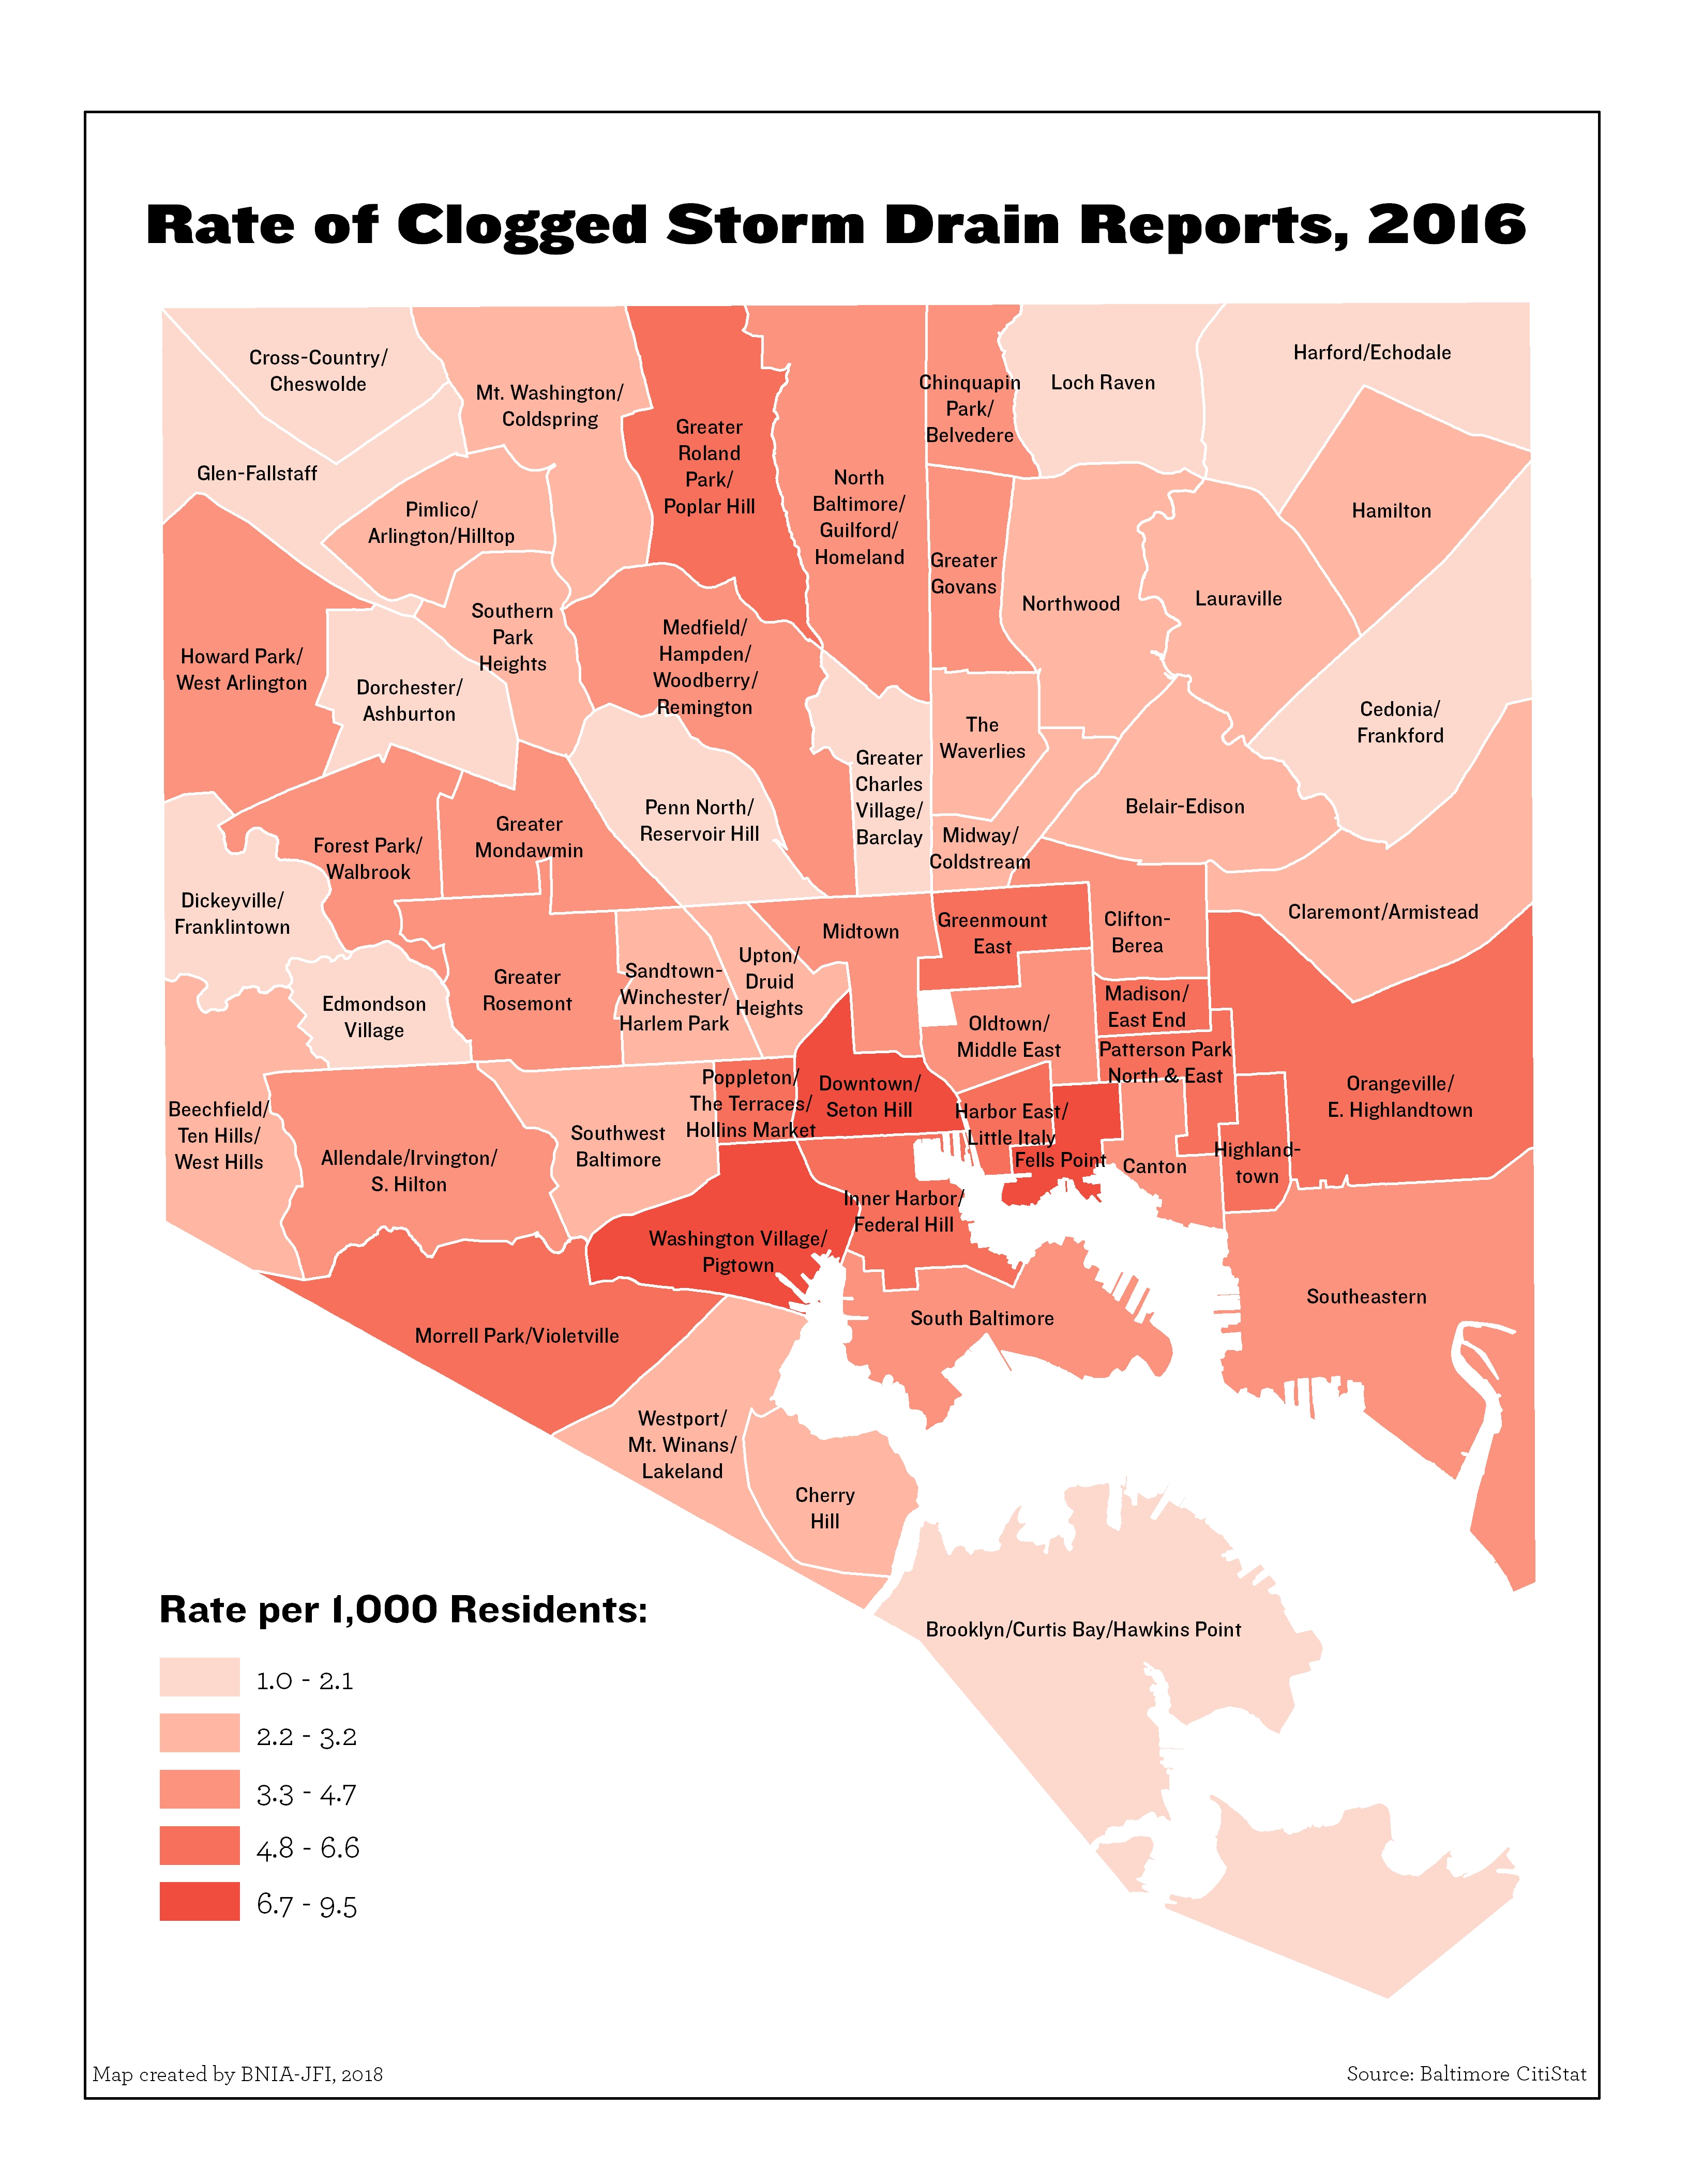
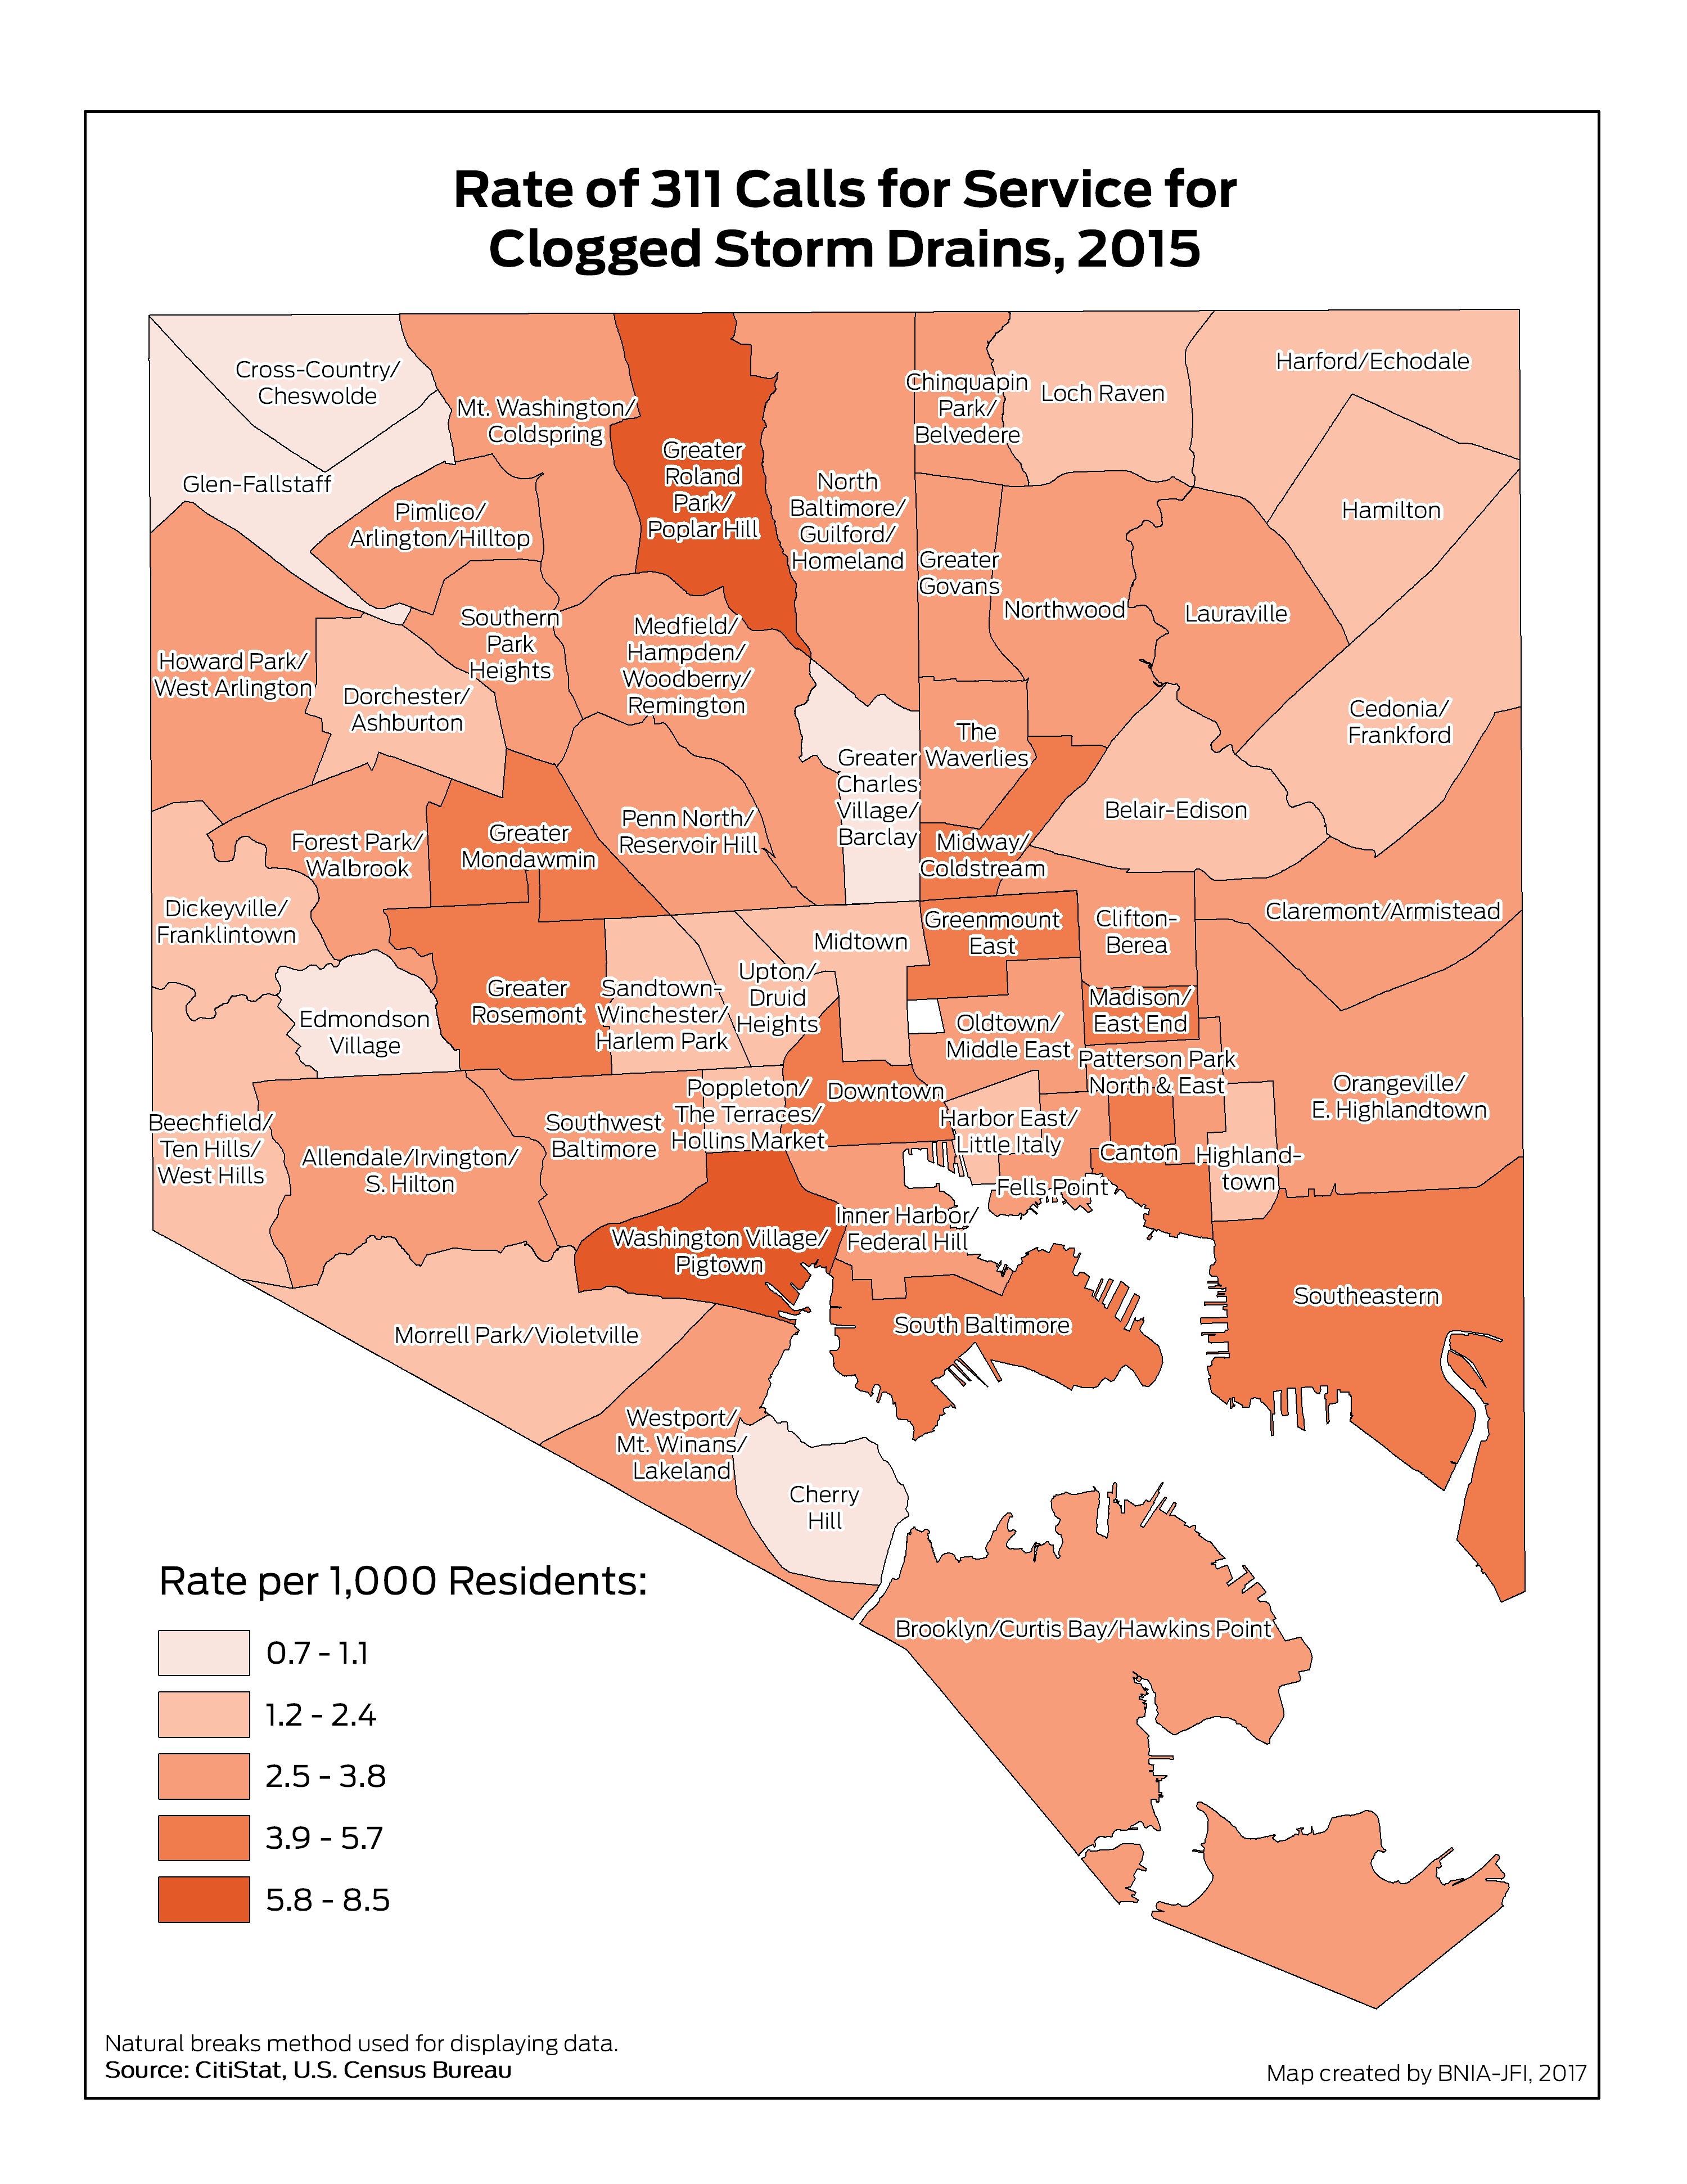
Rate of Clogged Storm Drain Reports per 1,000 Residents (2020)
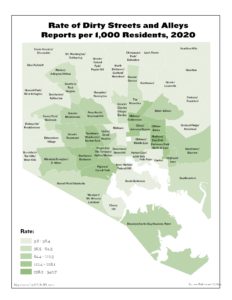
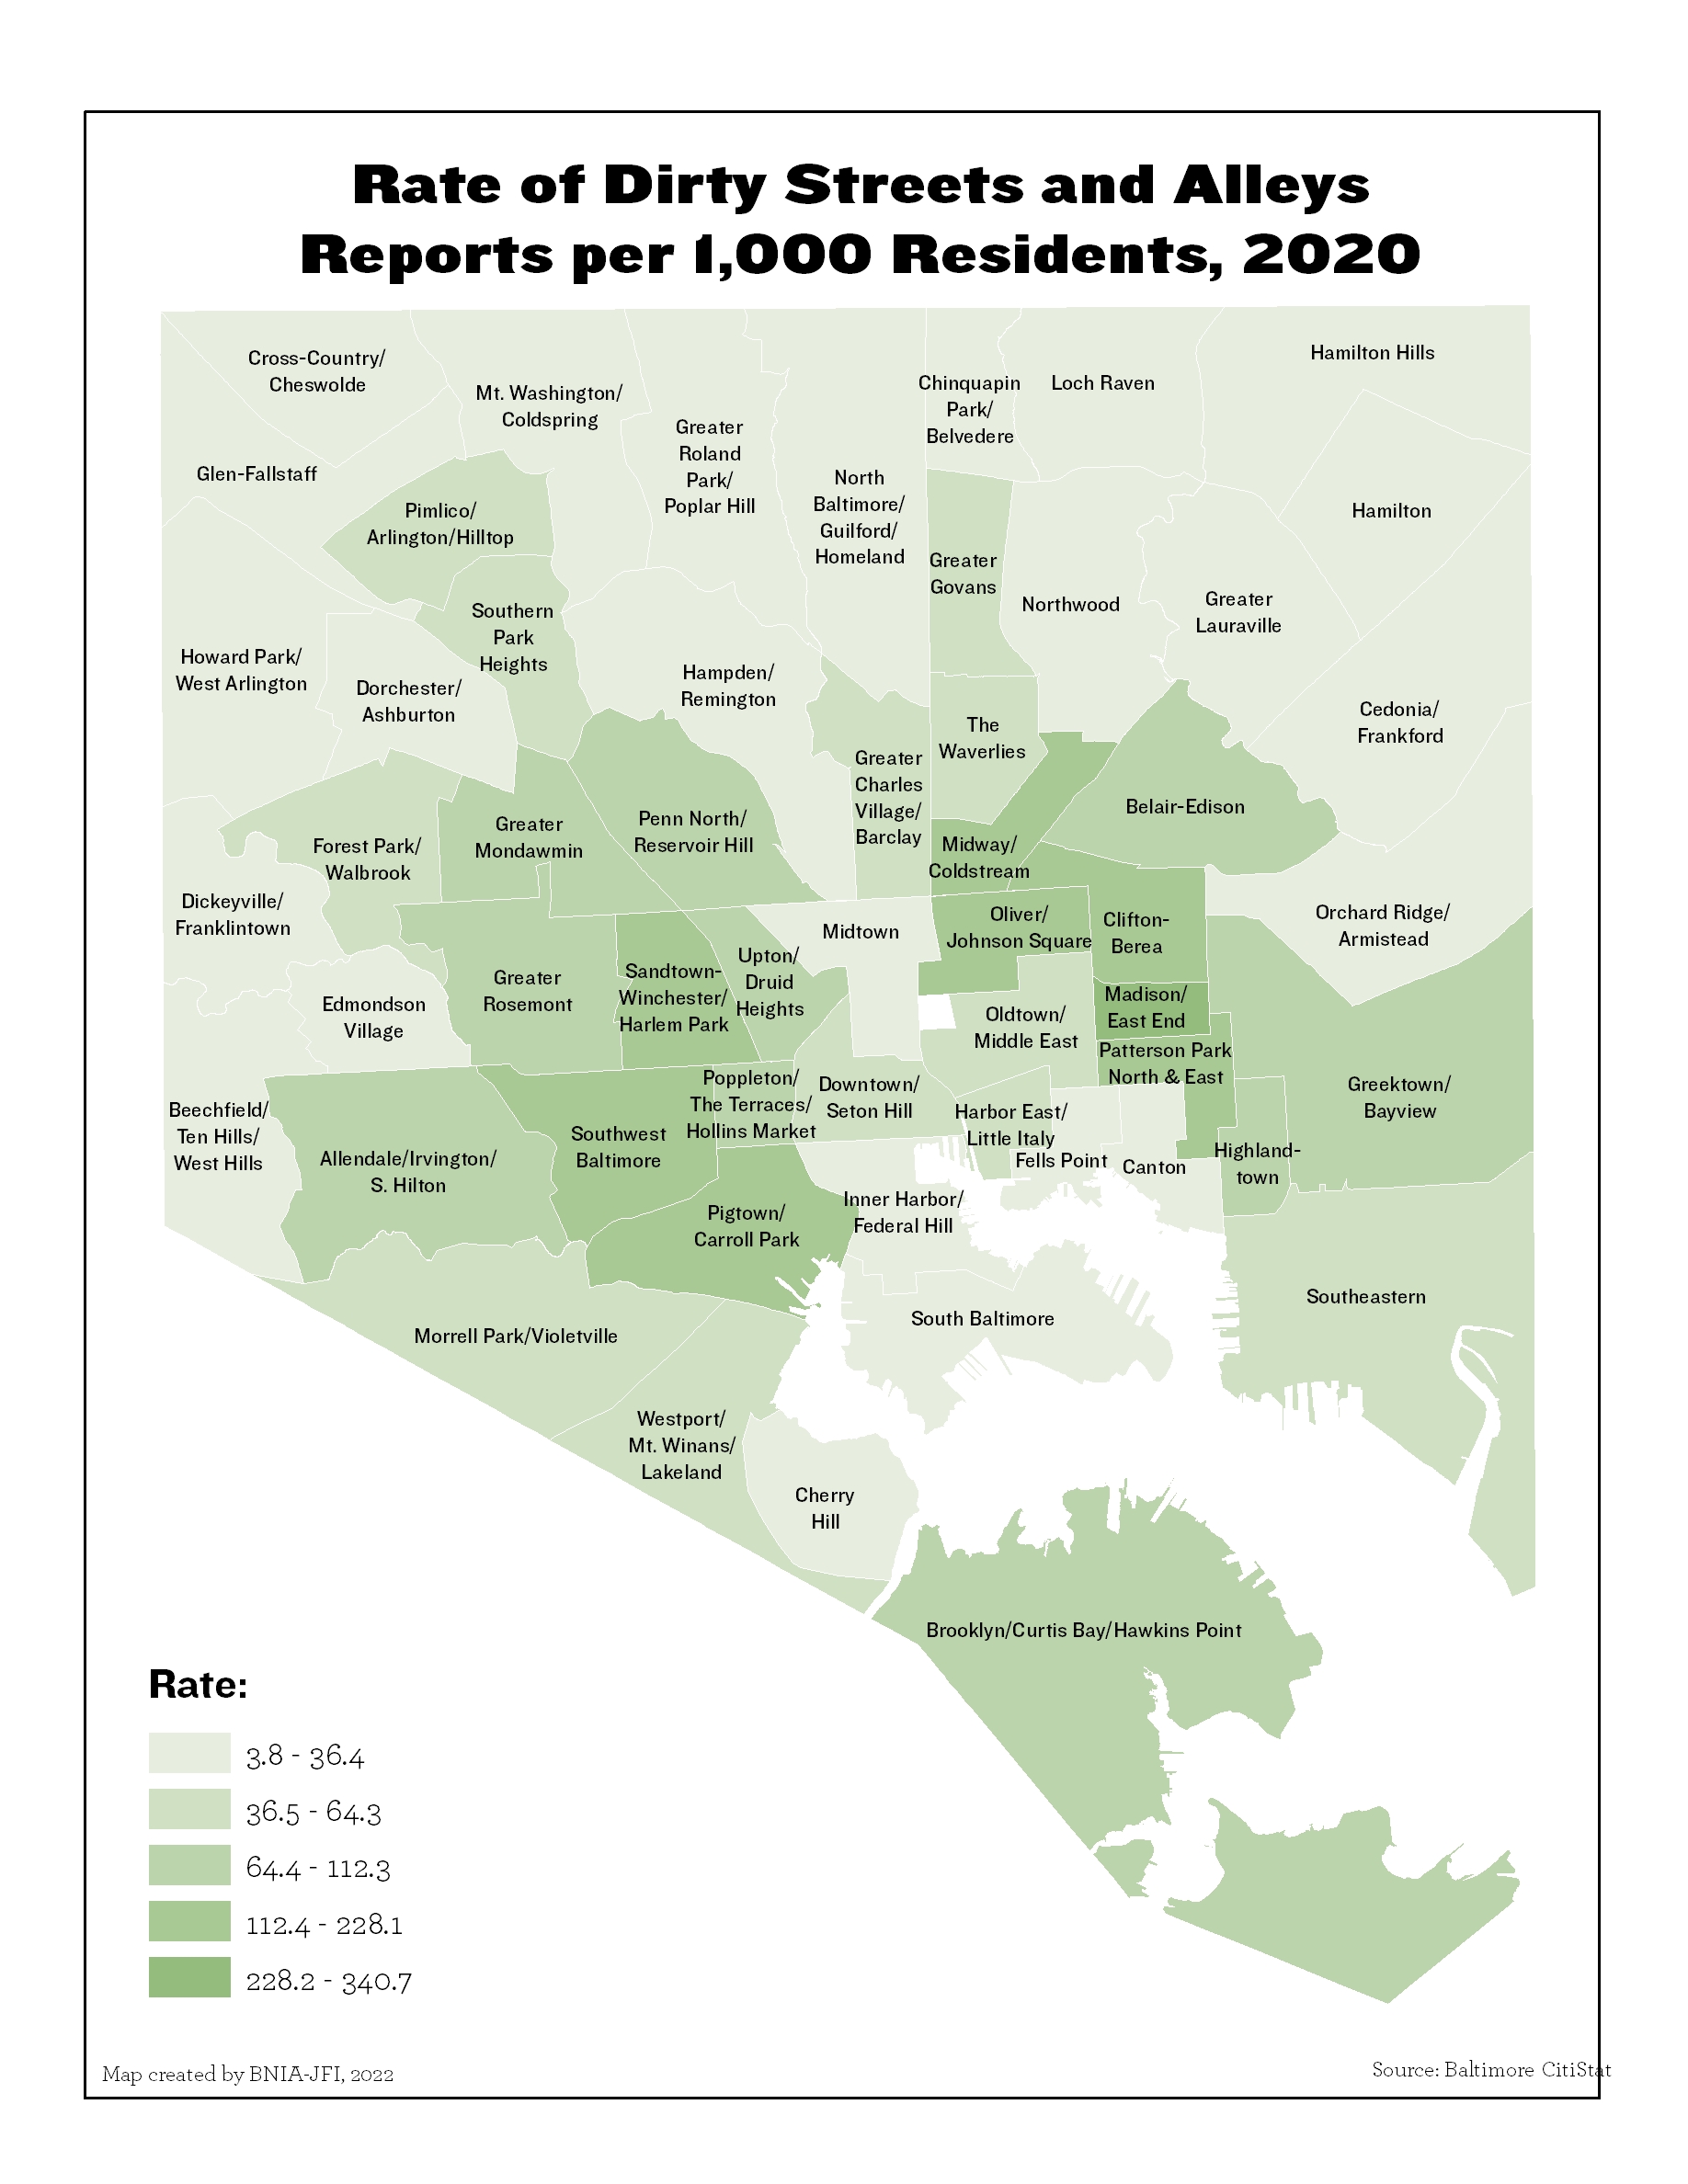
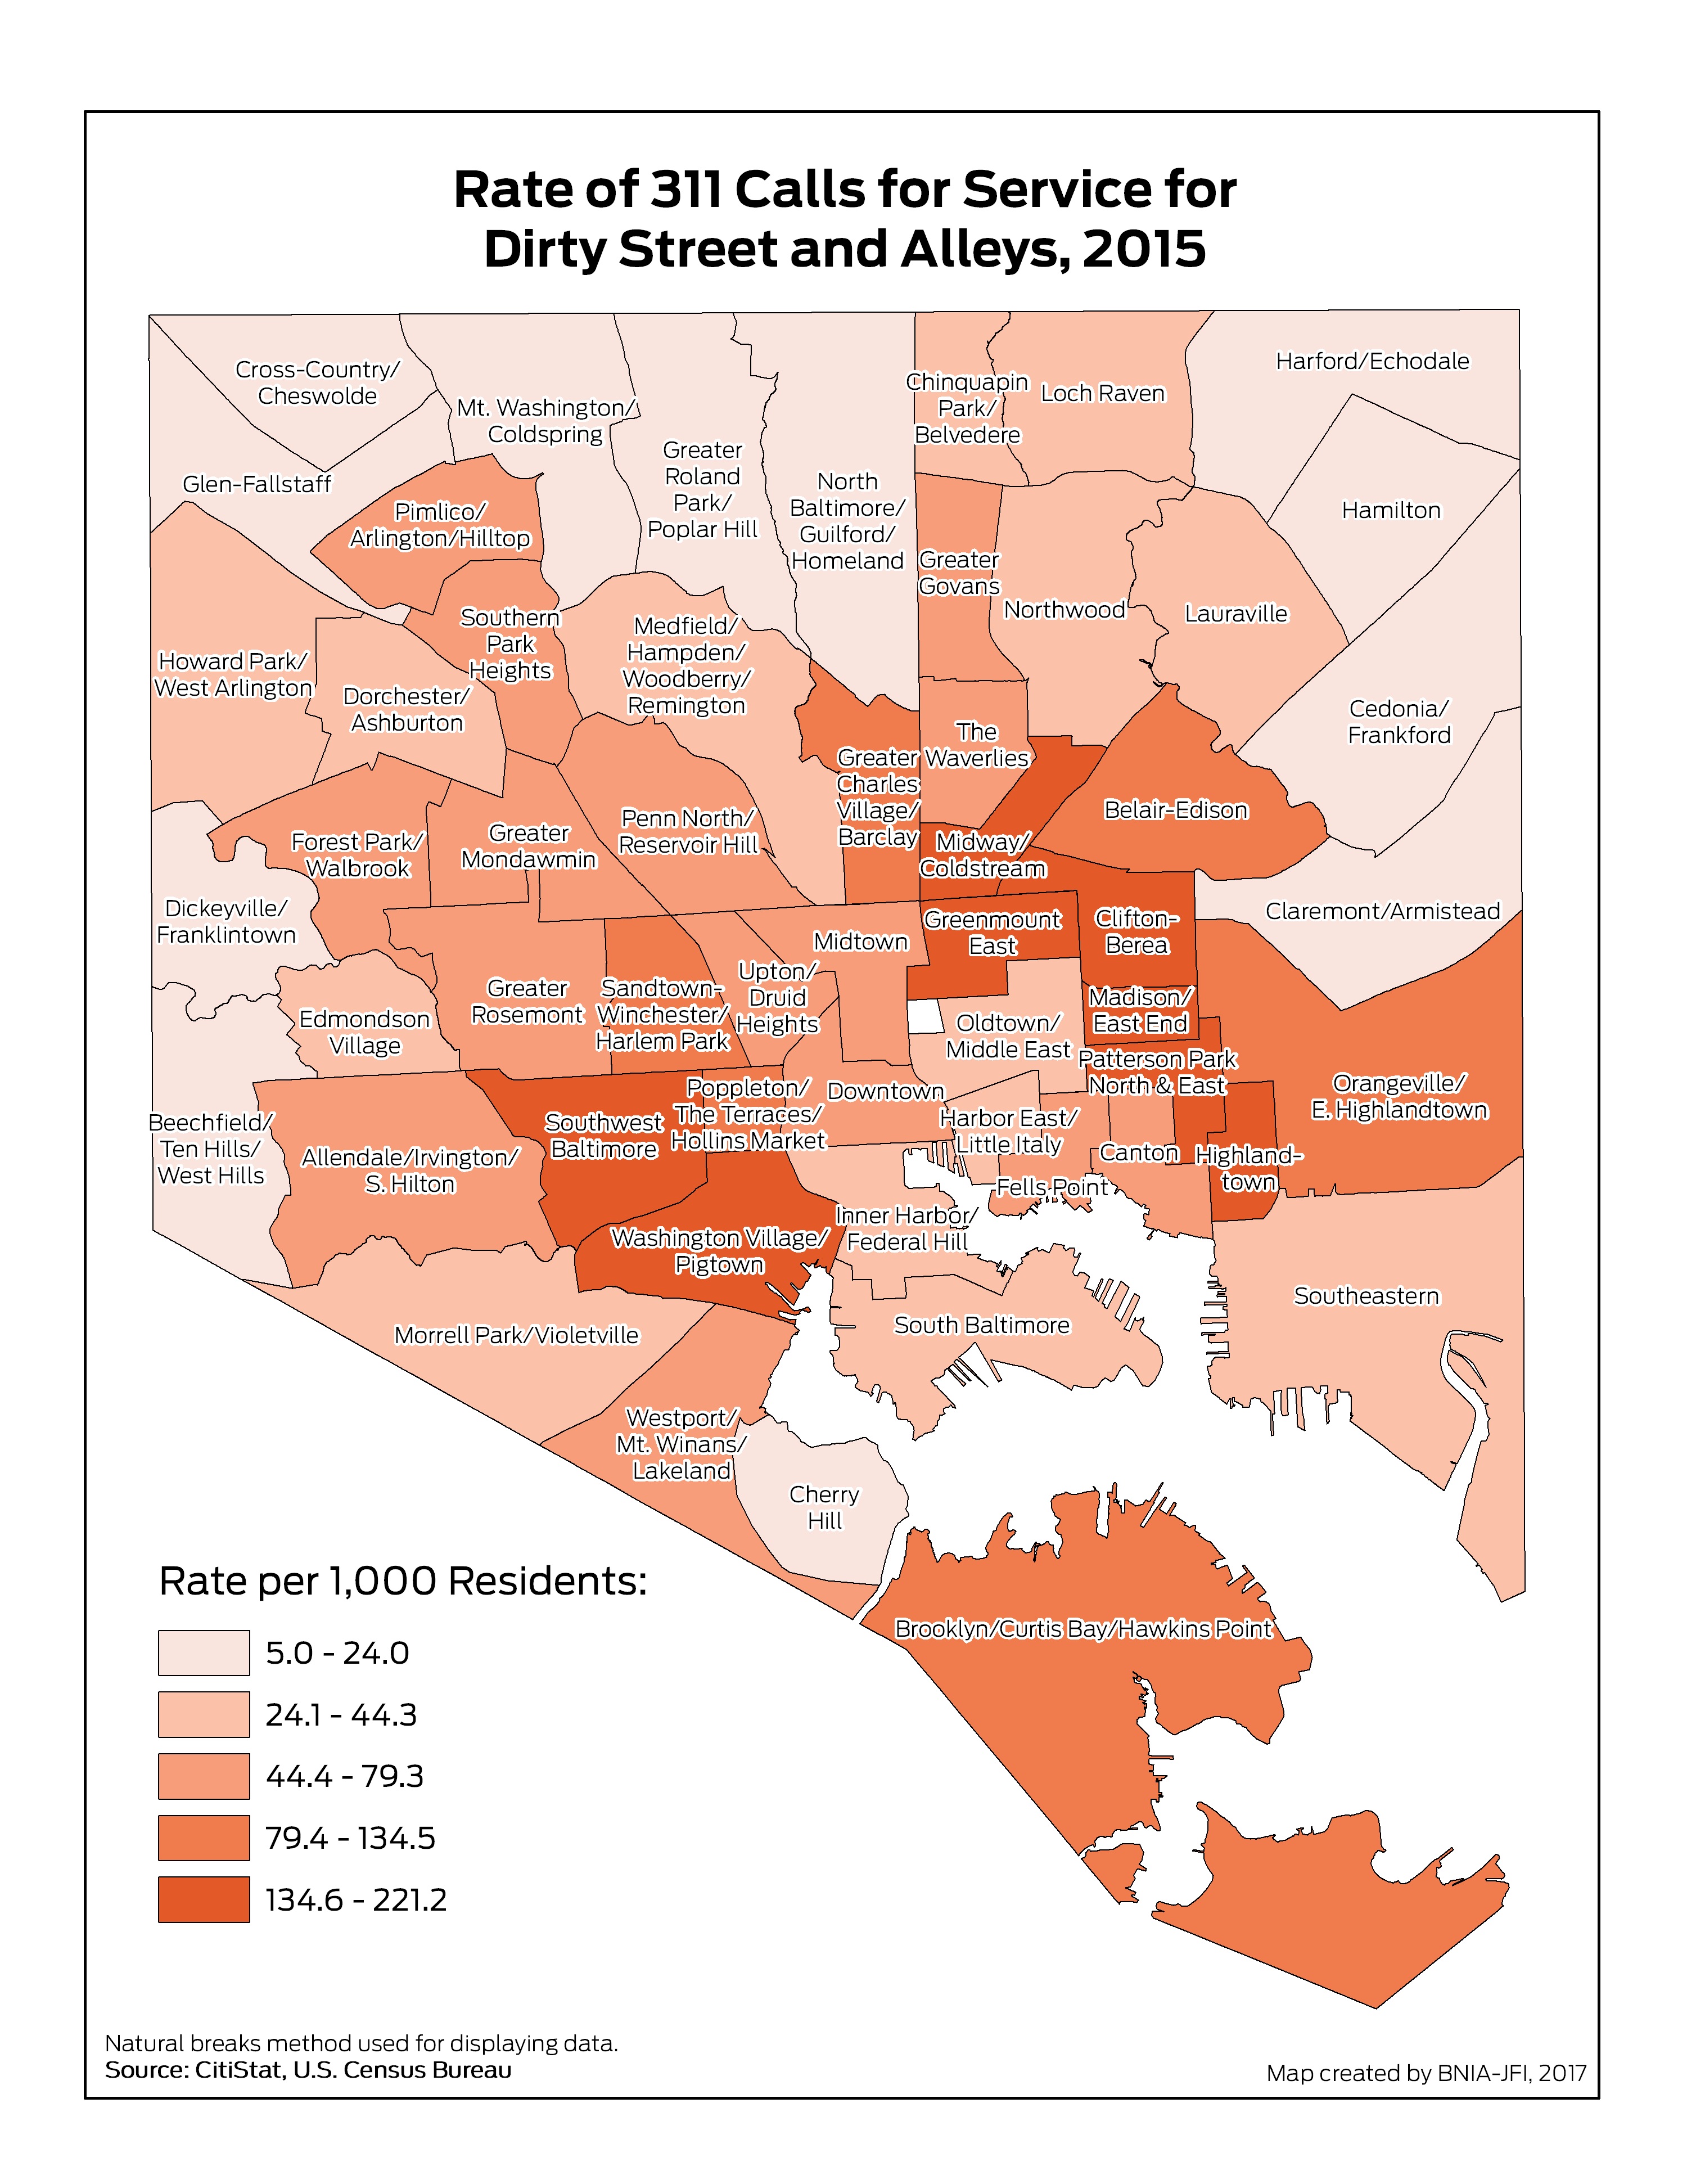
Rate of Dirty Streets and Alleys Reports per 1,000 Residents (2020)
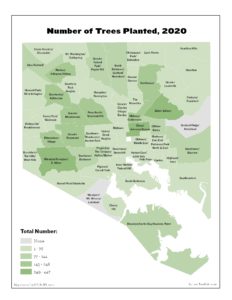
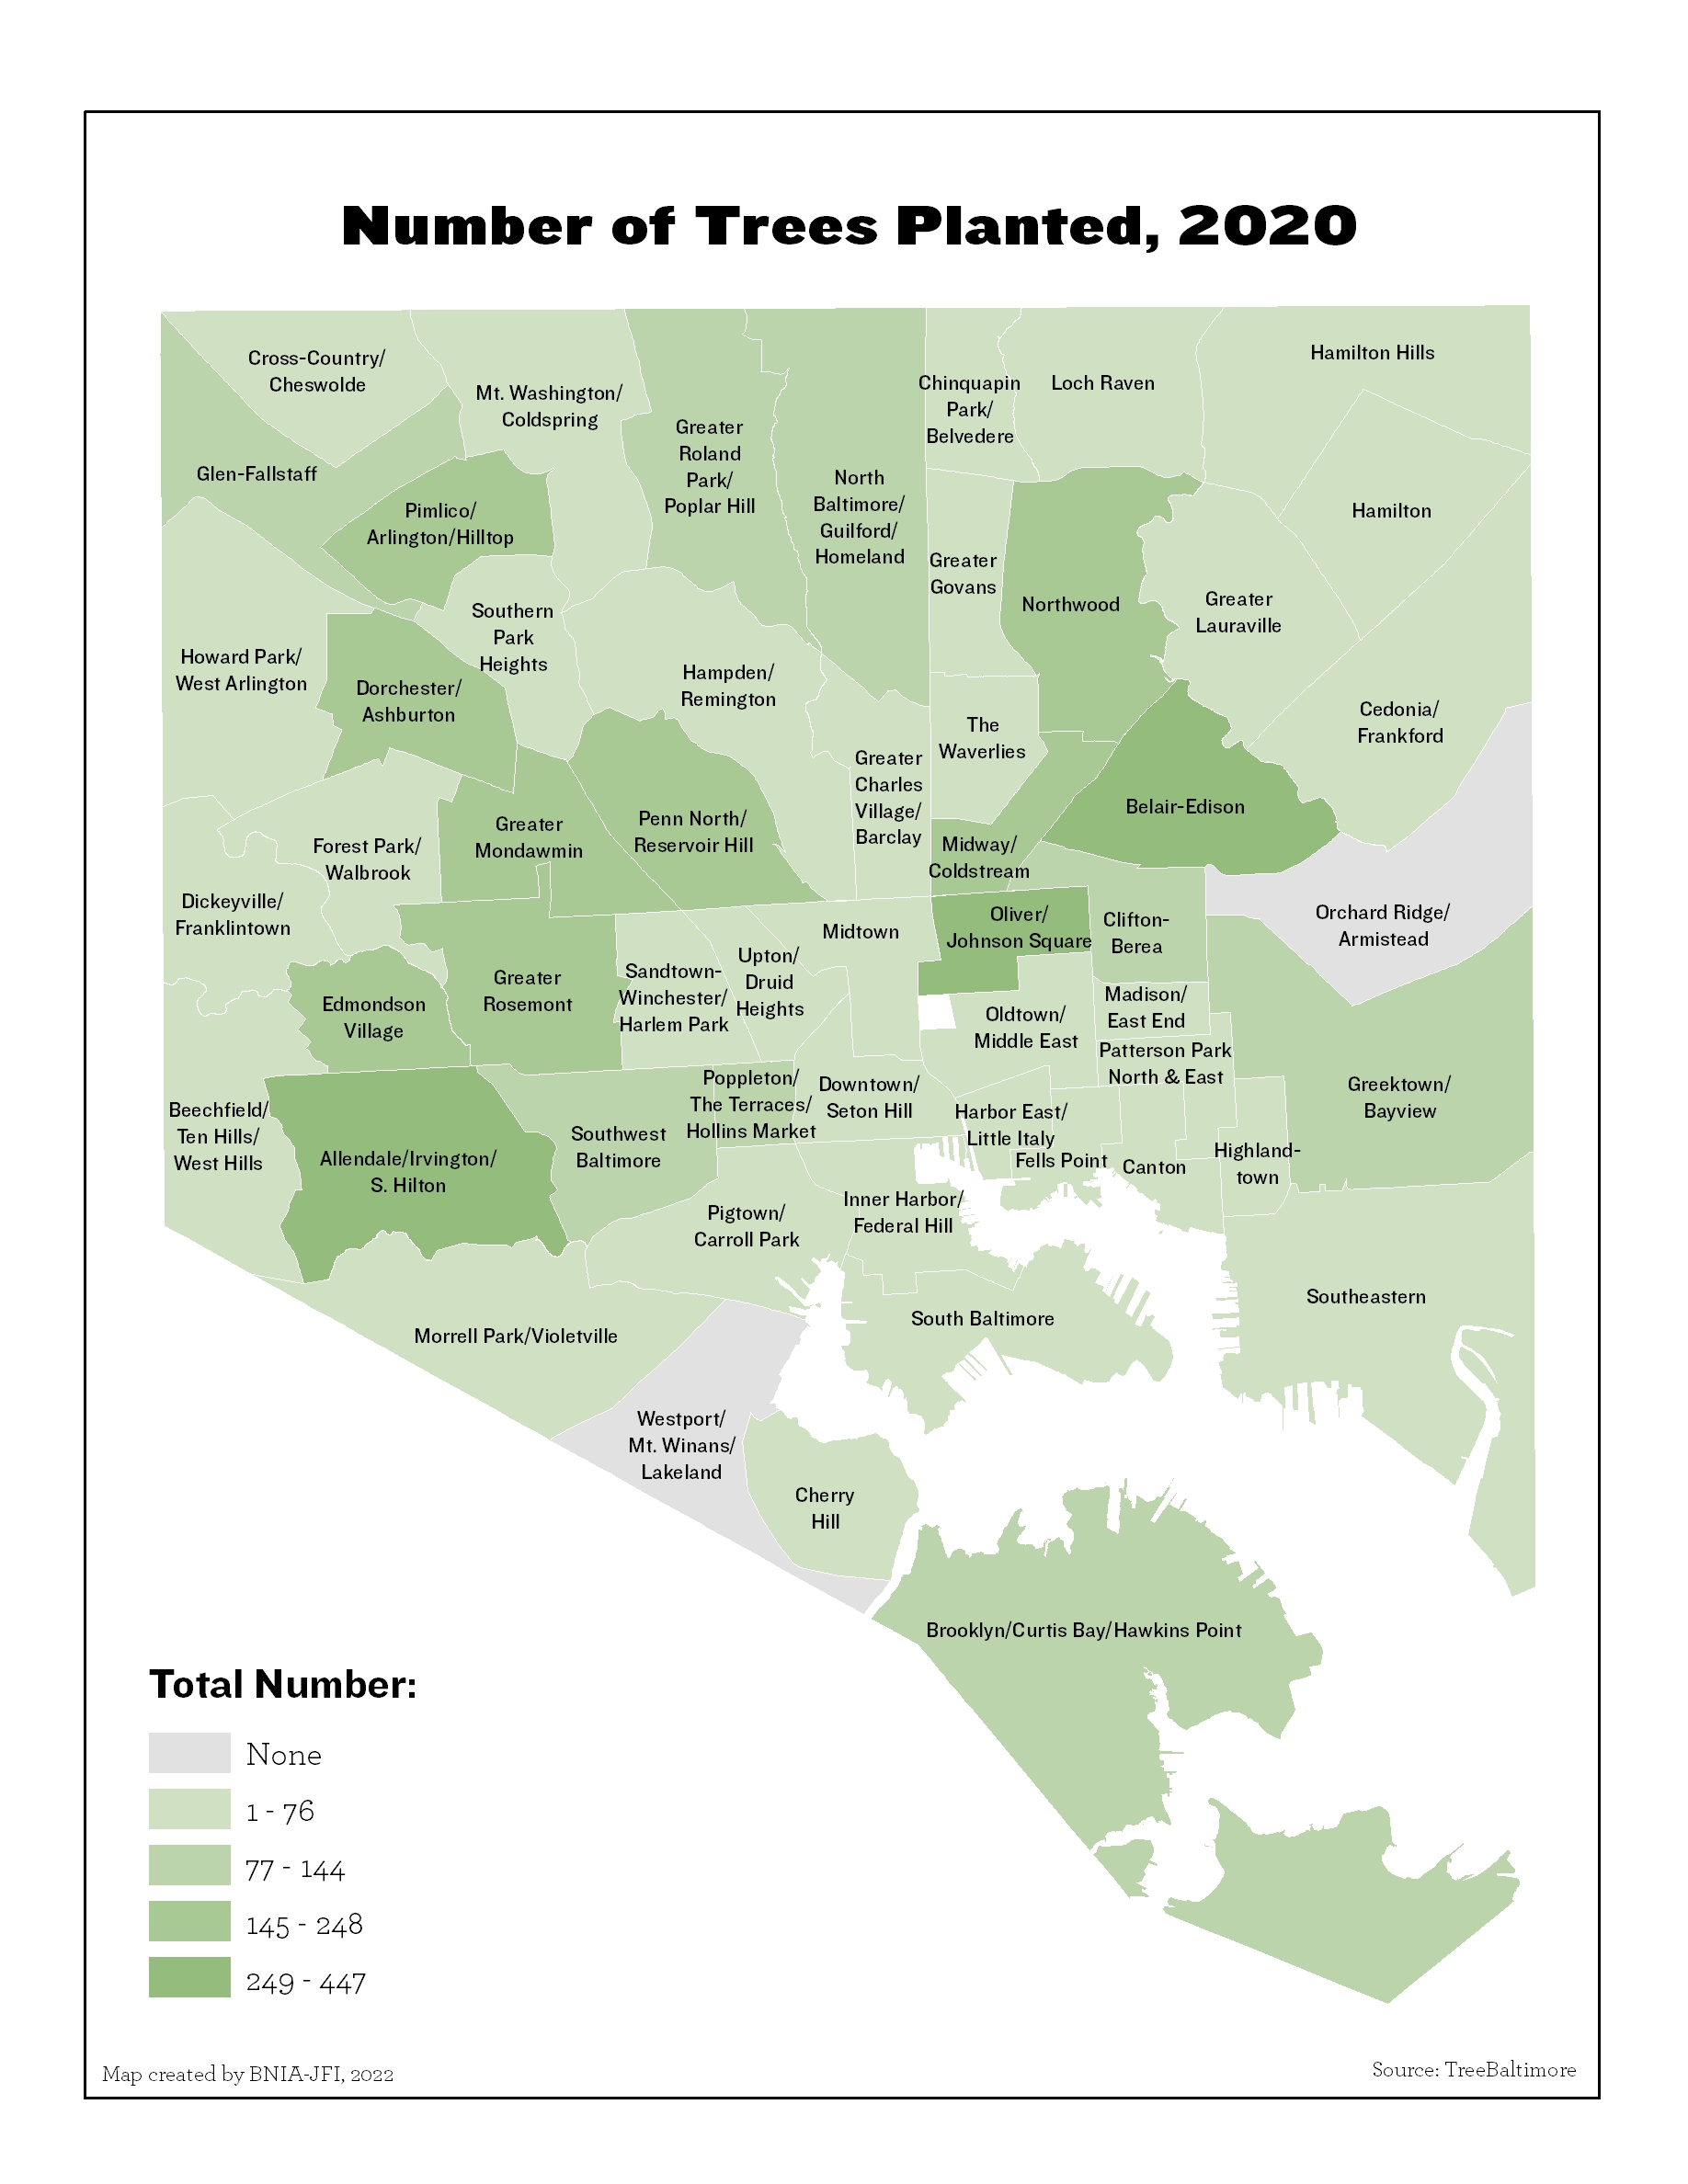
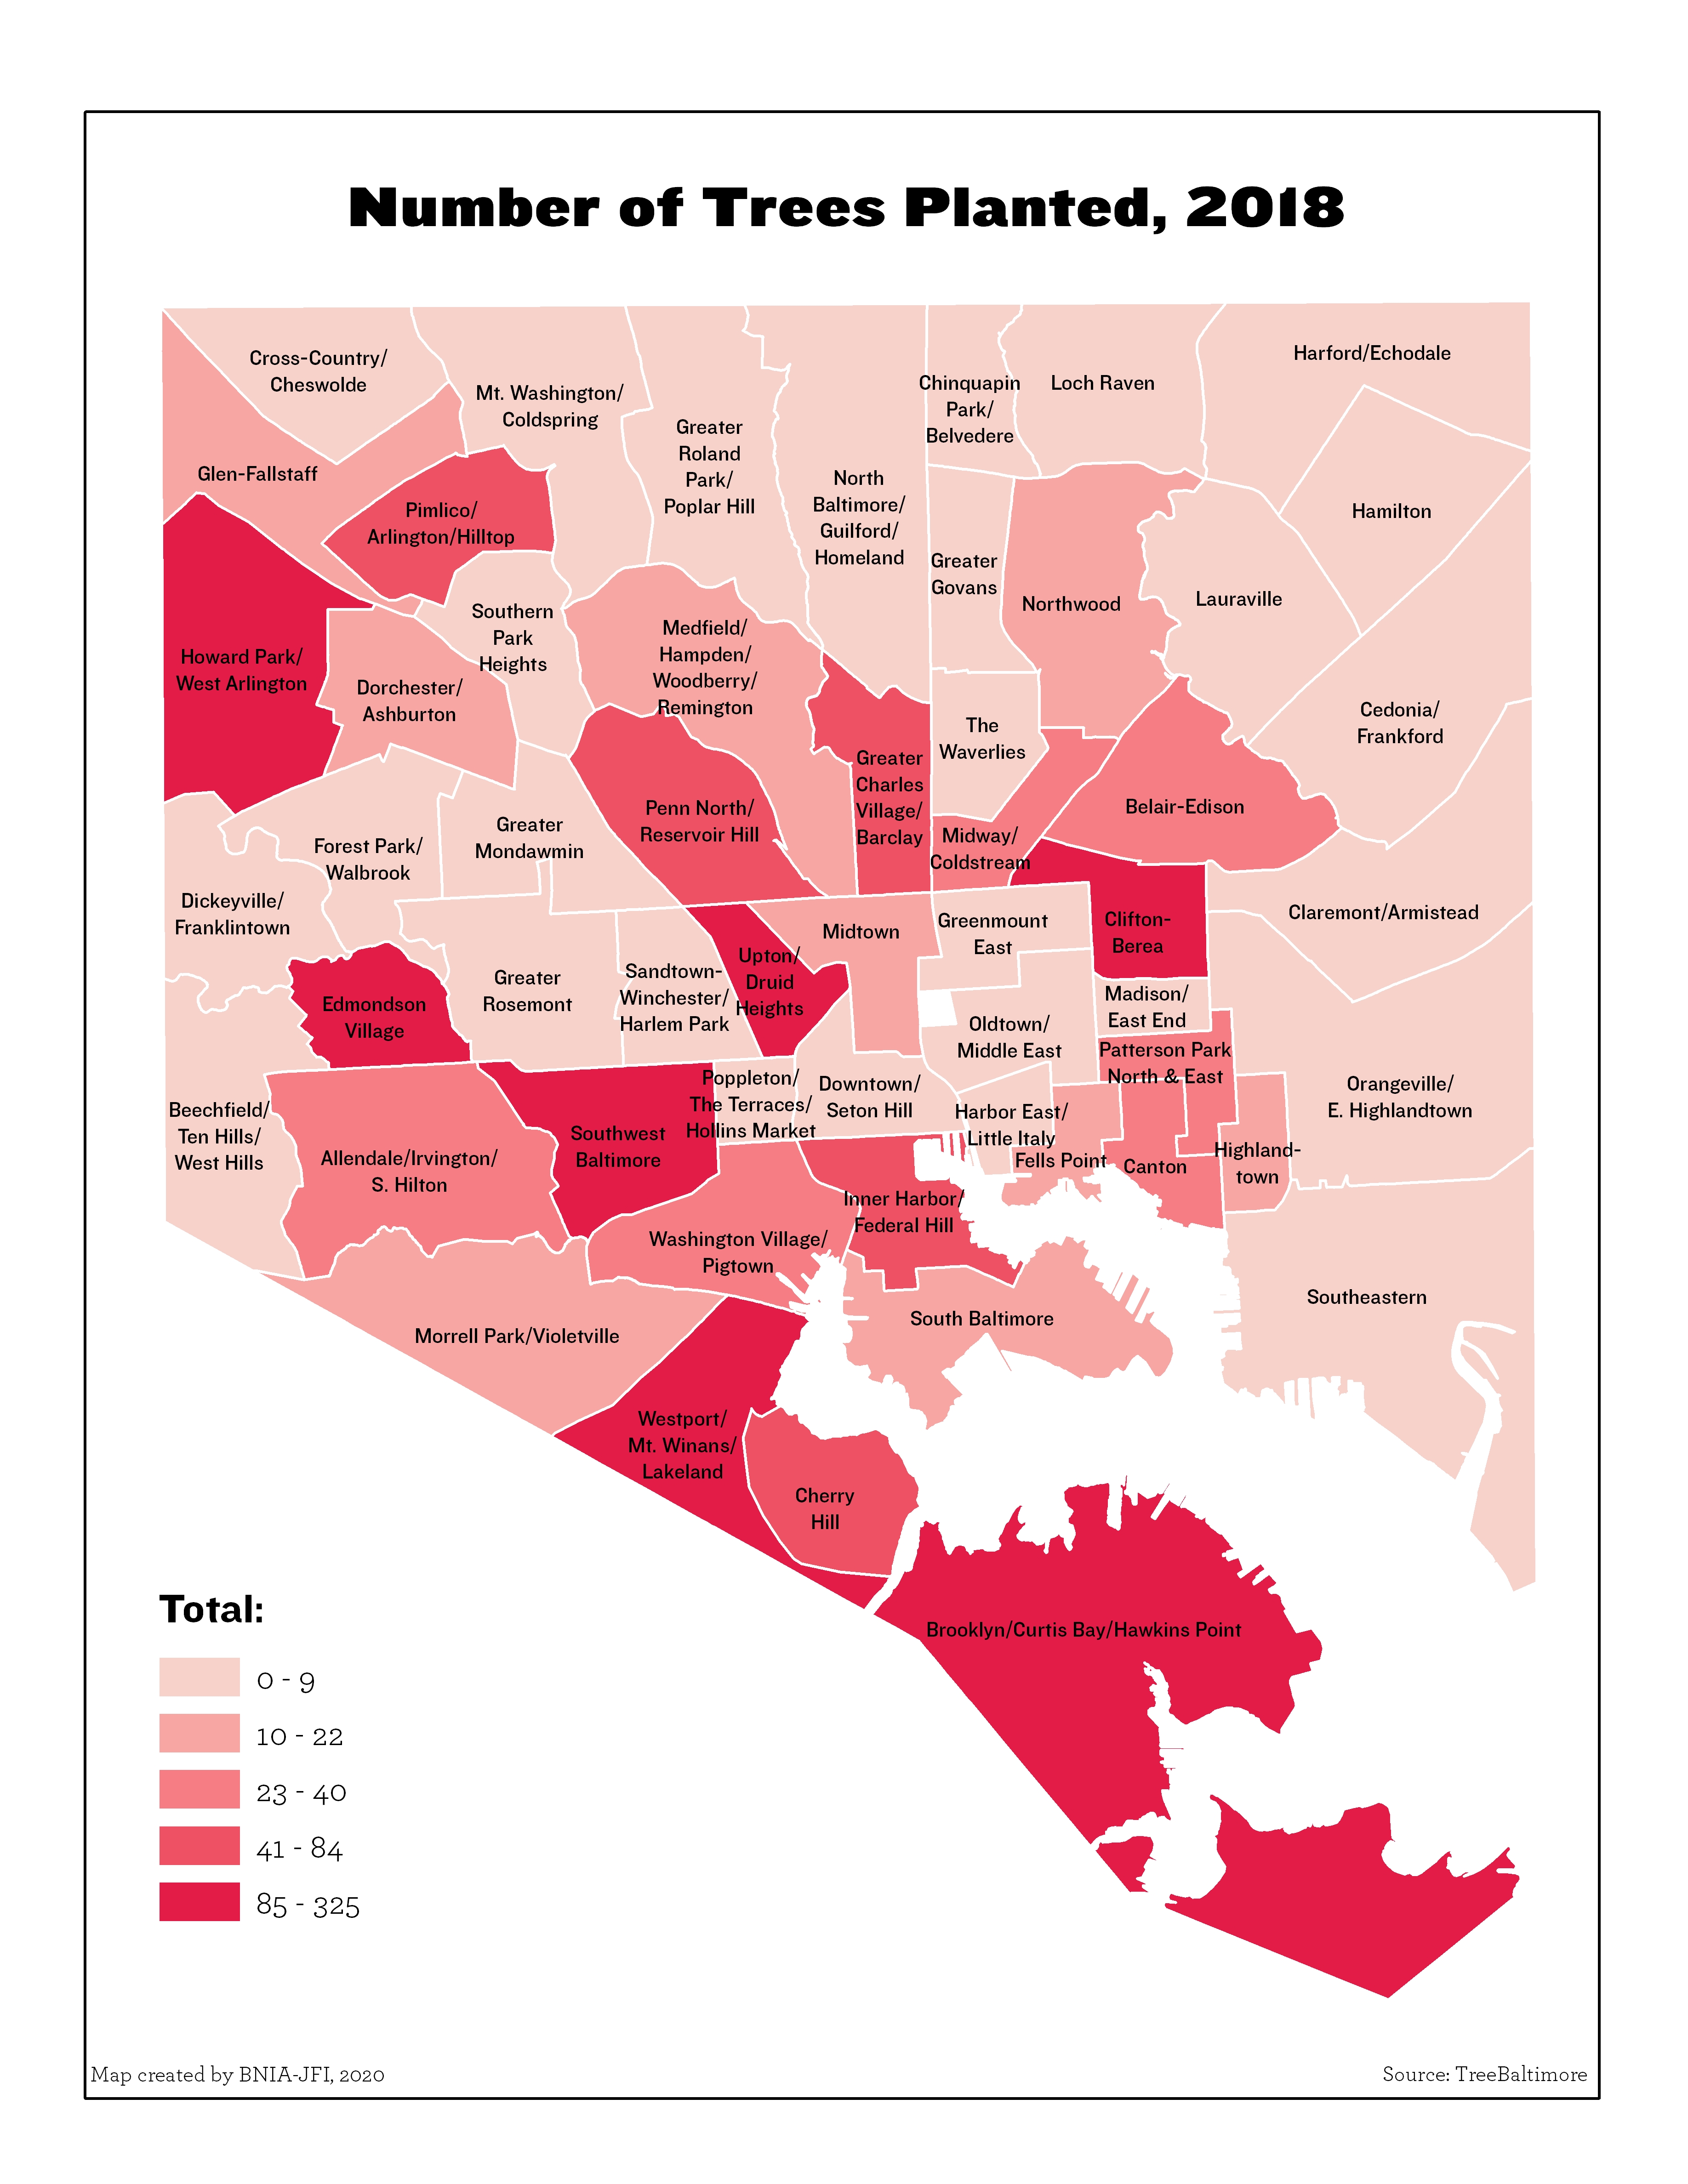
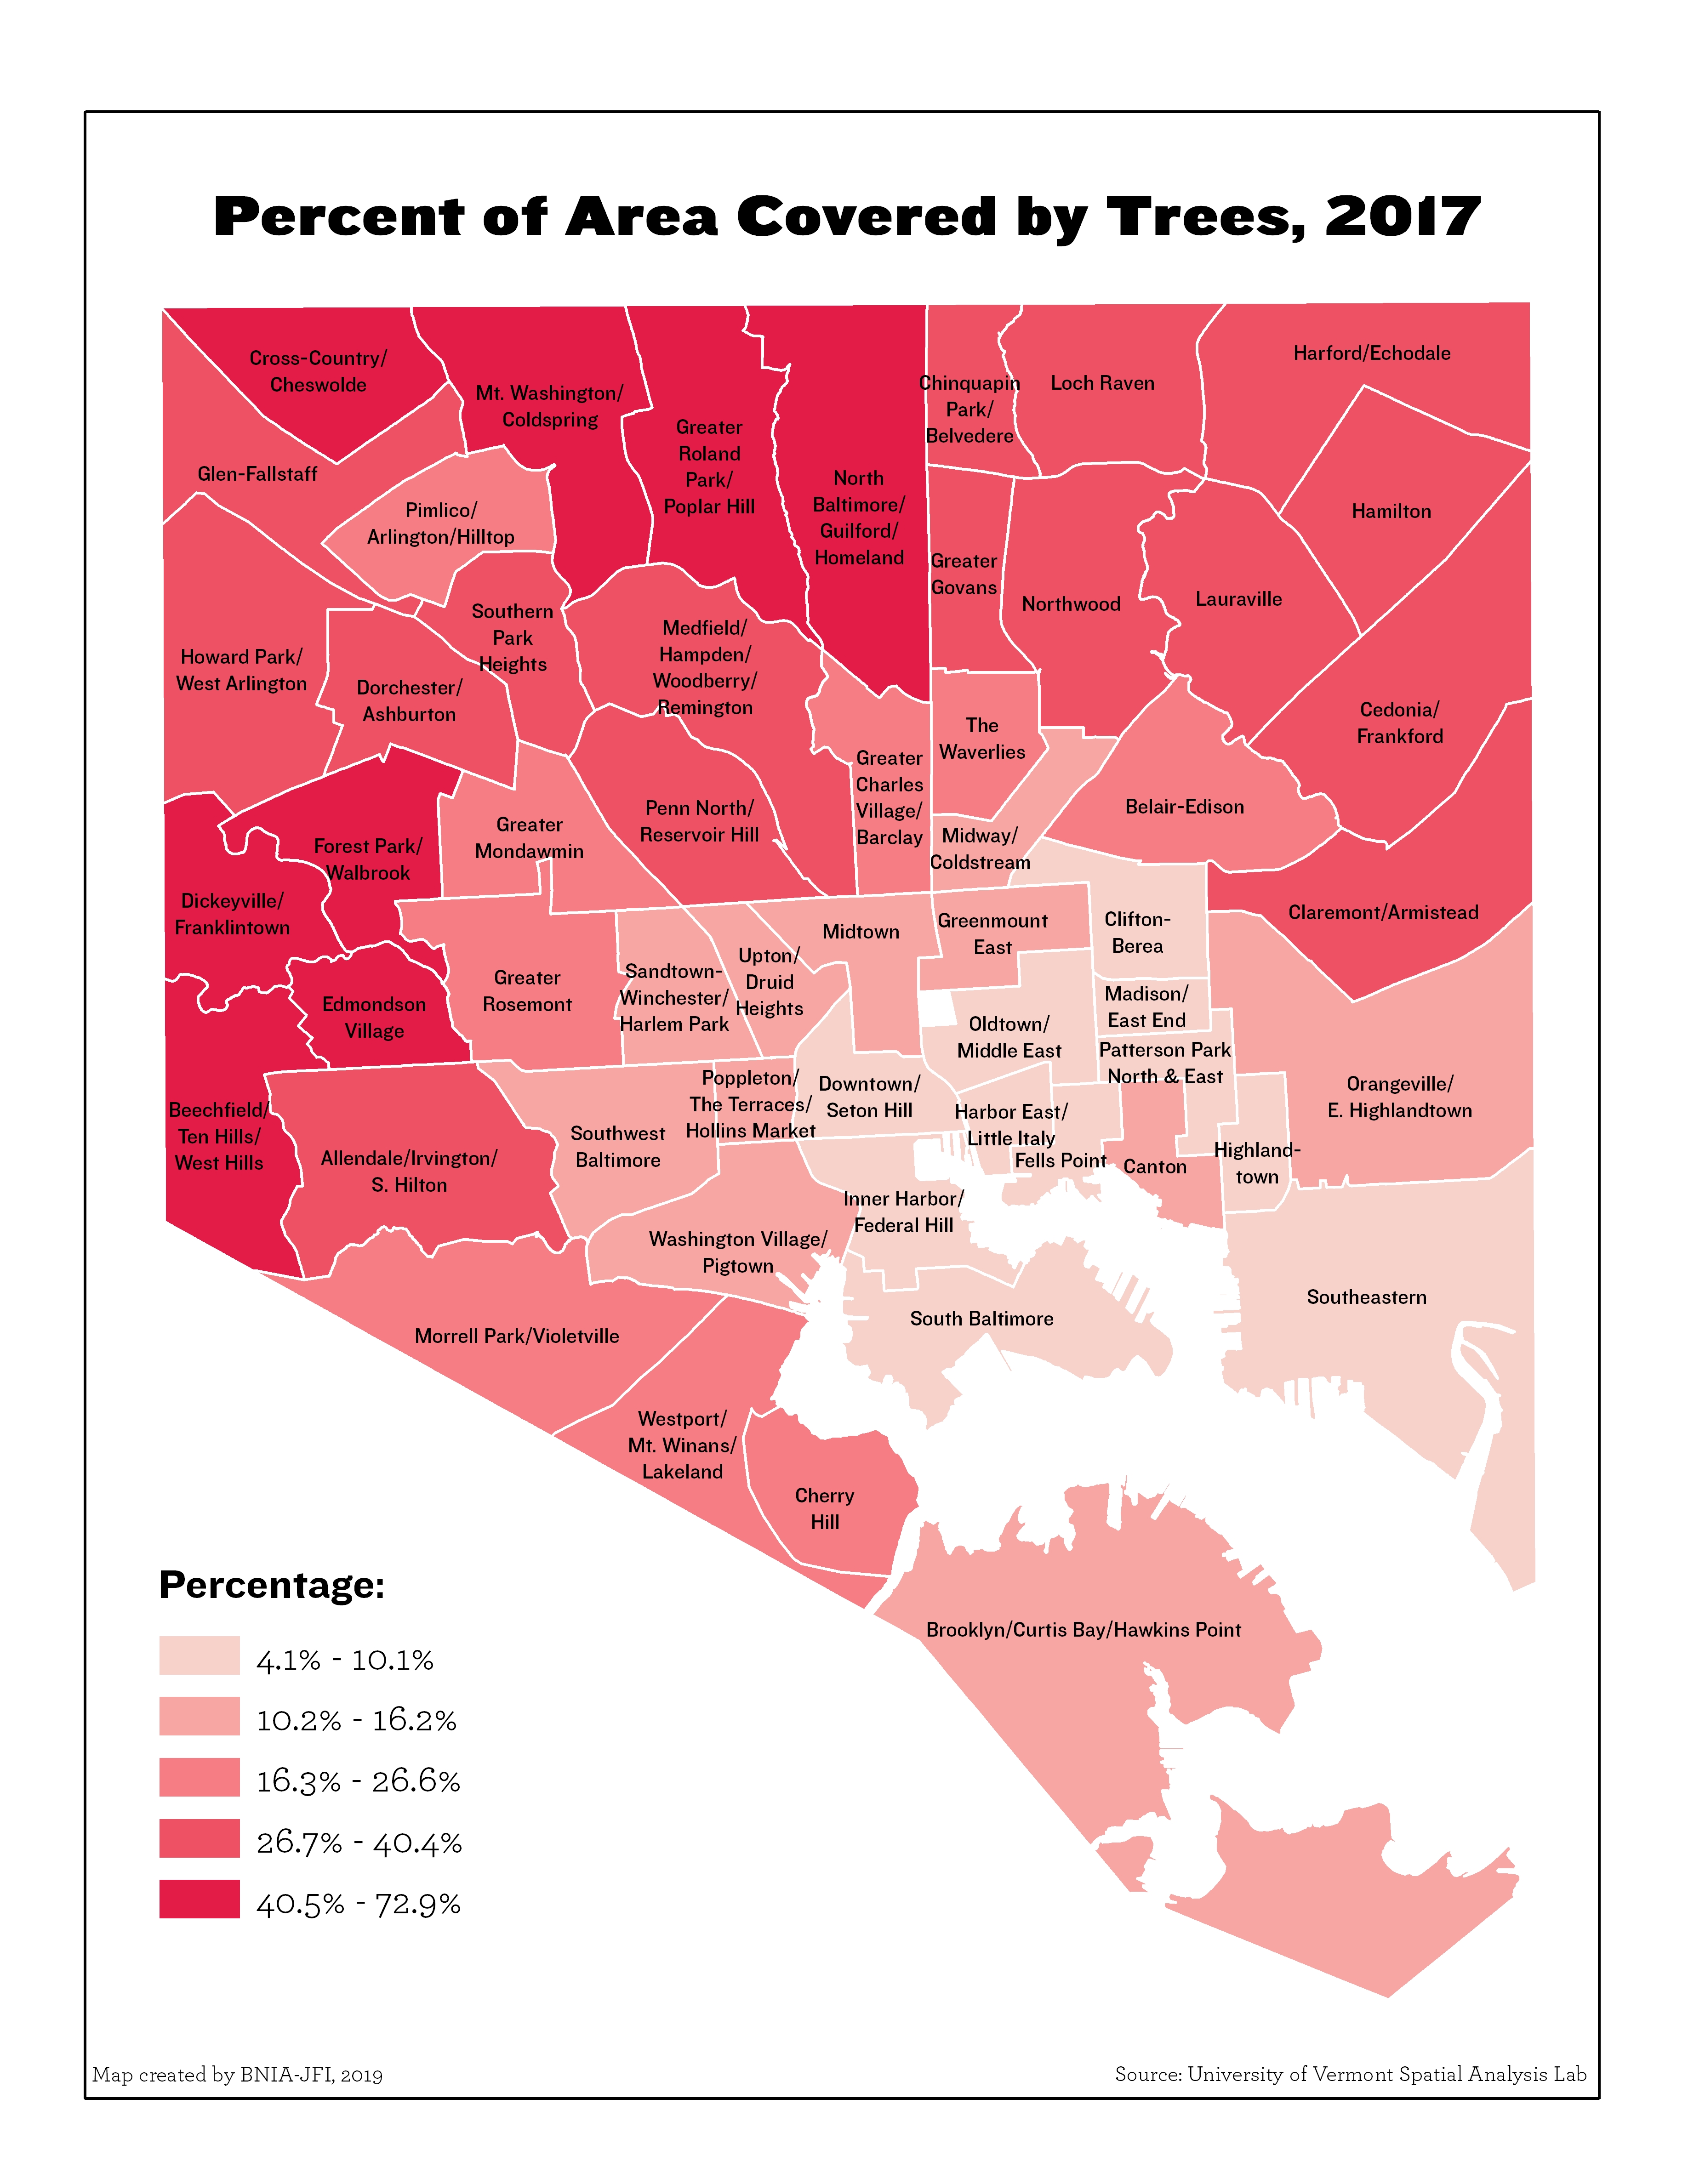
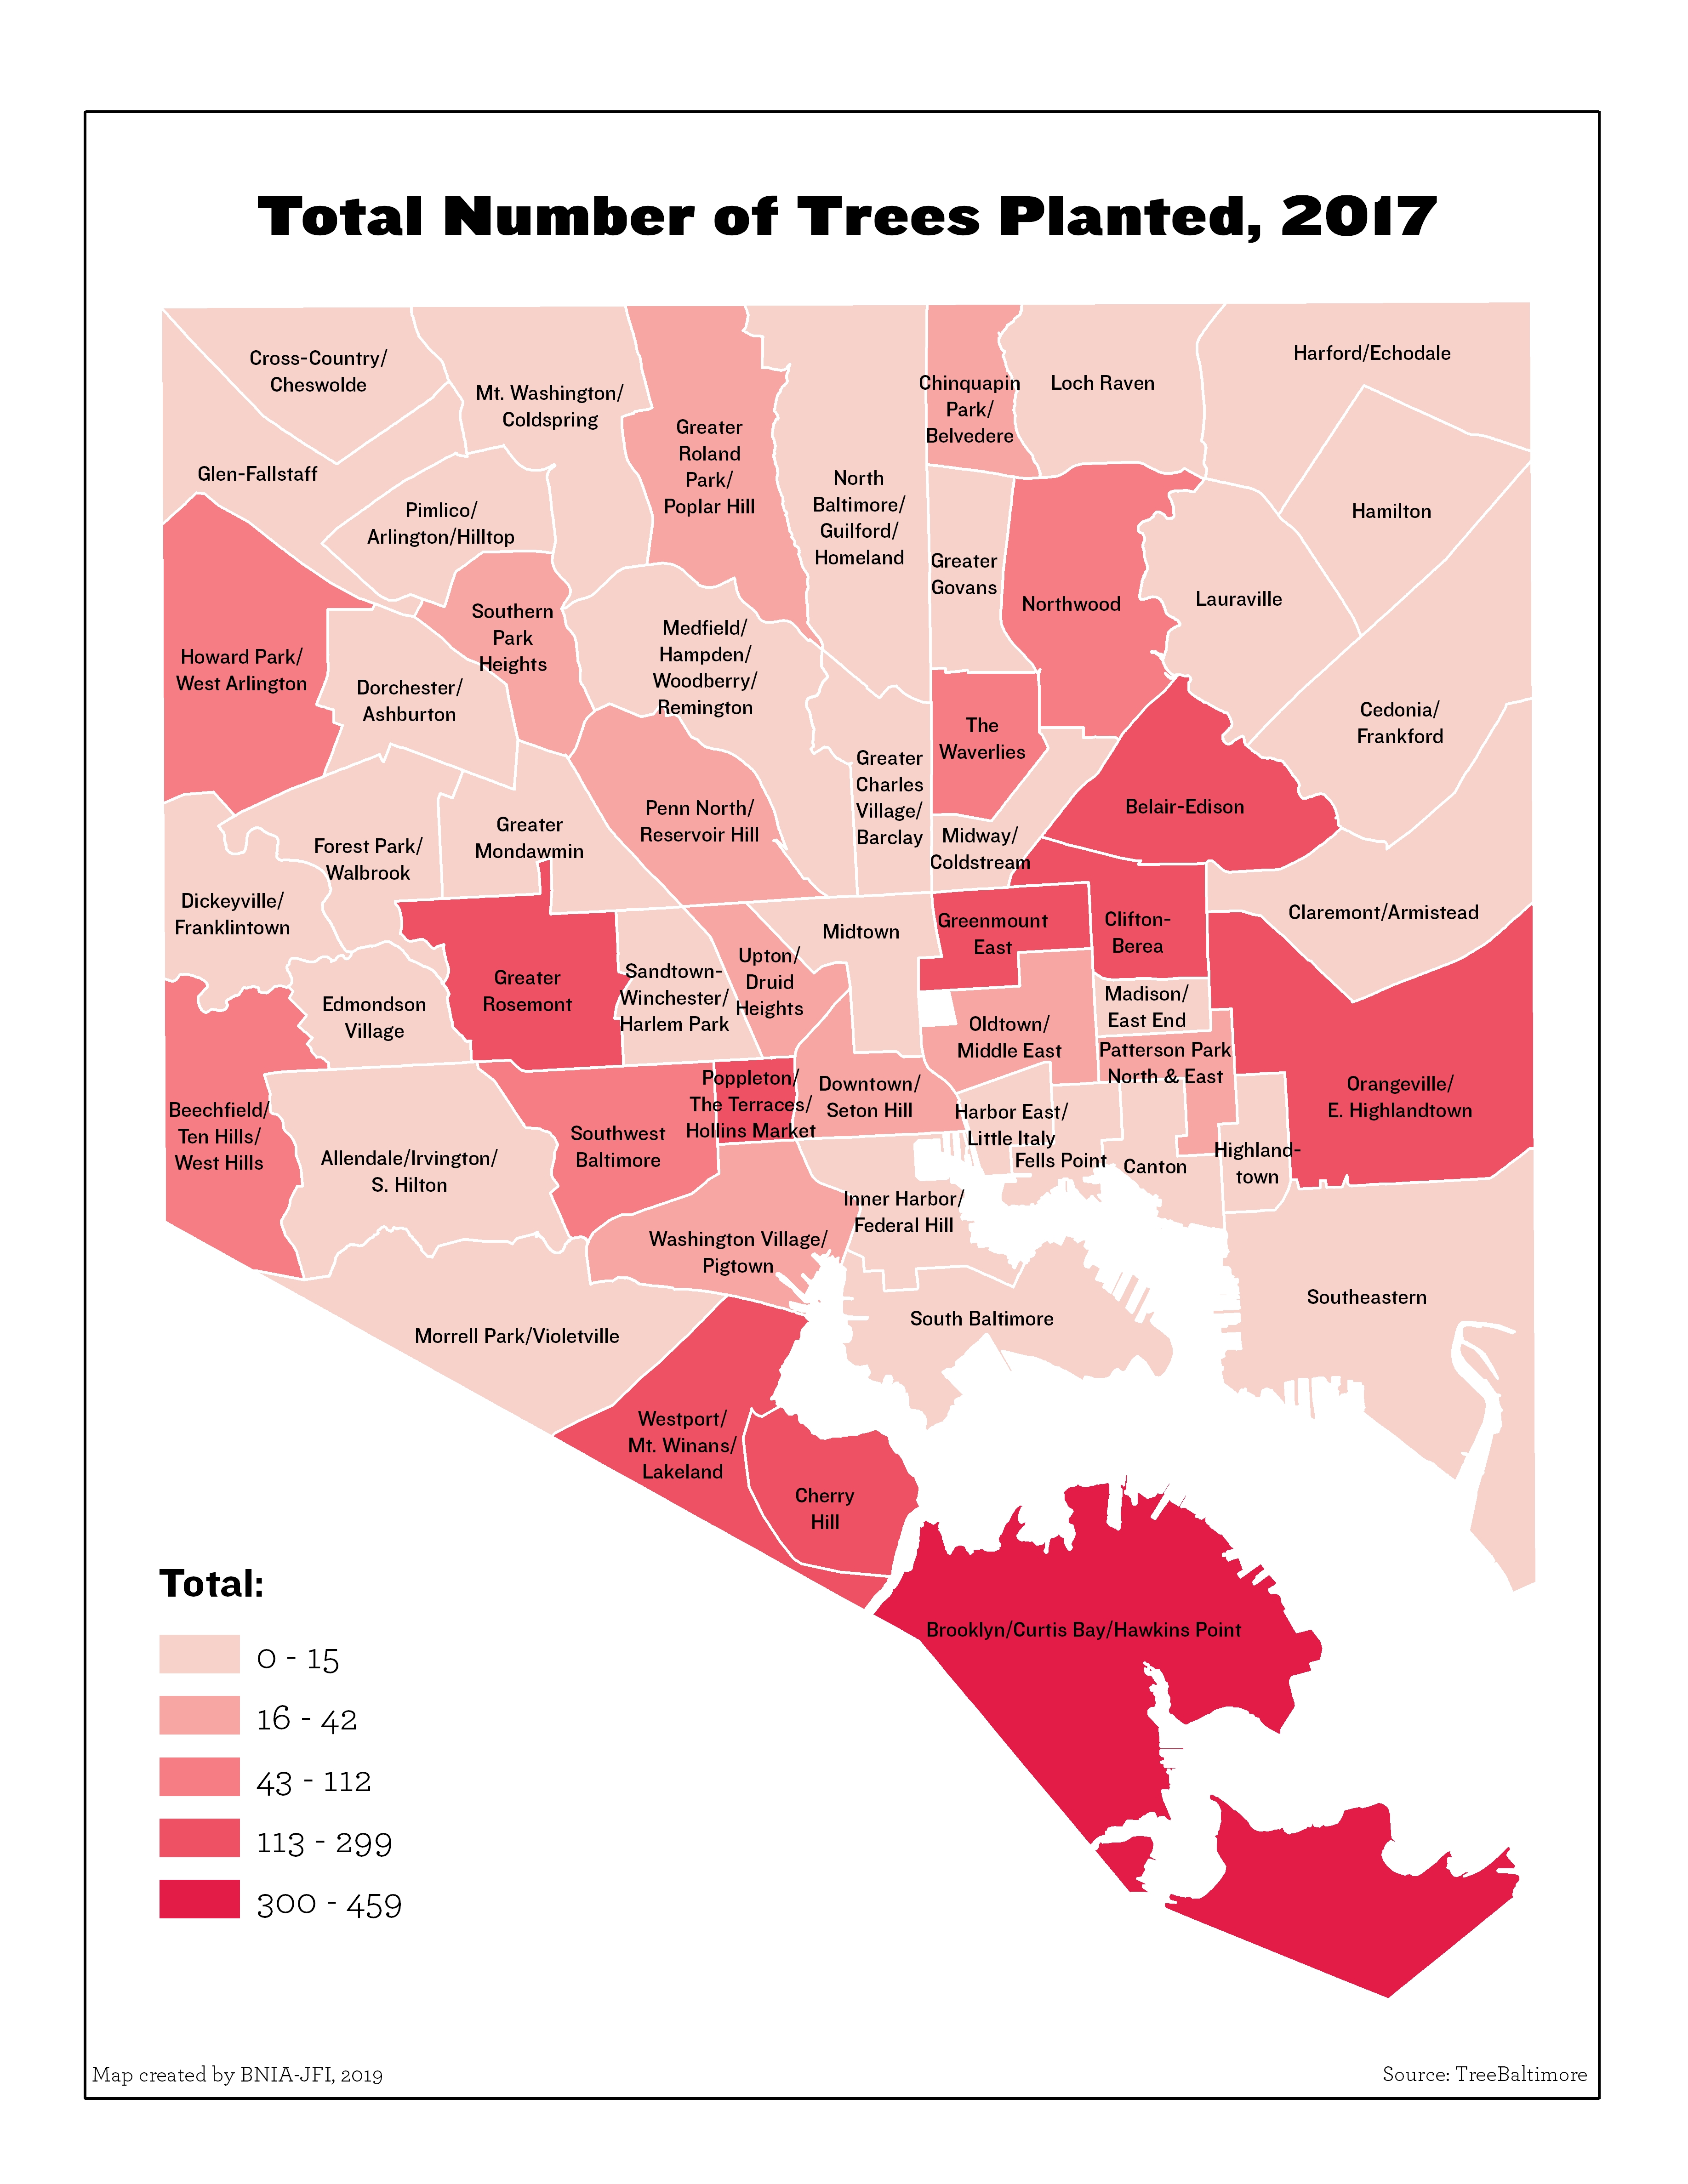
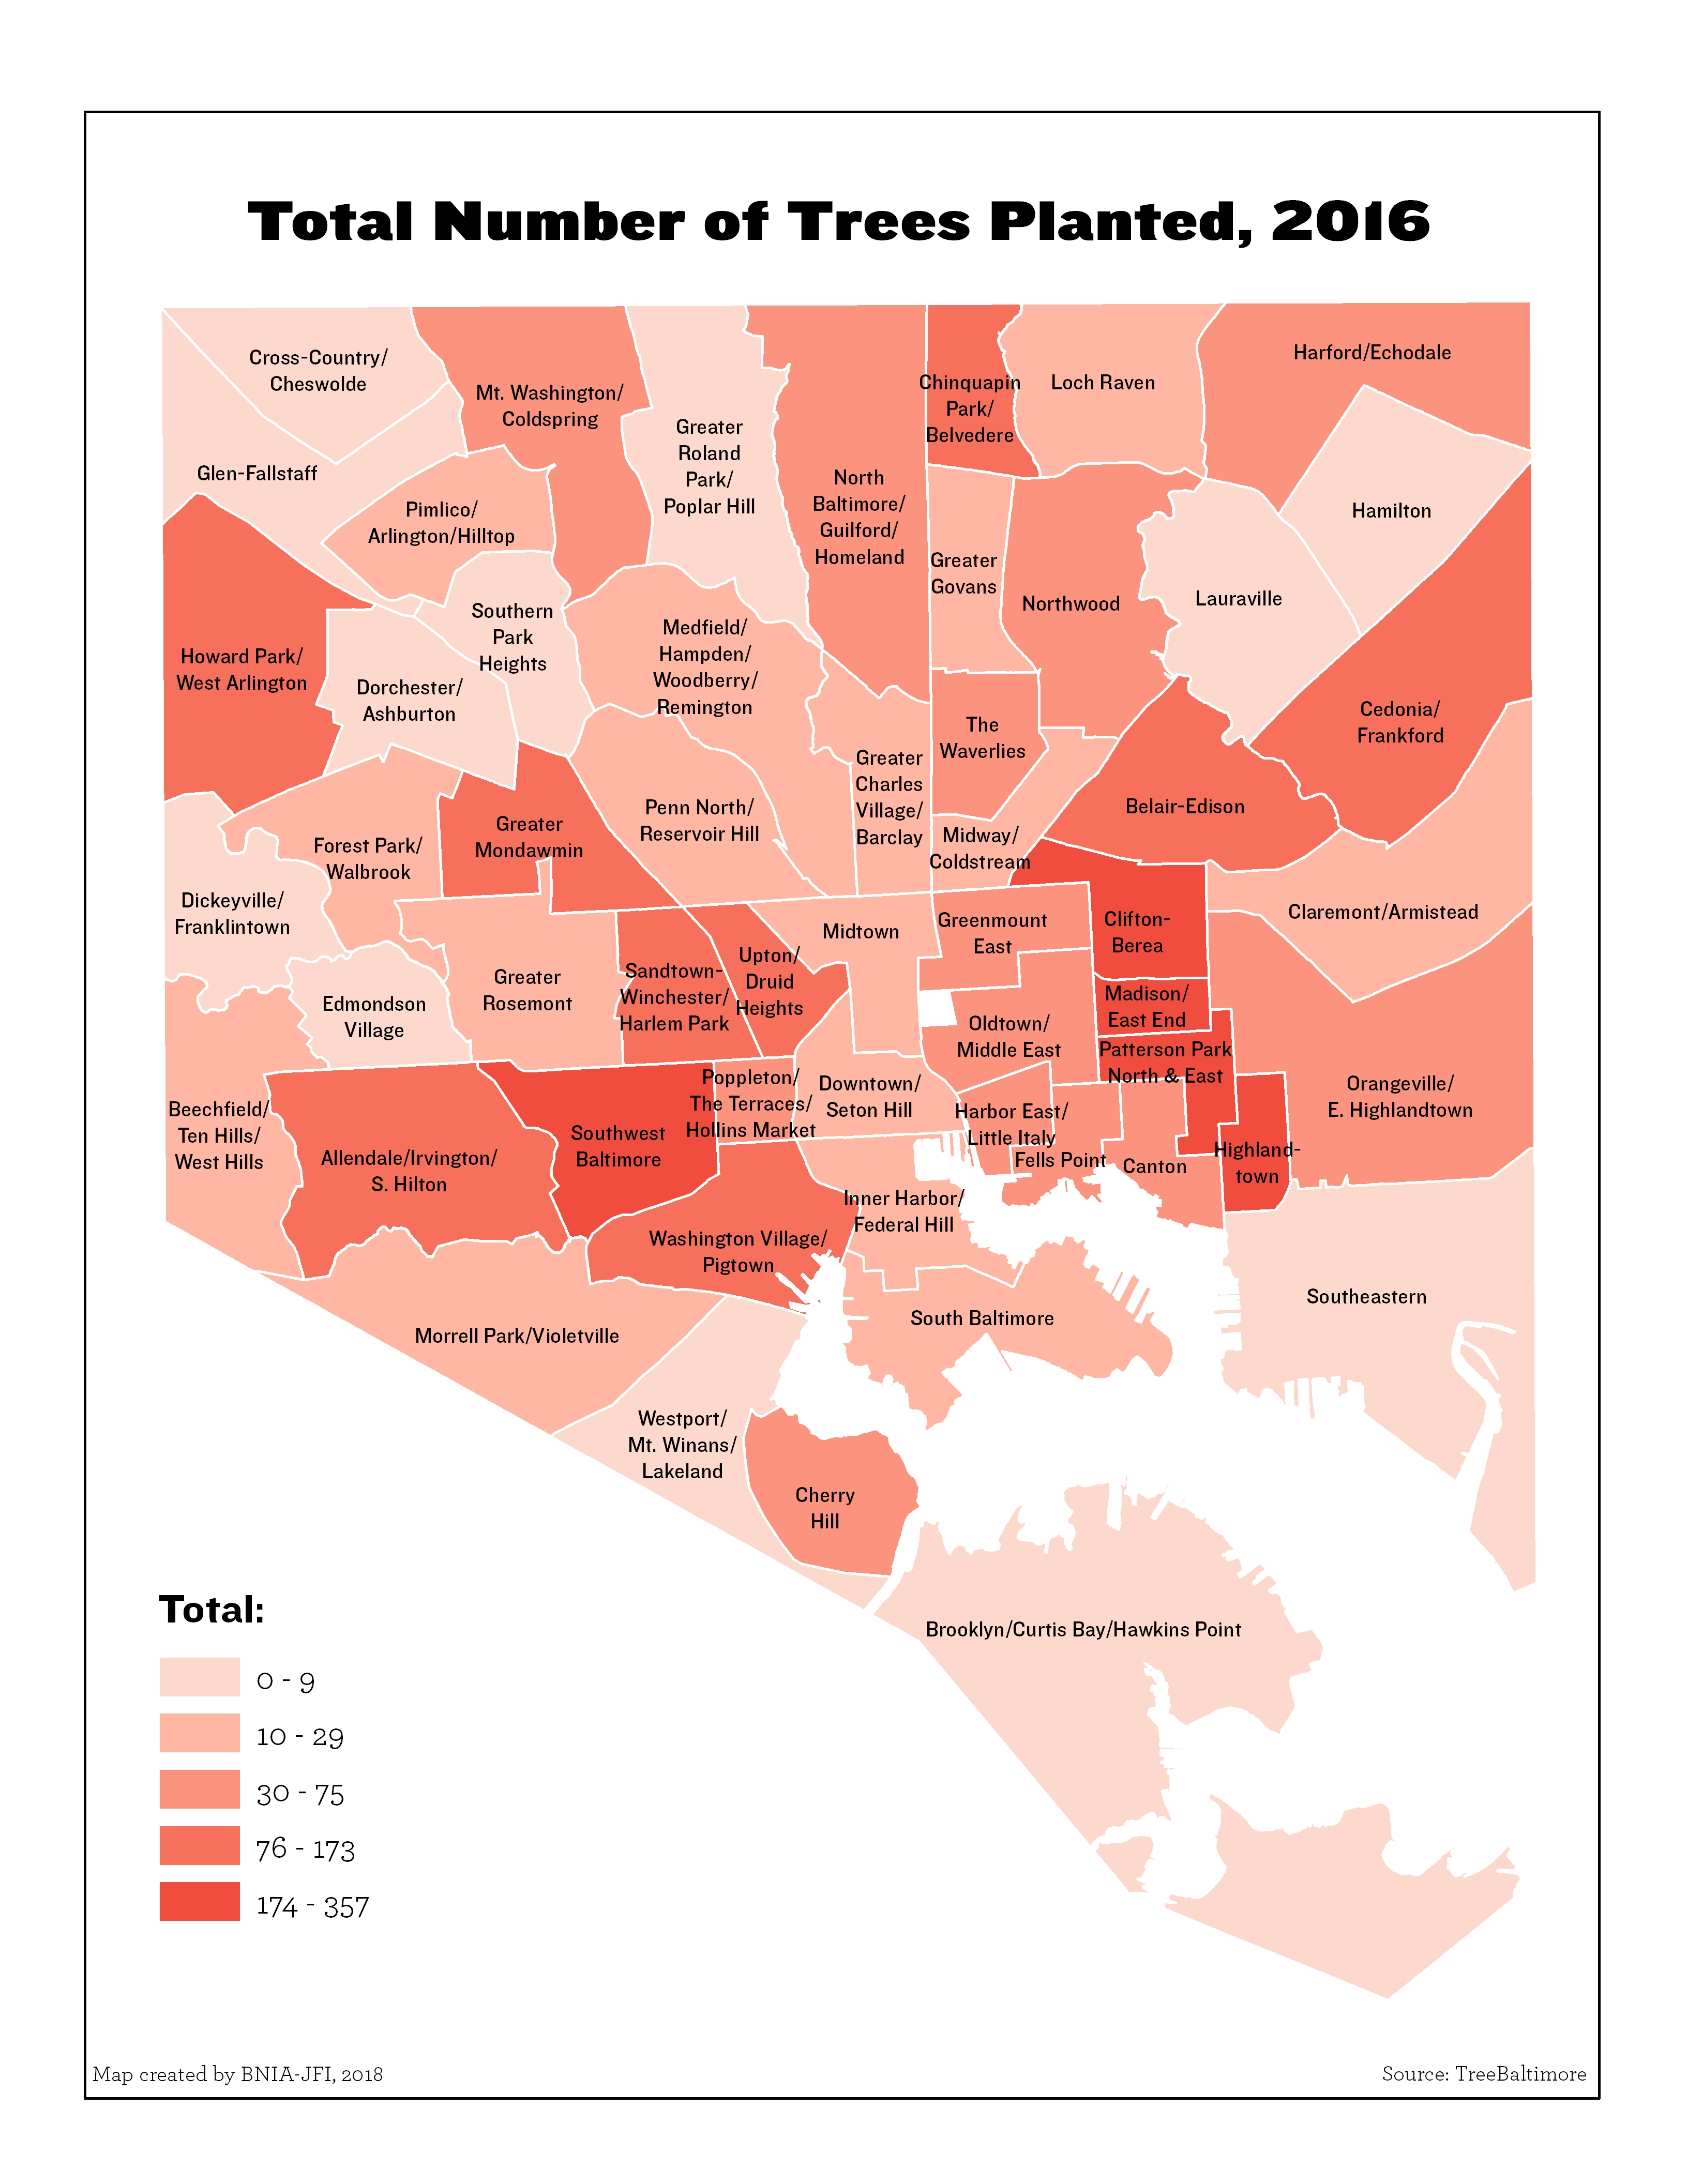
Number of Trees Planted (2020)
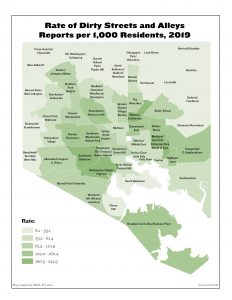
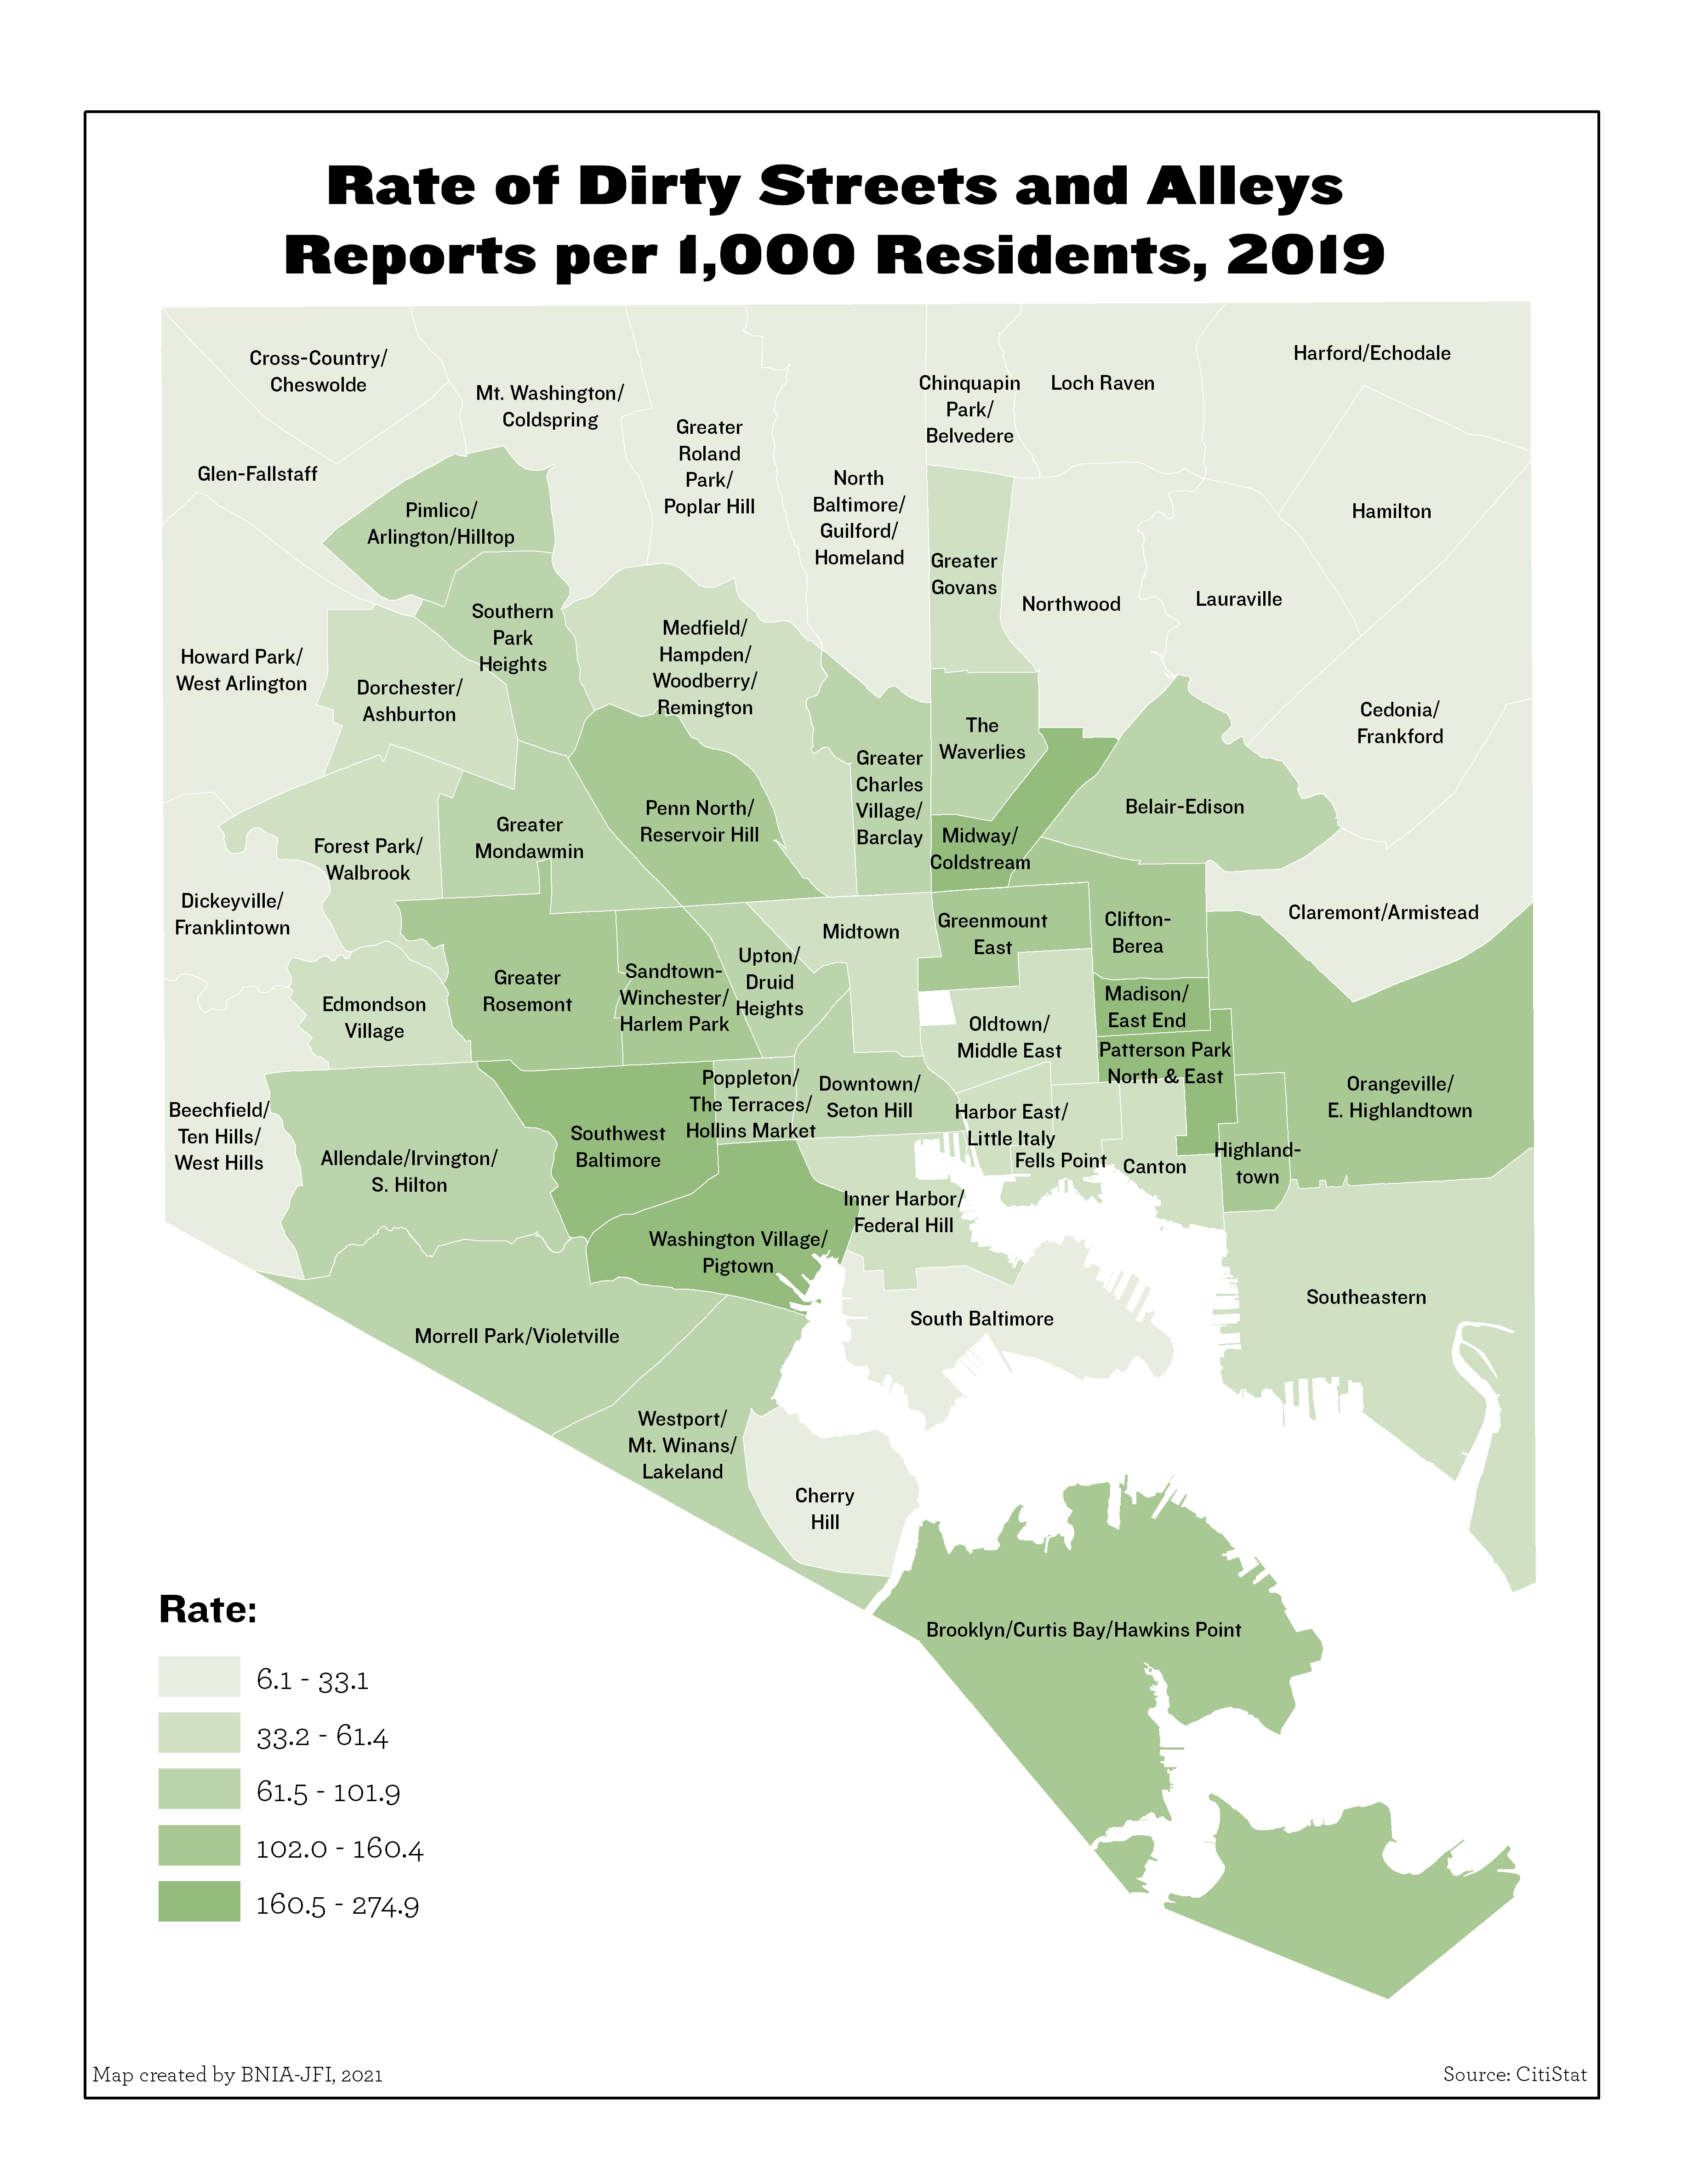
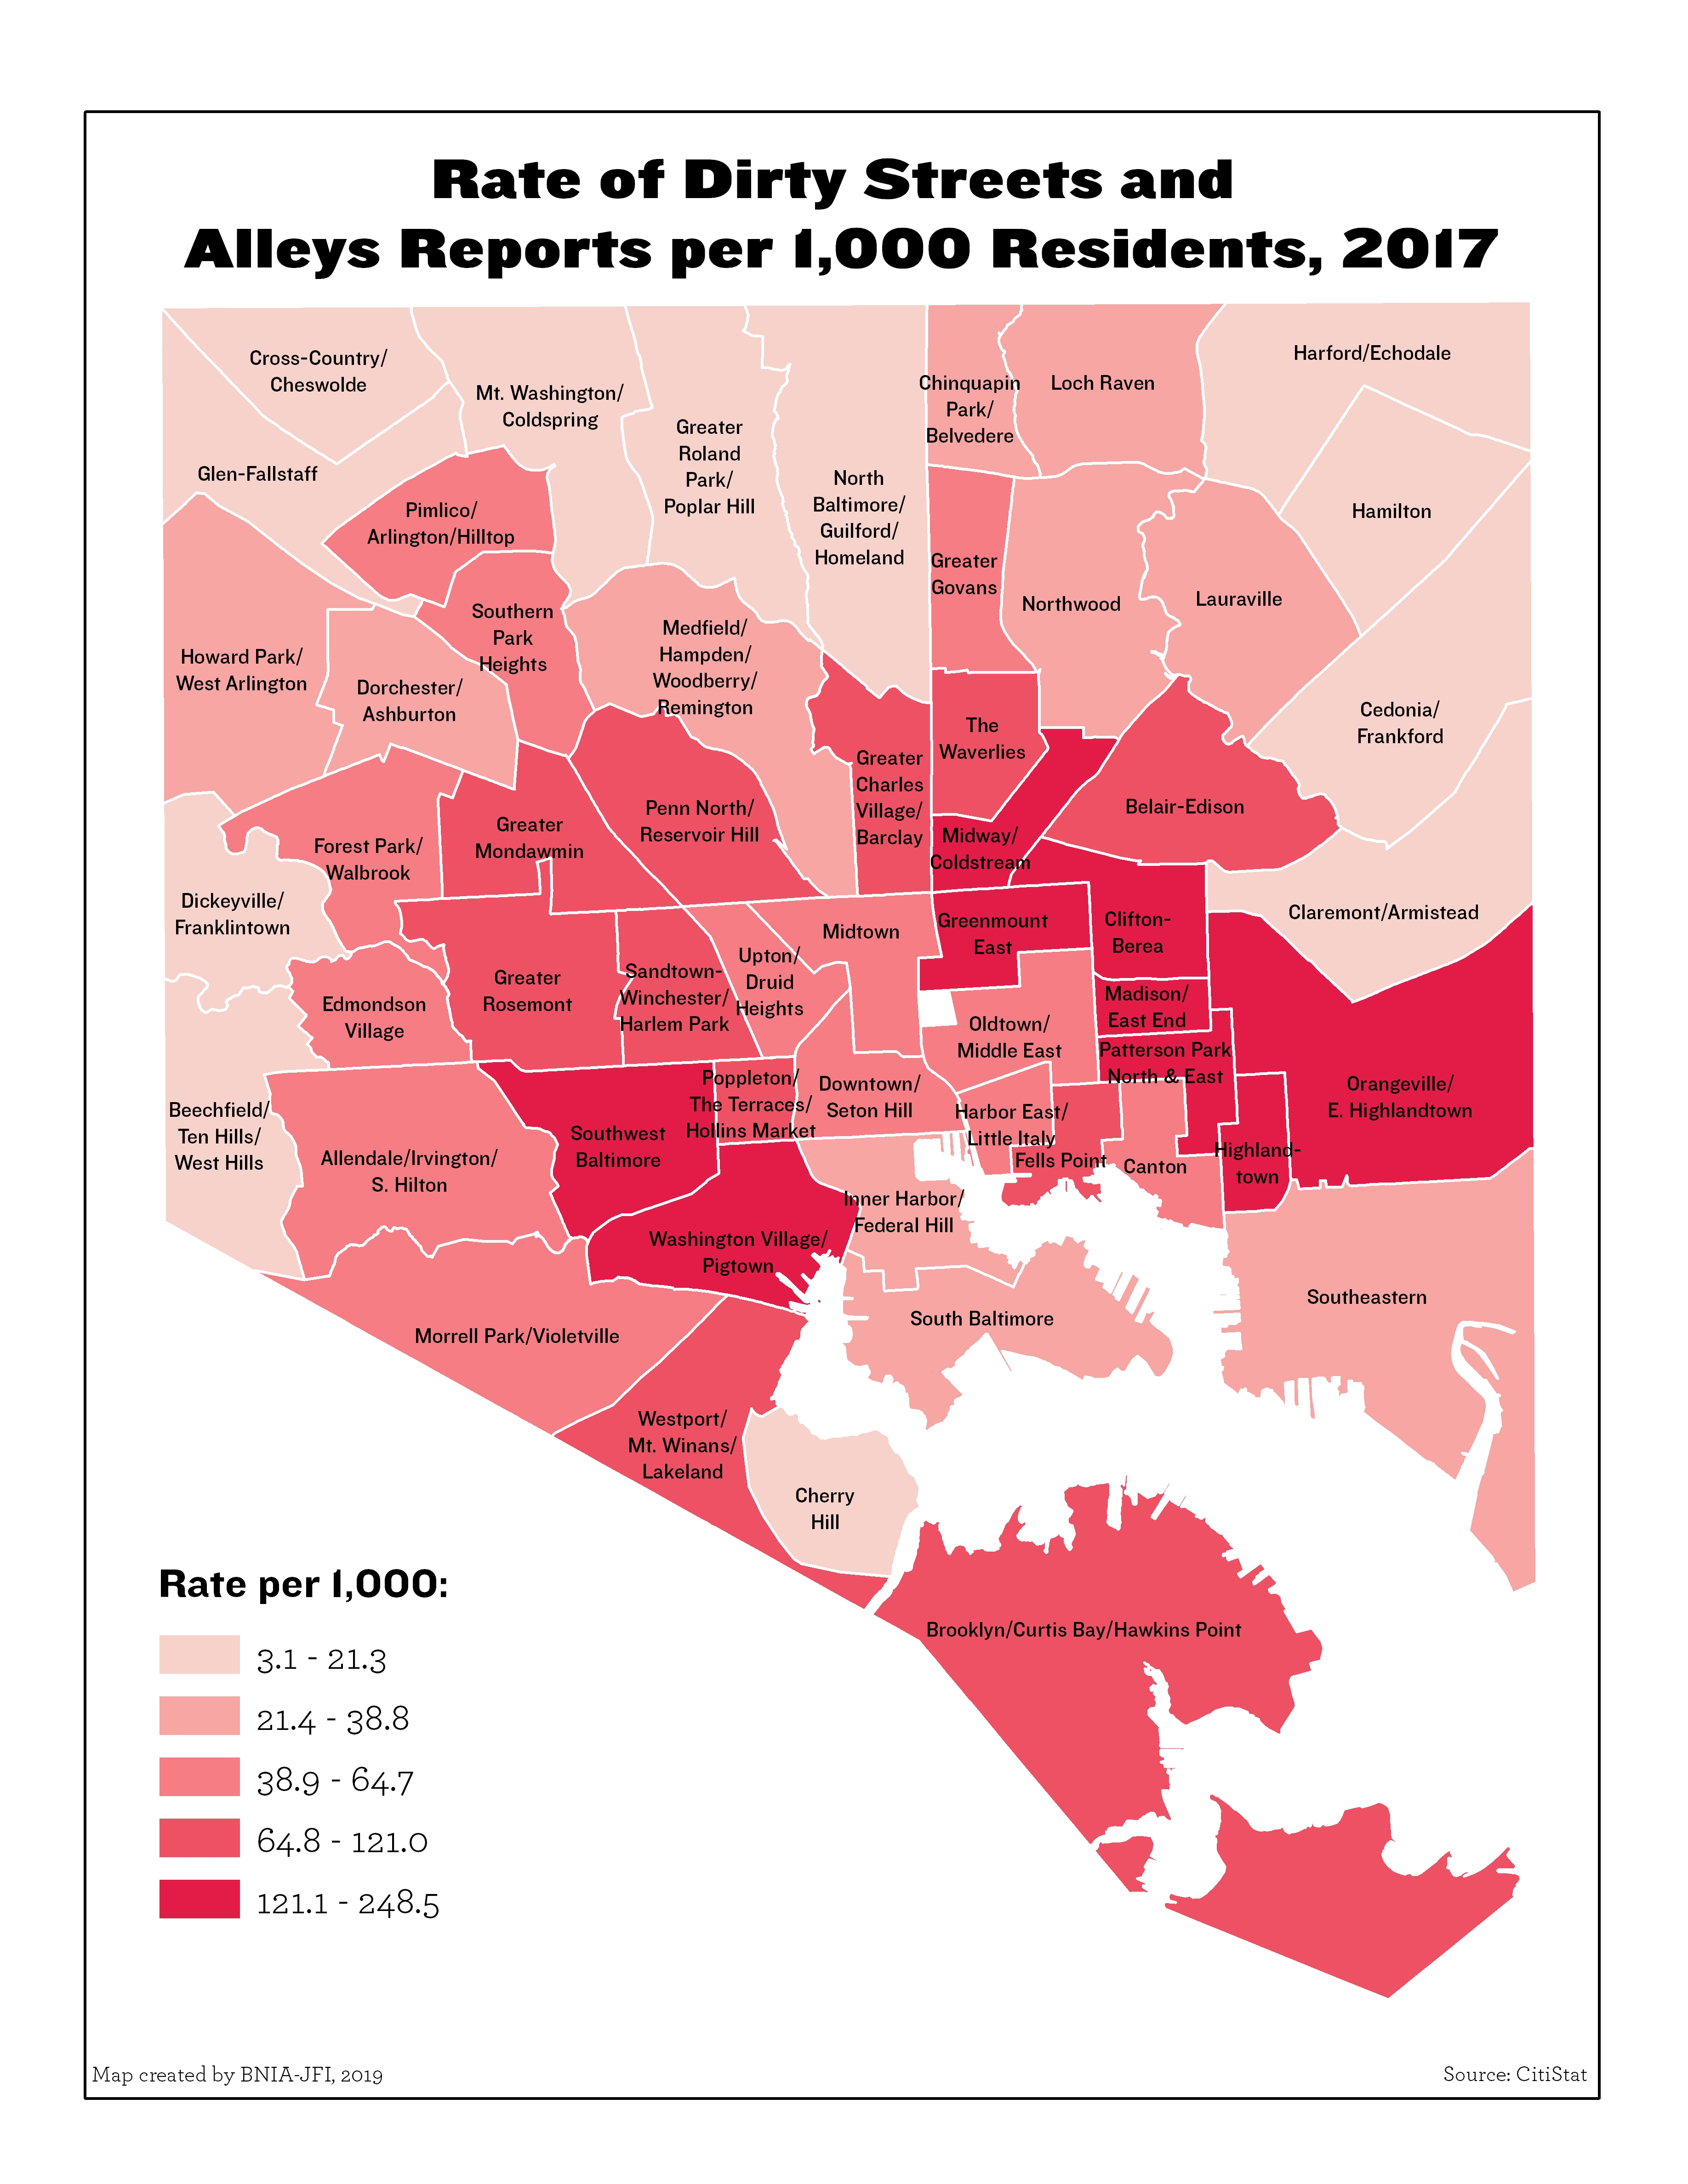
Rate of Dirty Streets and Alleys Reports per 1,000 Residents (2019)
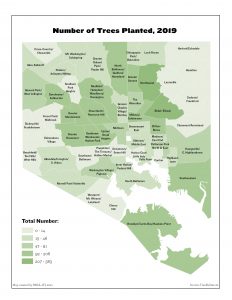
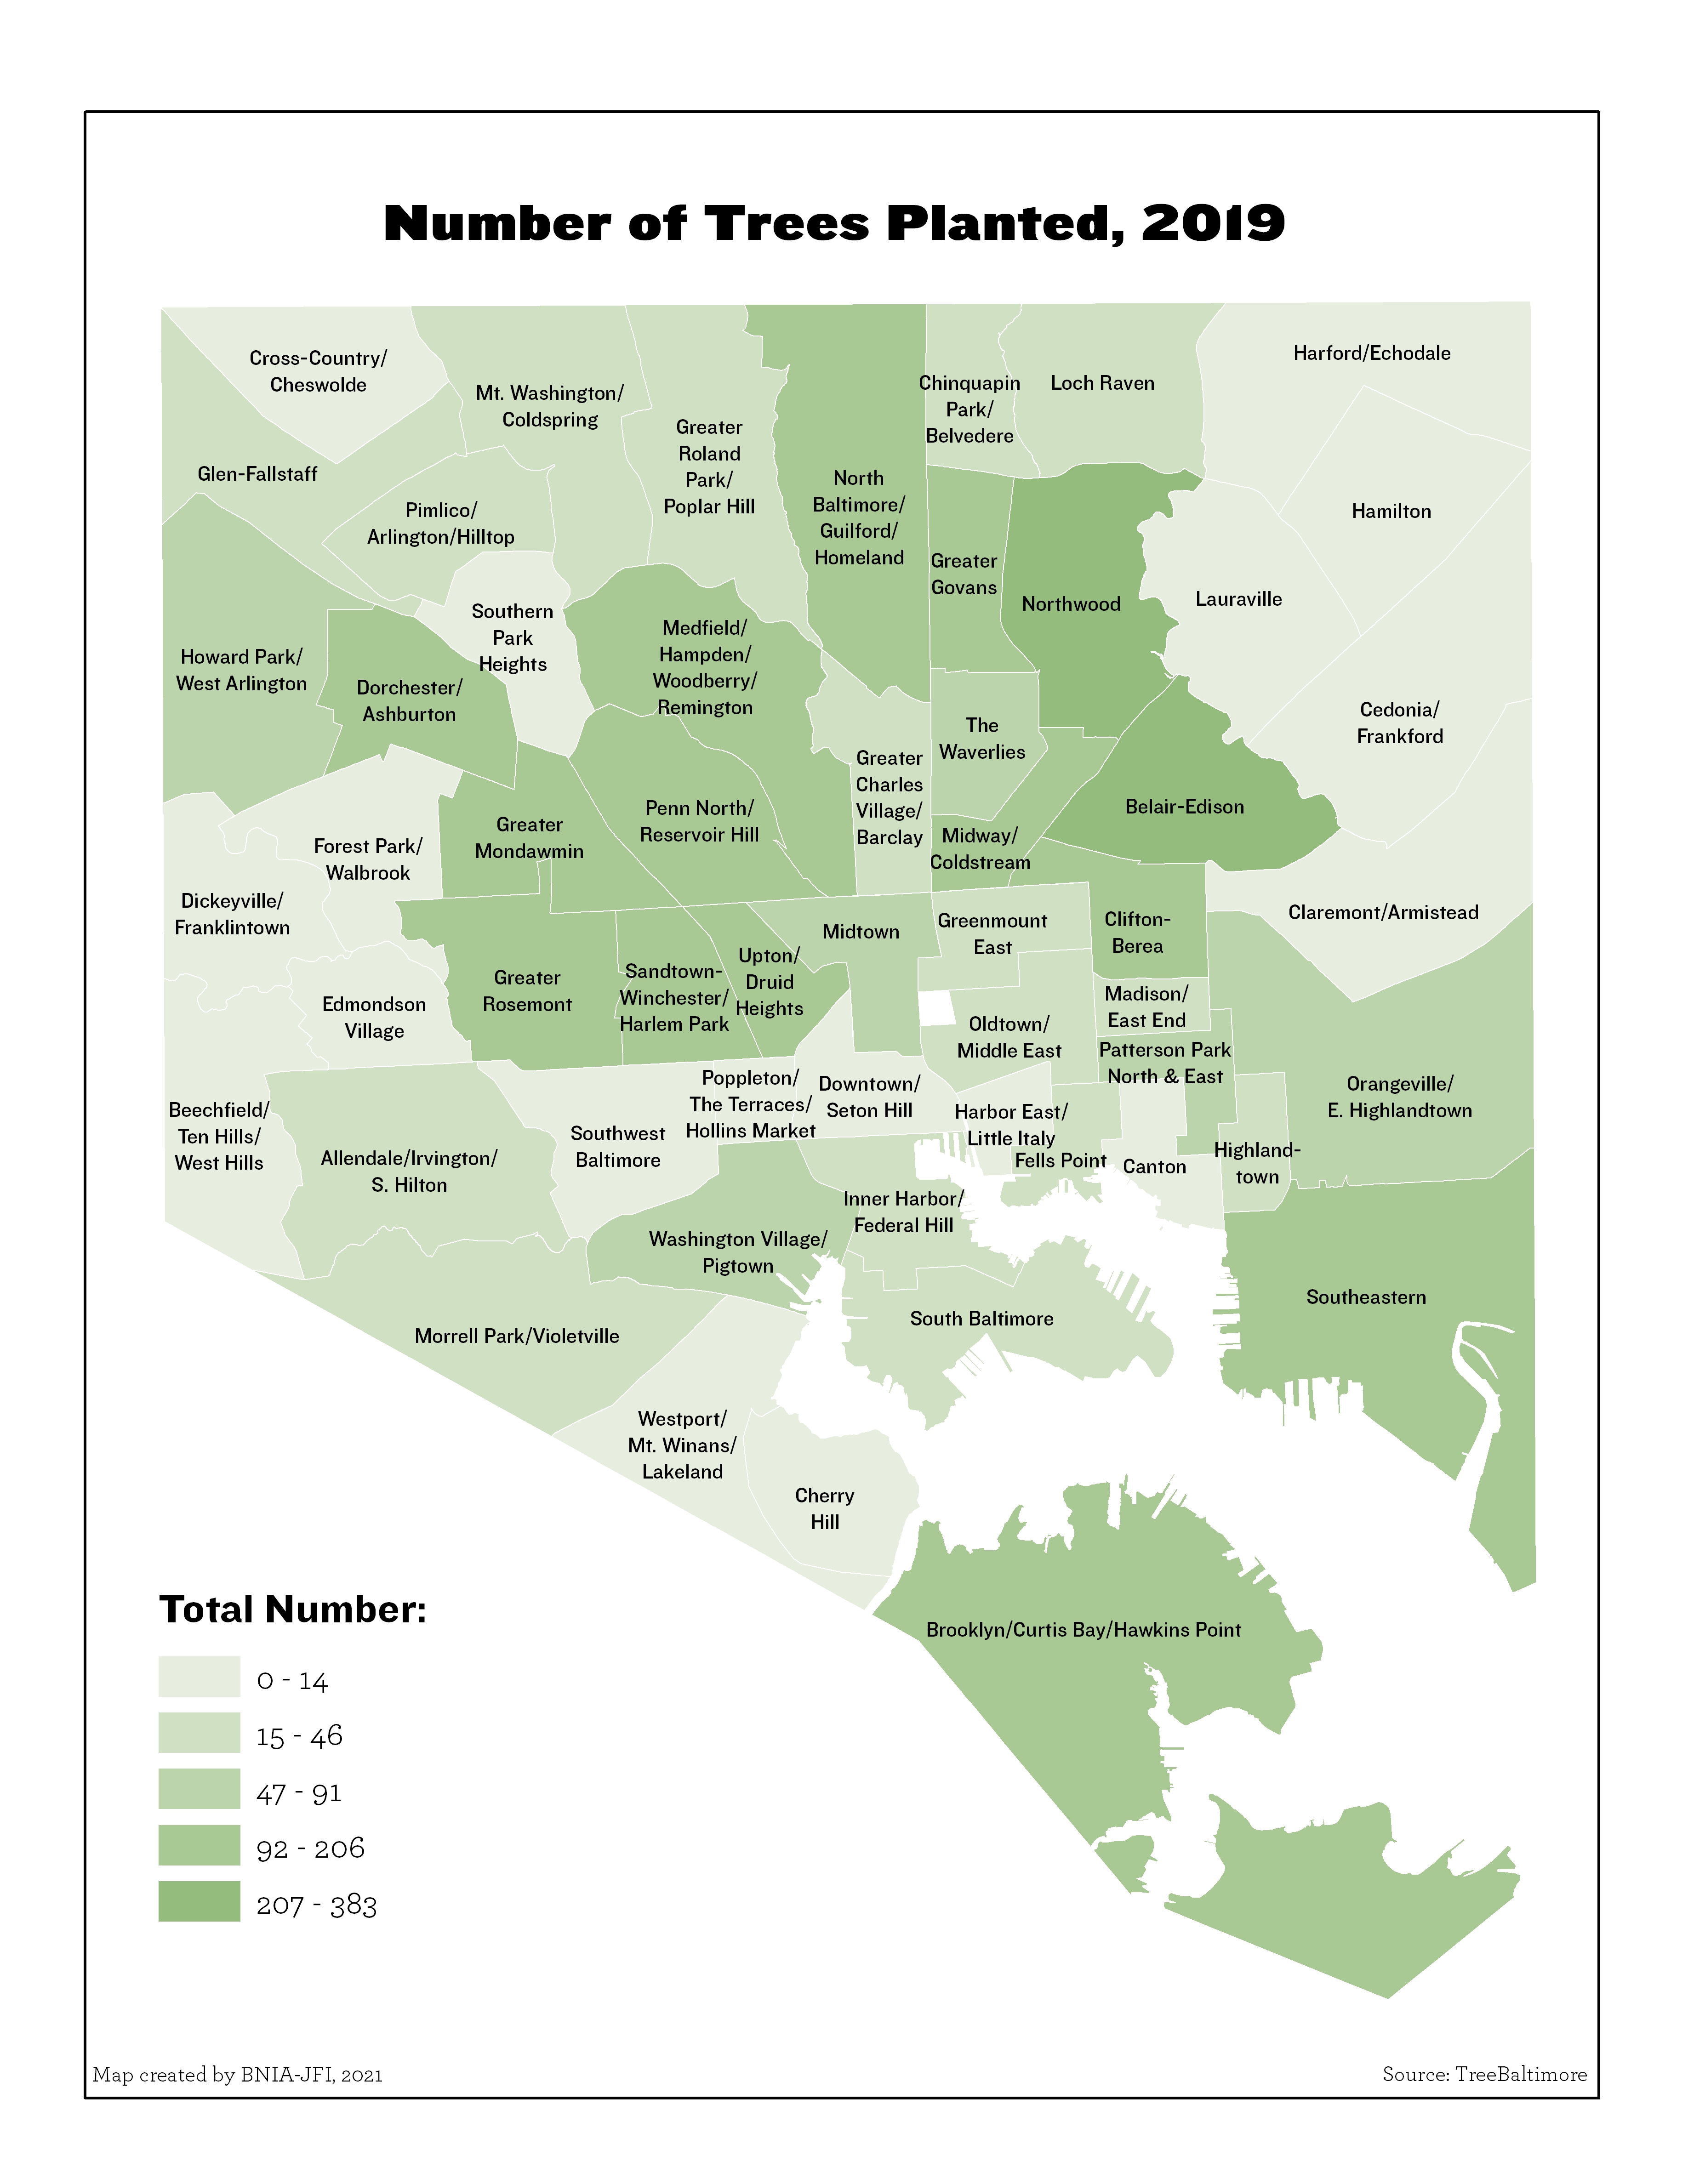
Number of Trees Planted
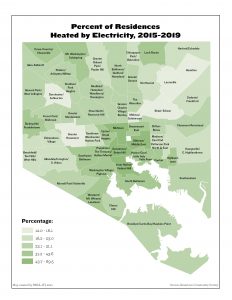
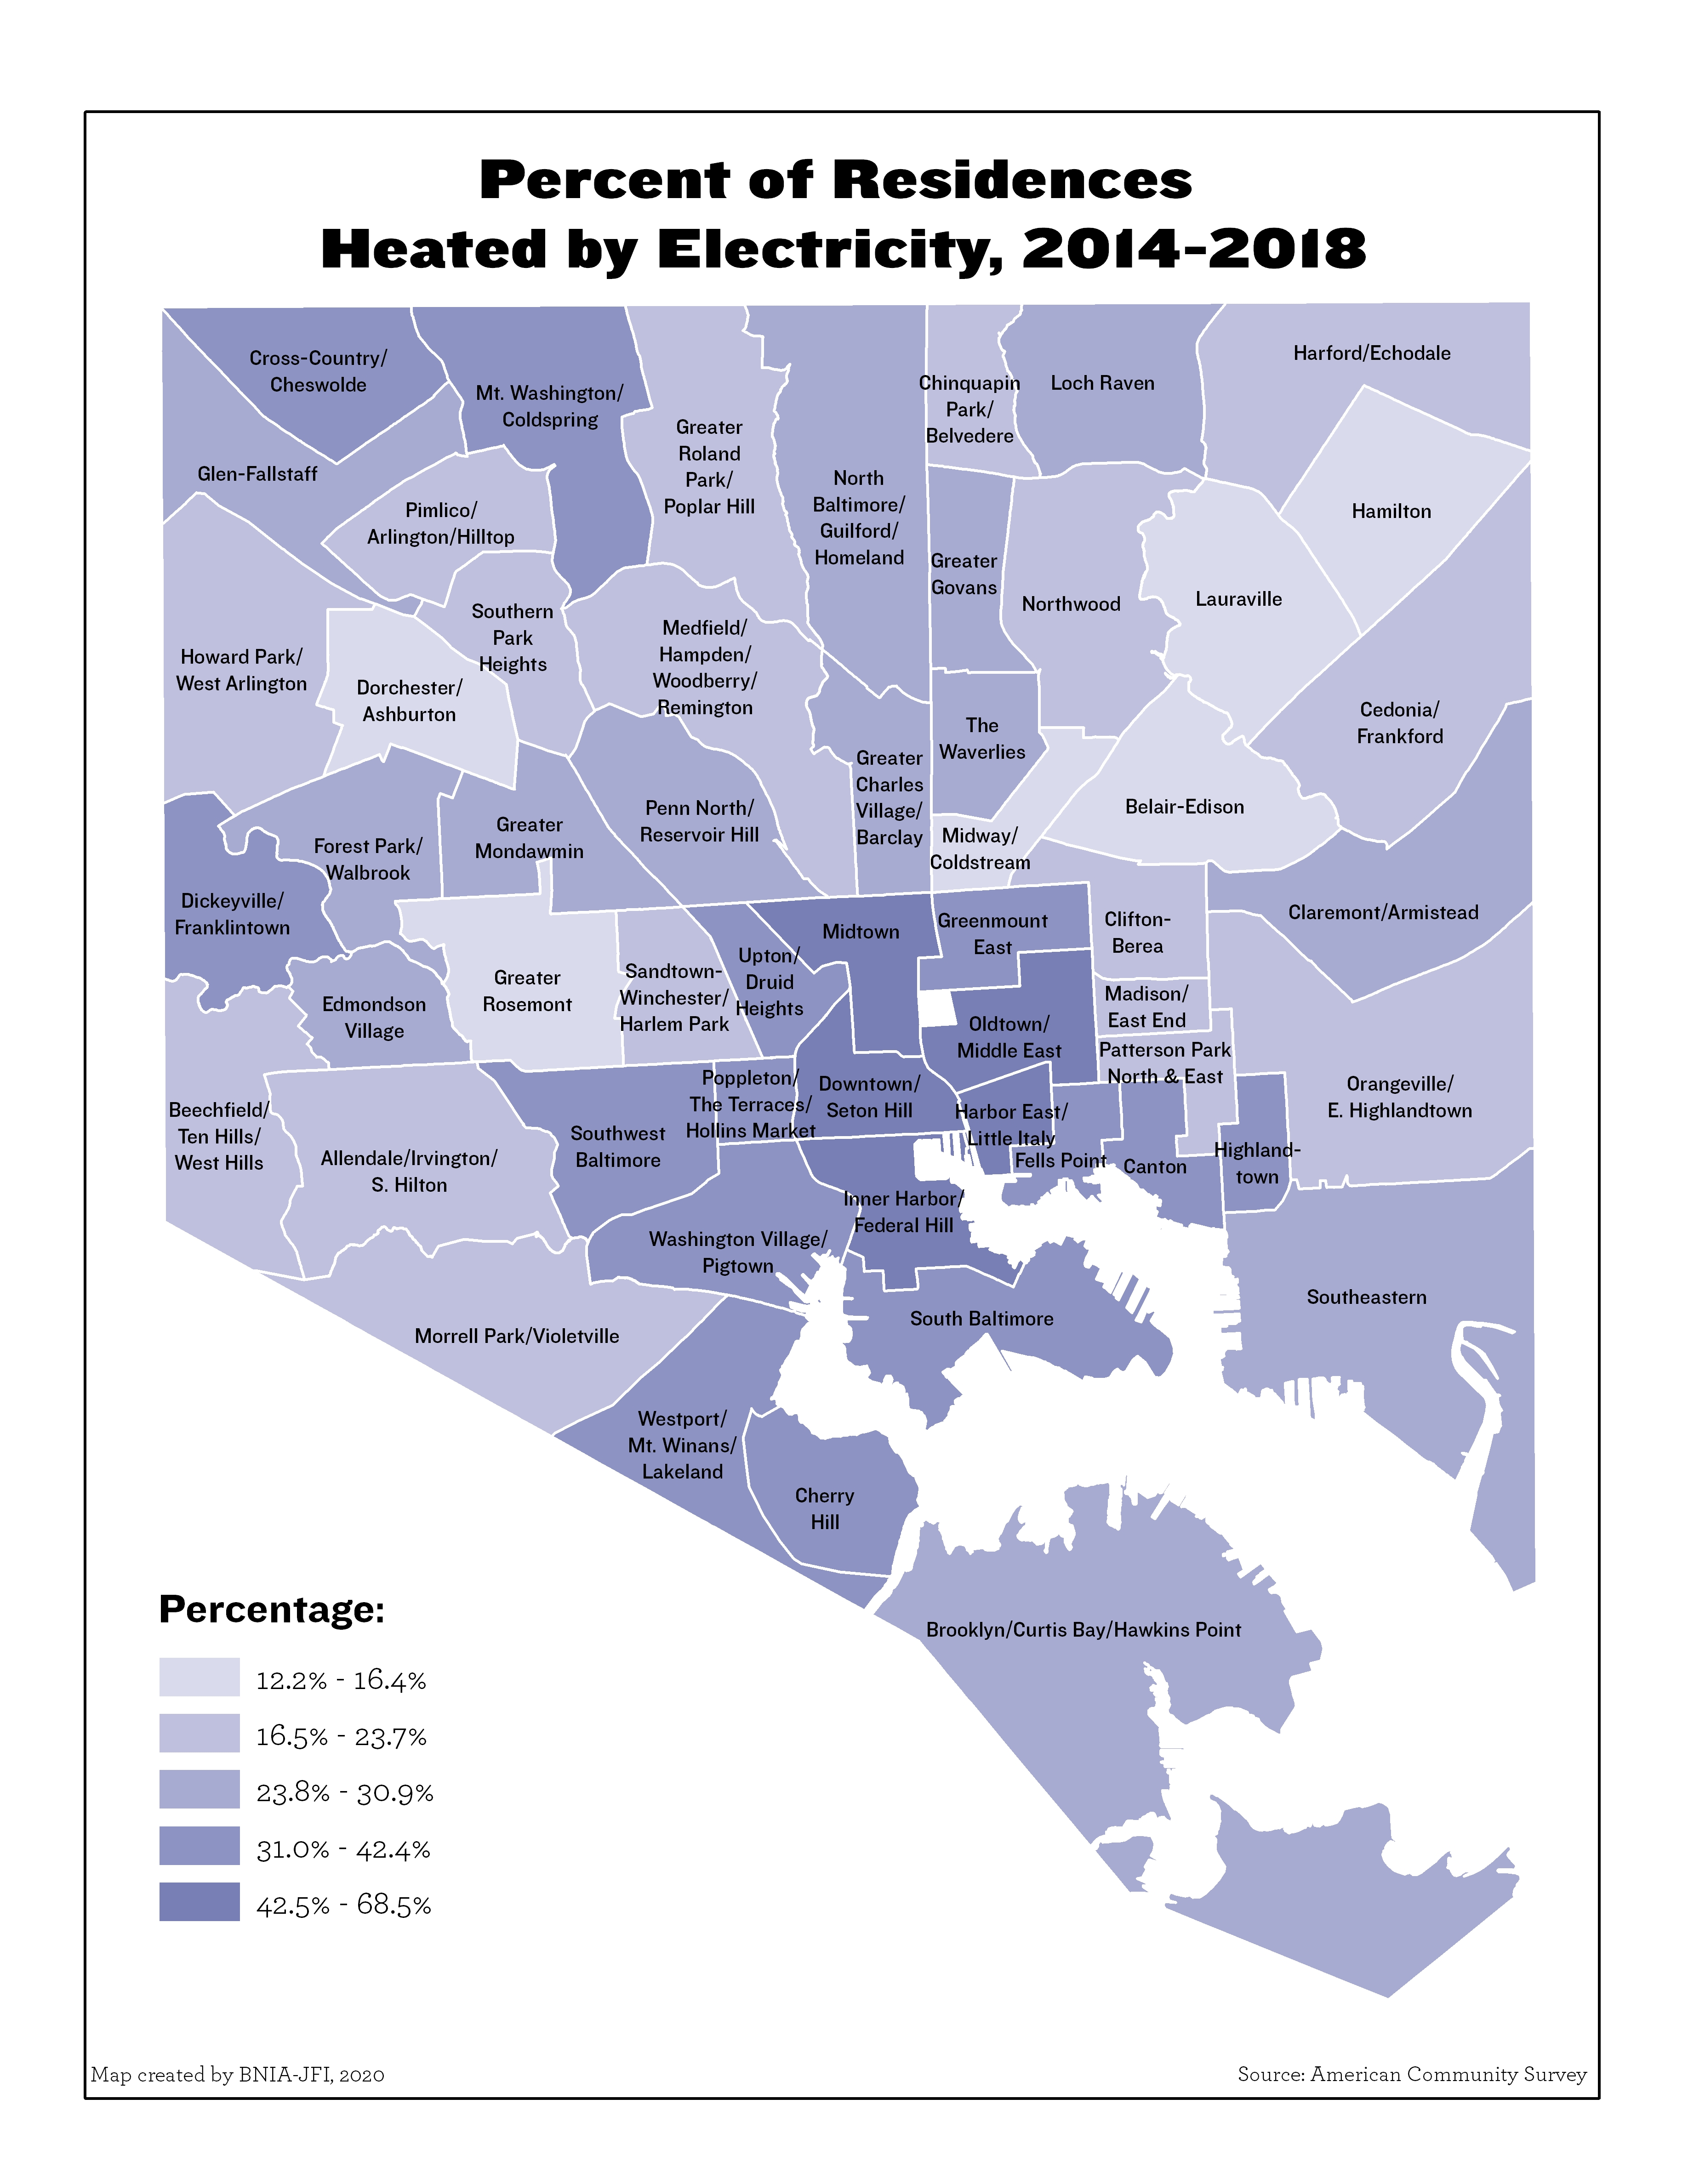
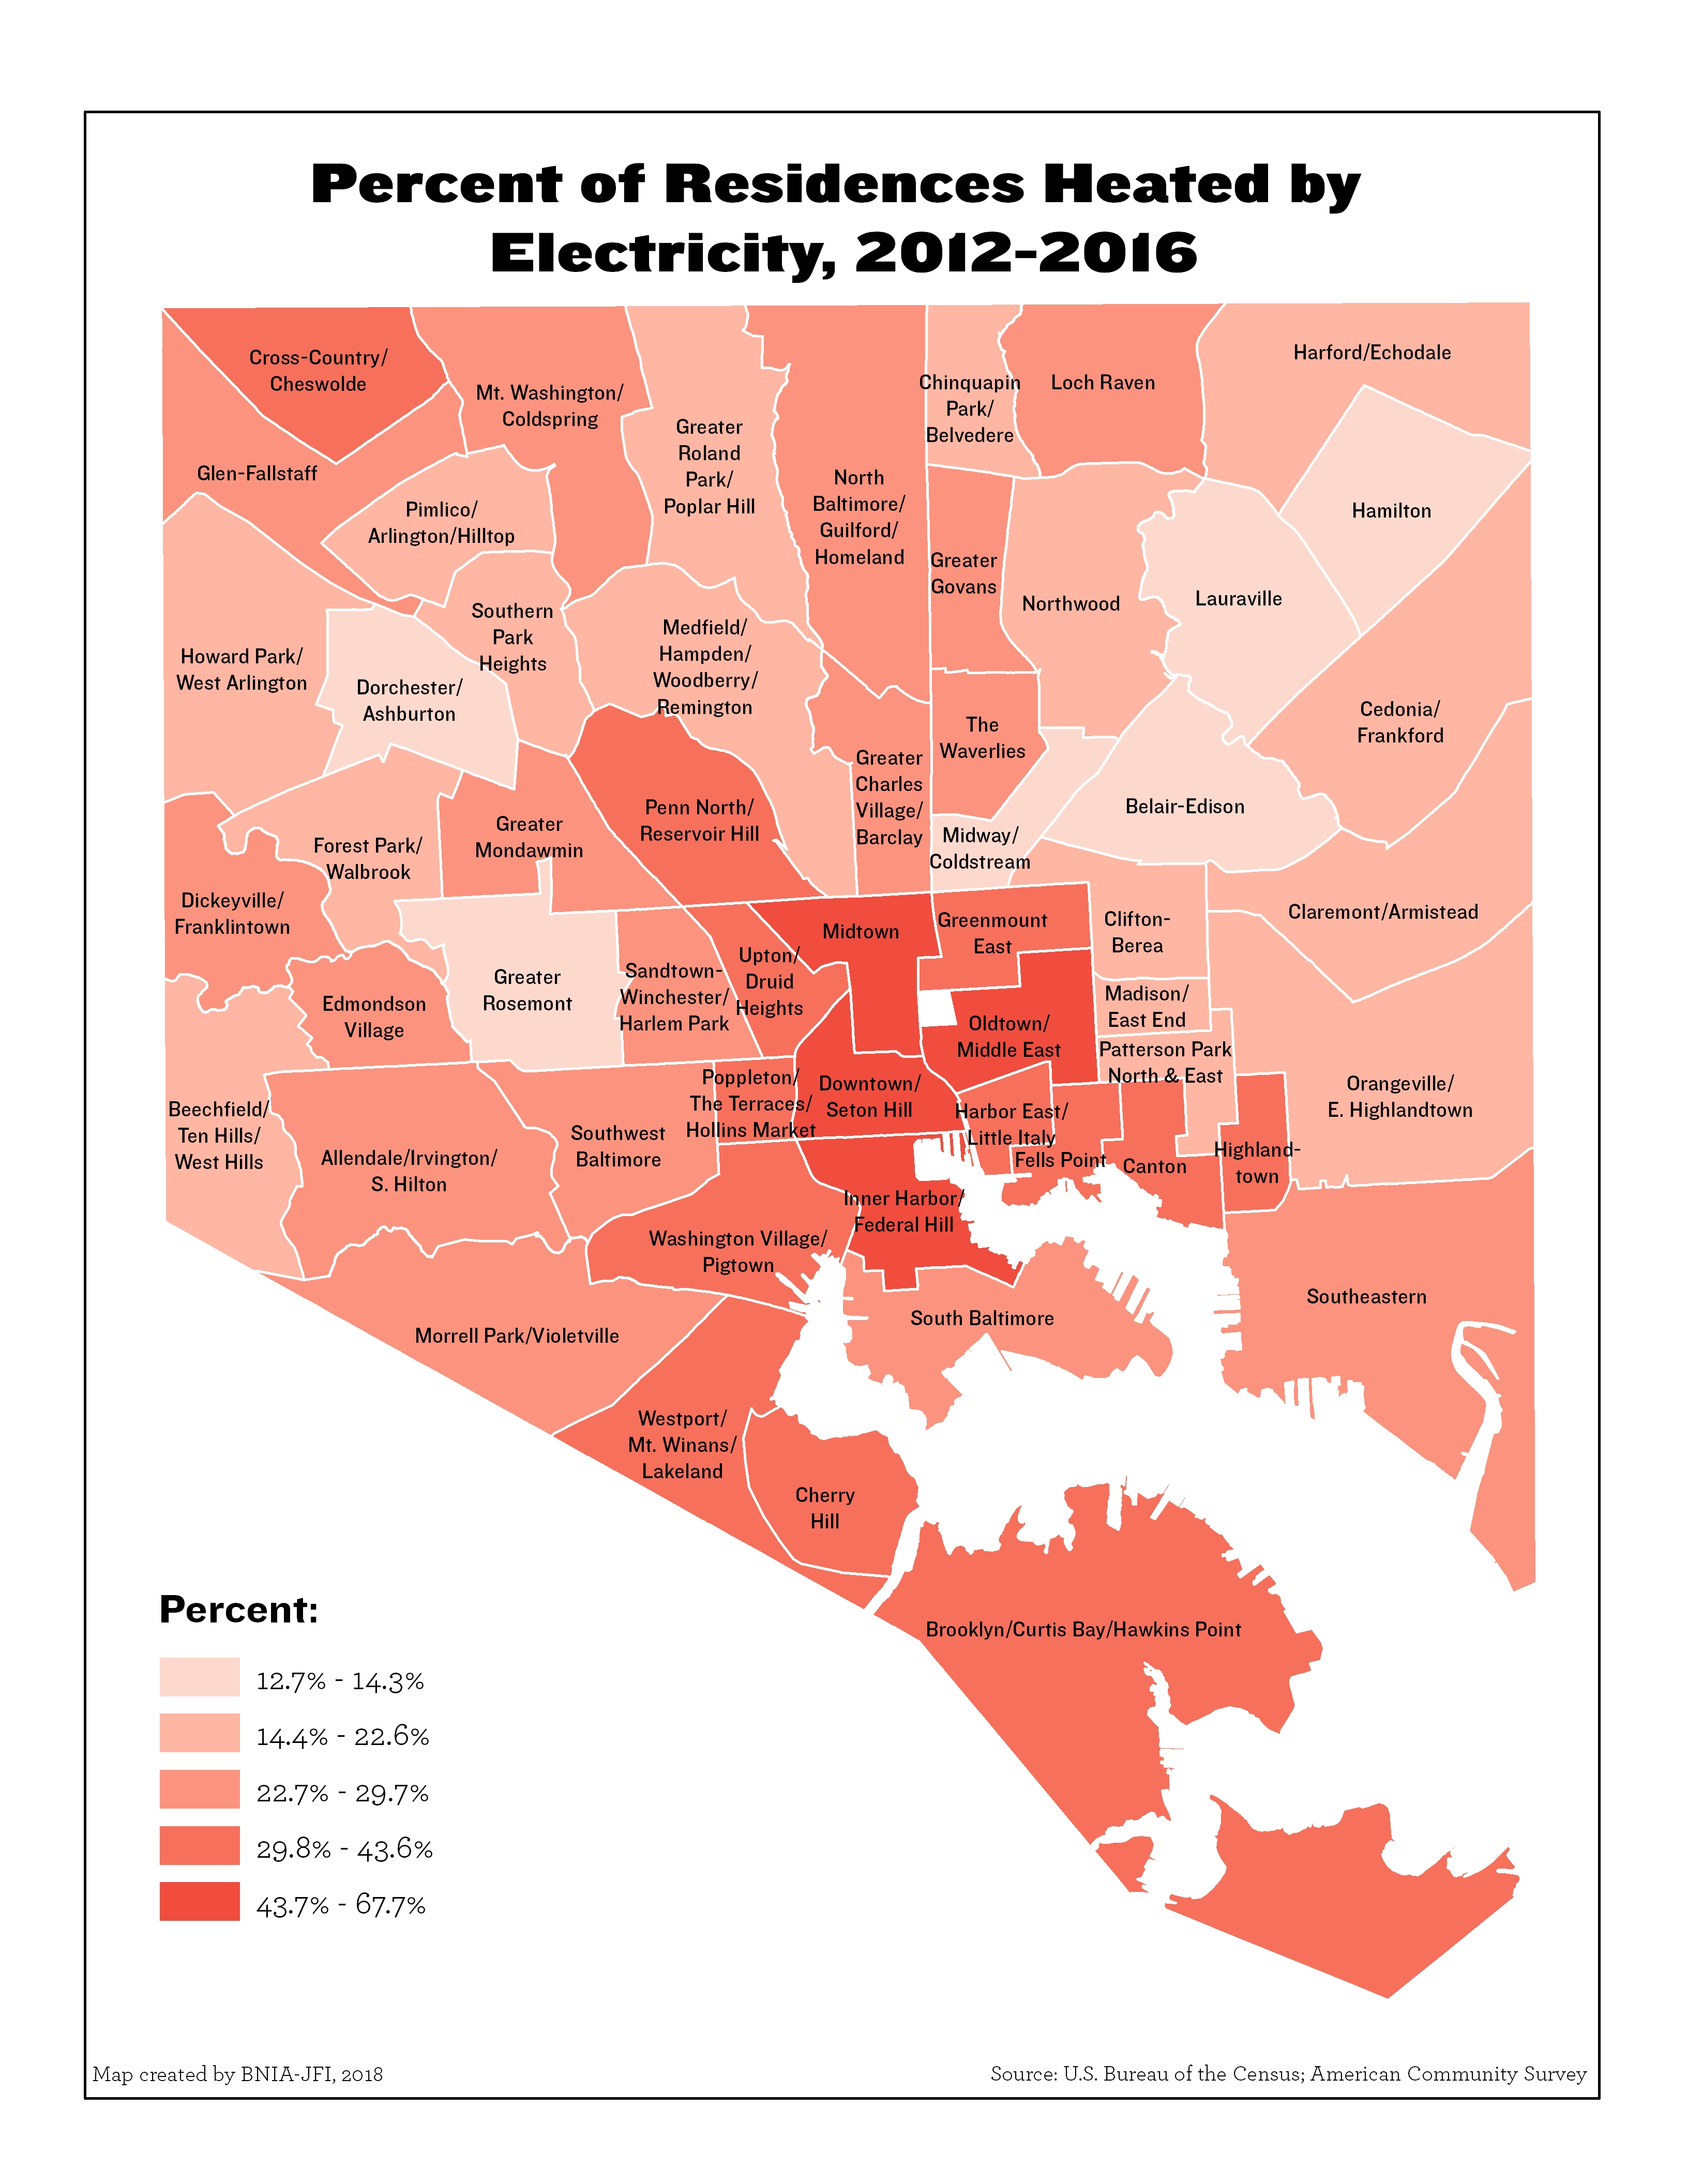
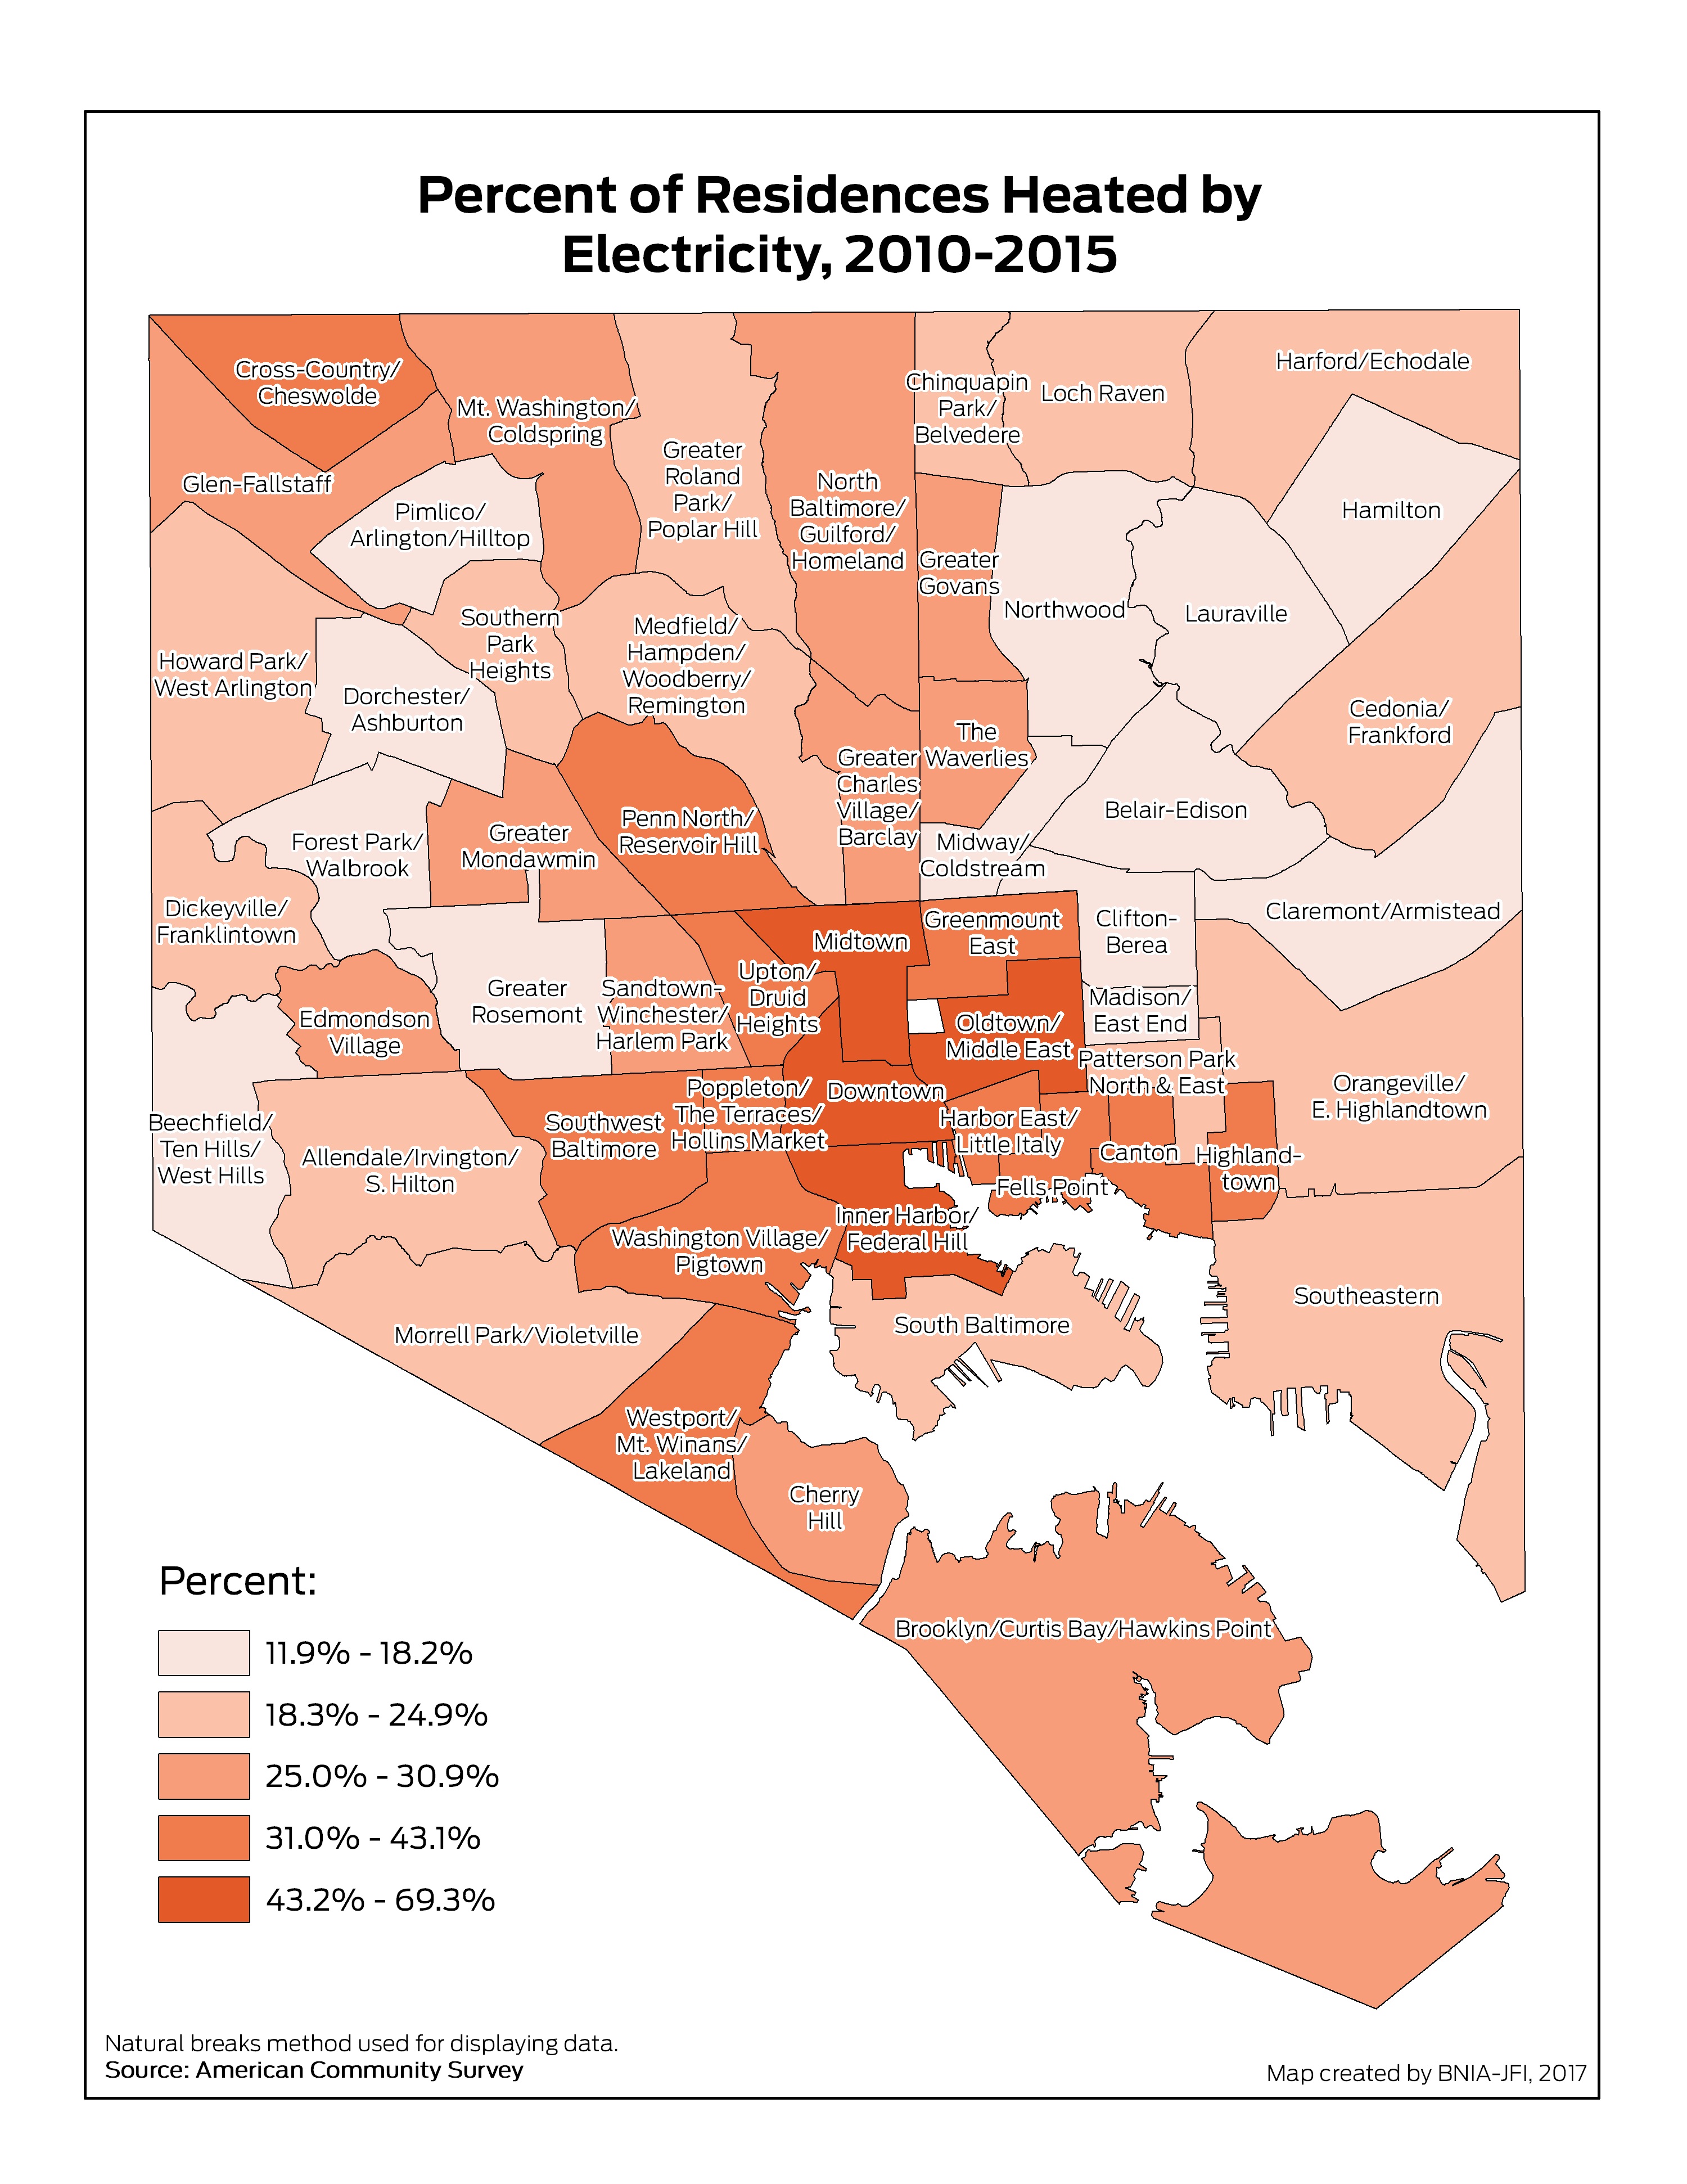
Percent of Residences Heated by Electricity
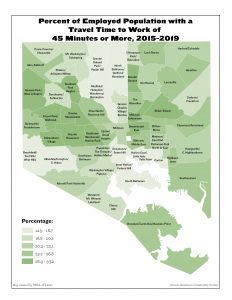
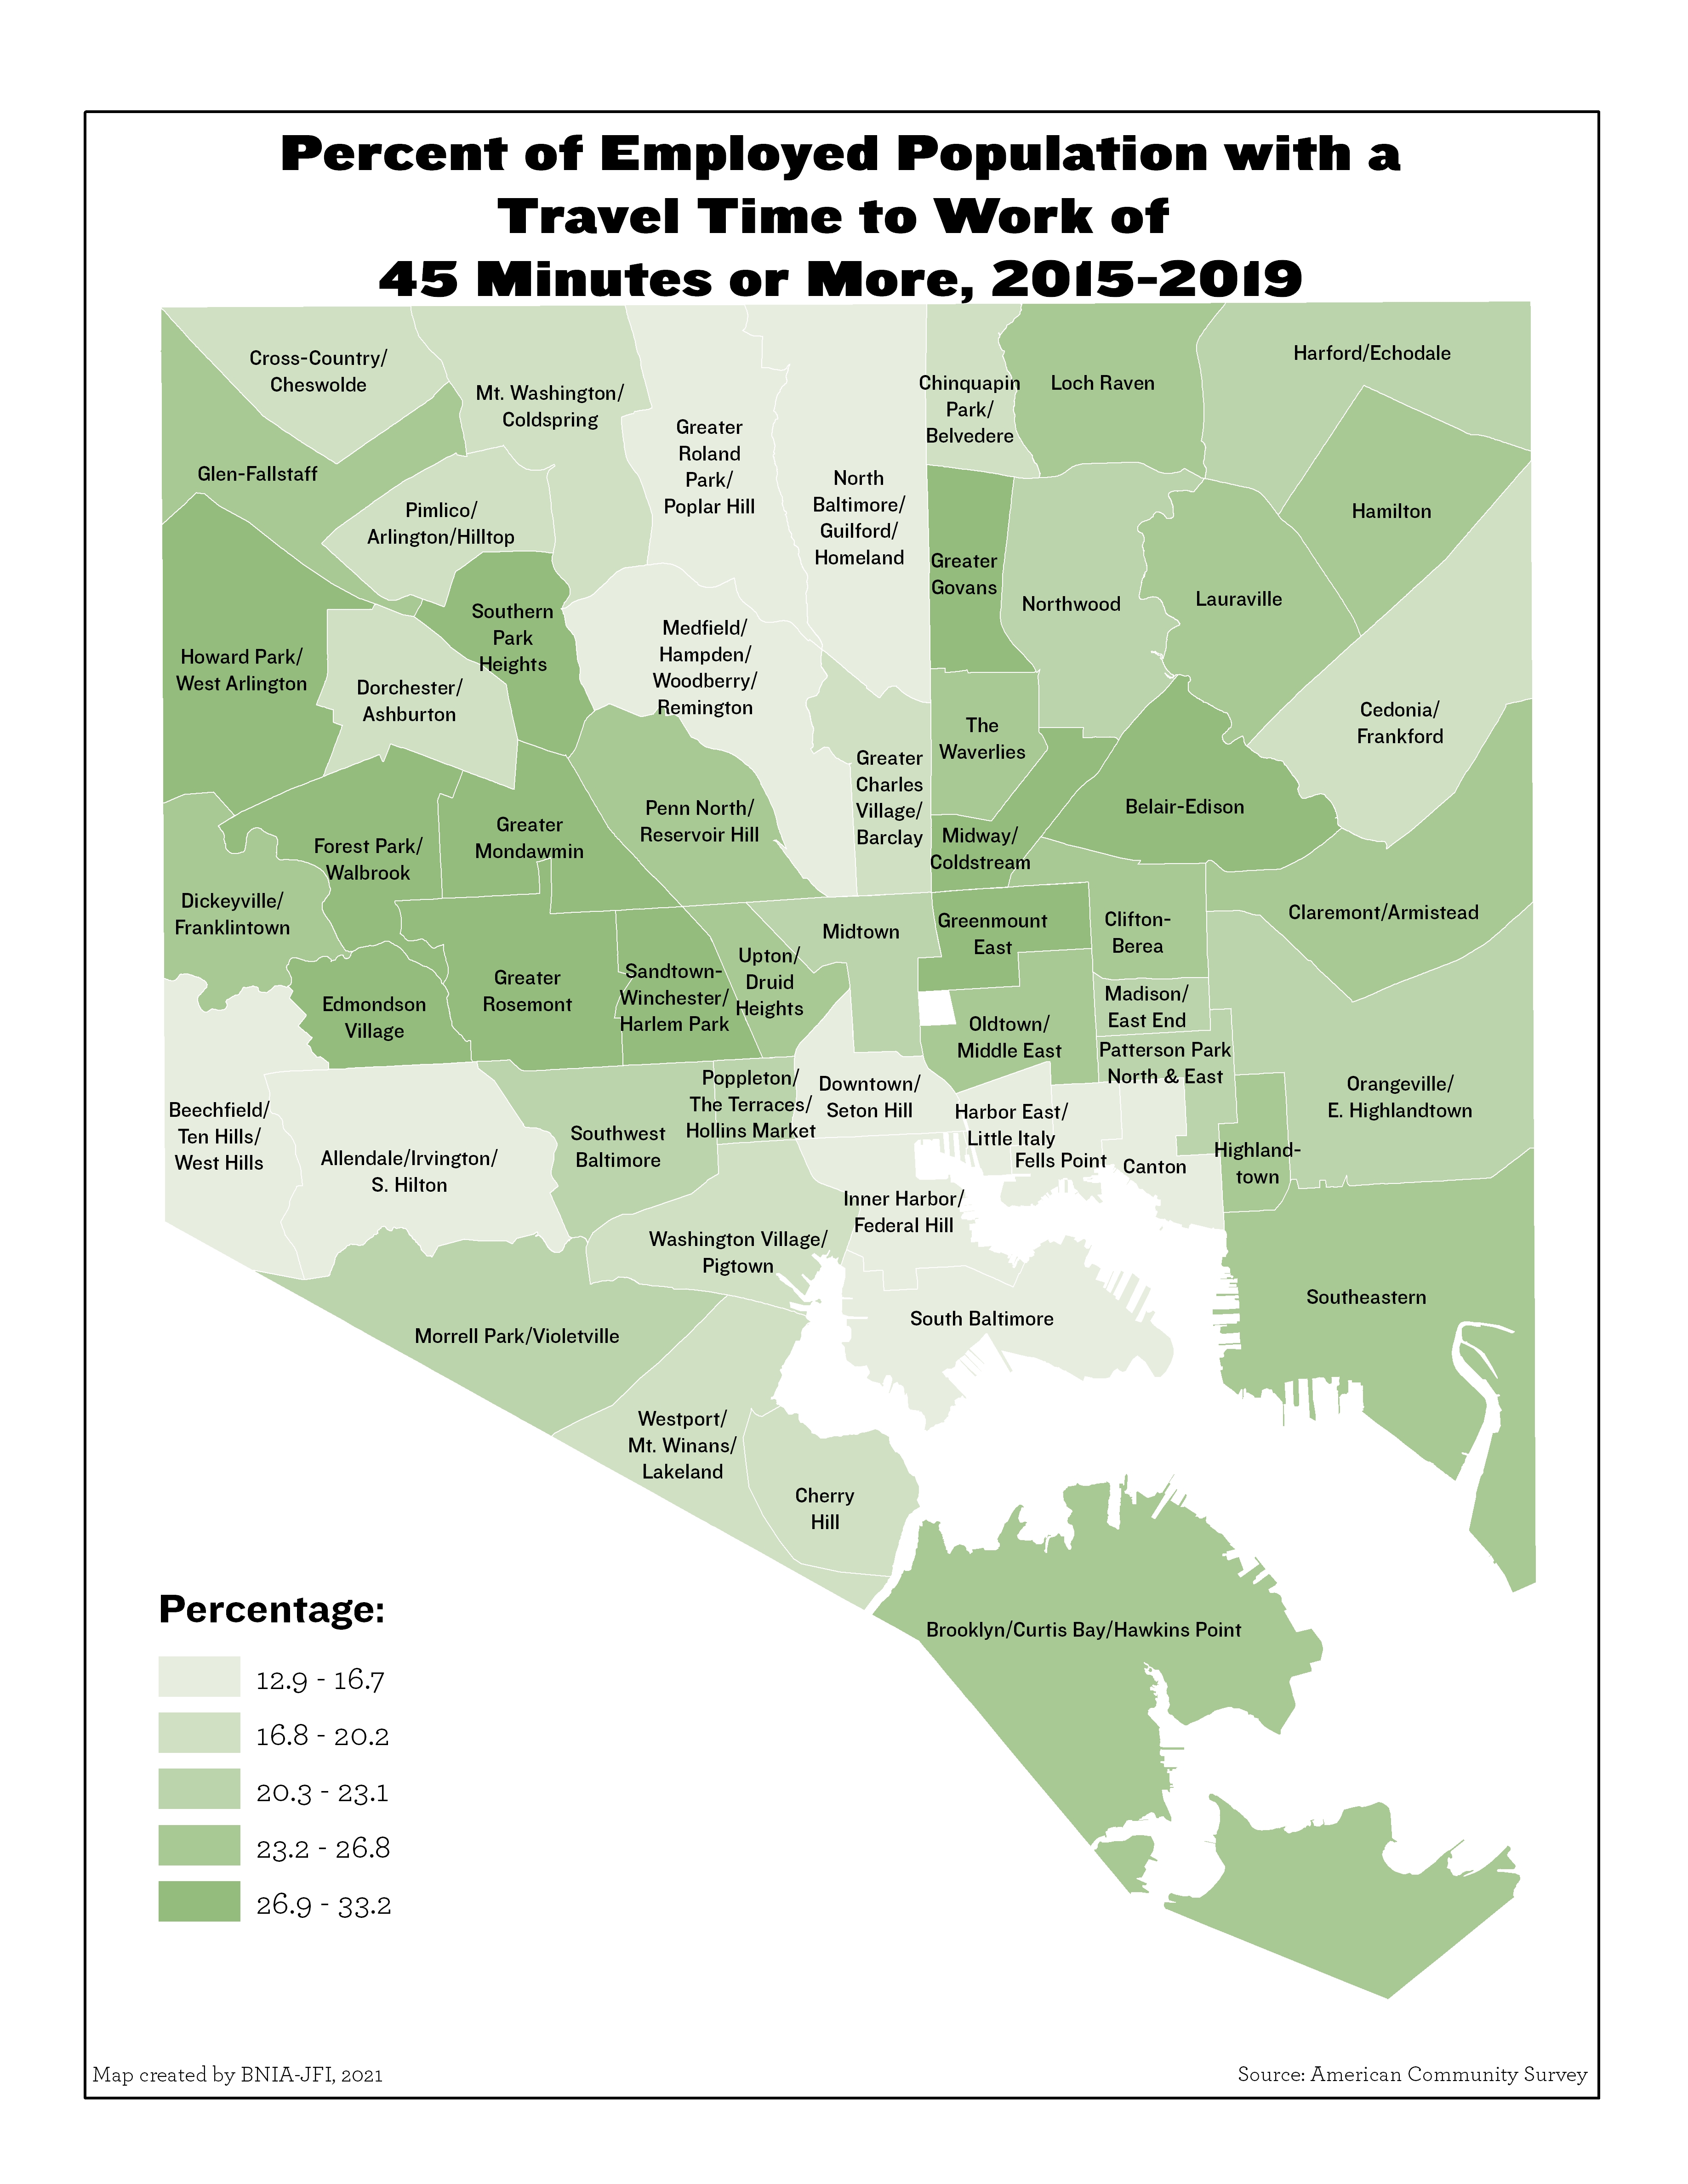
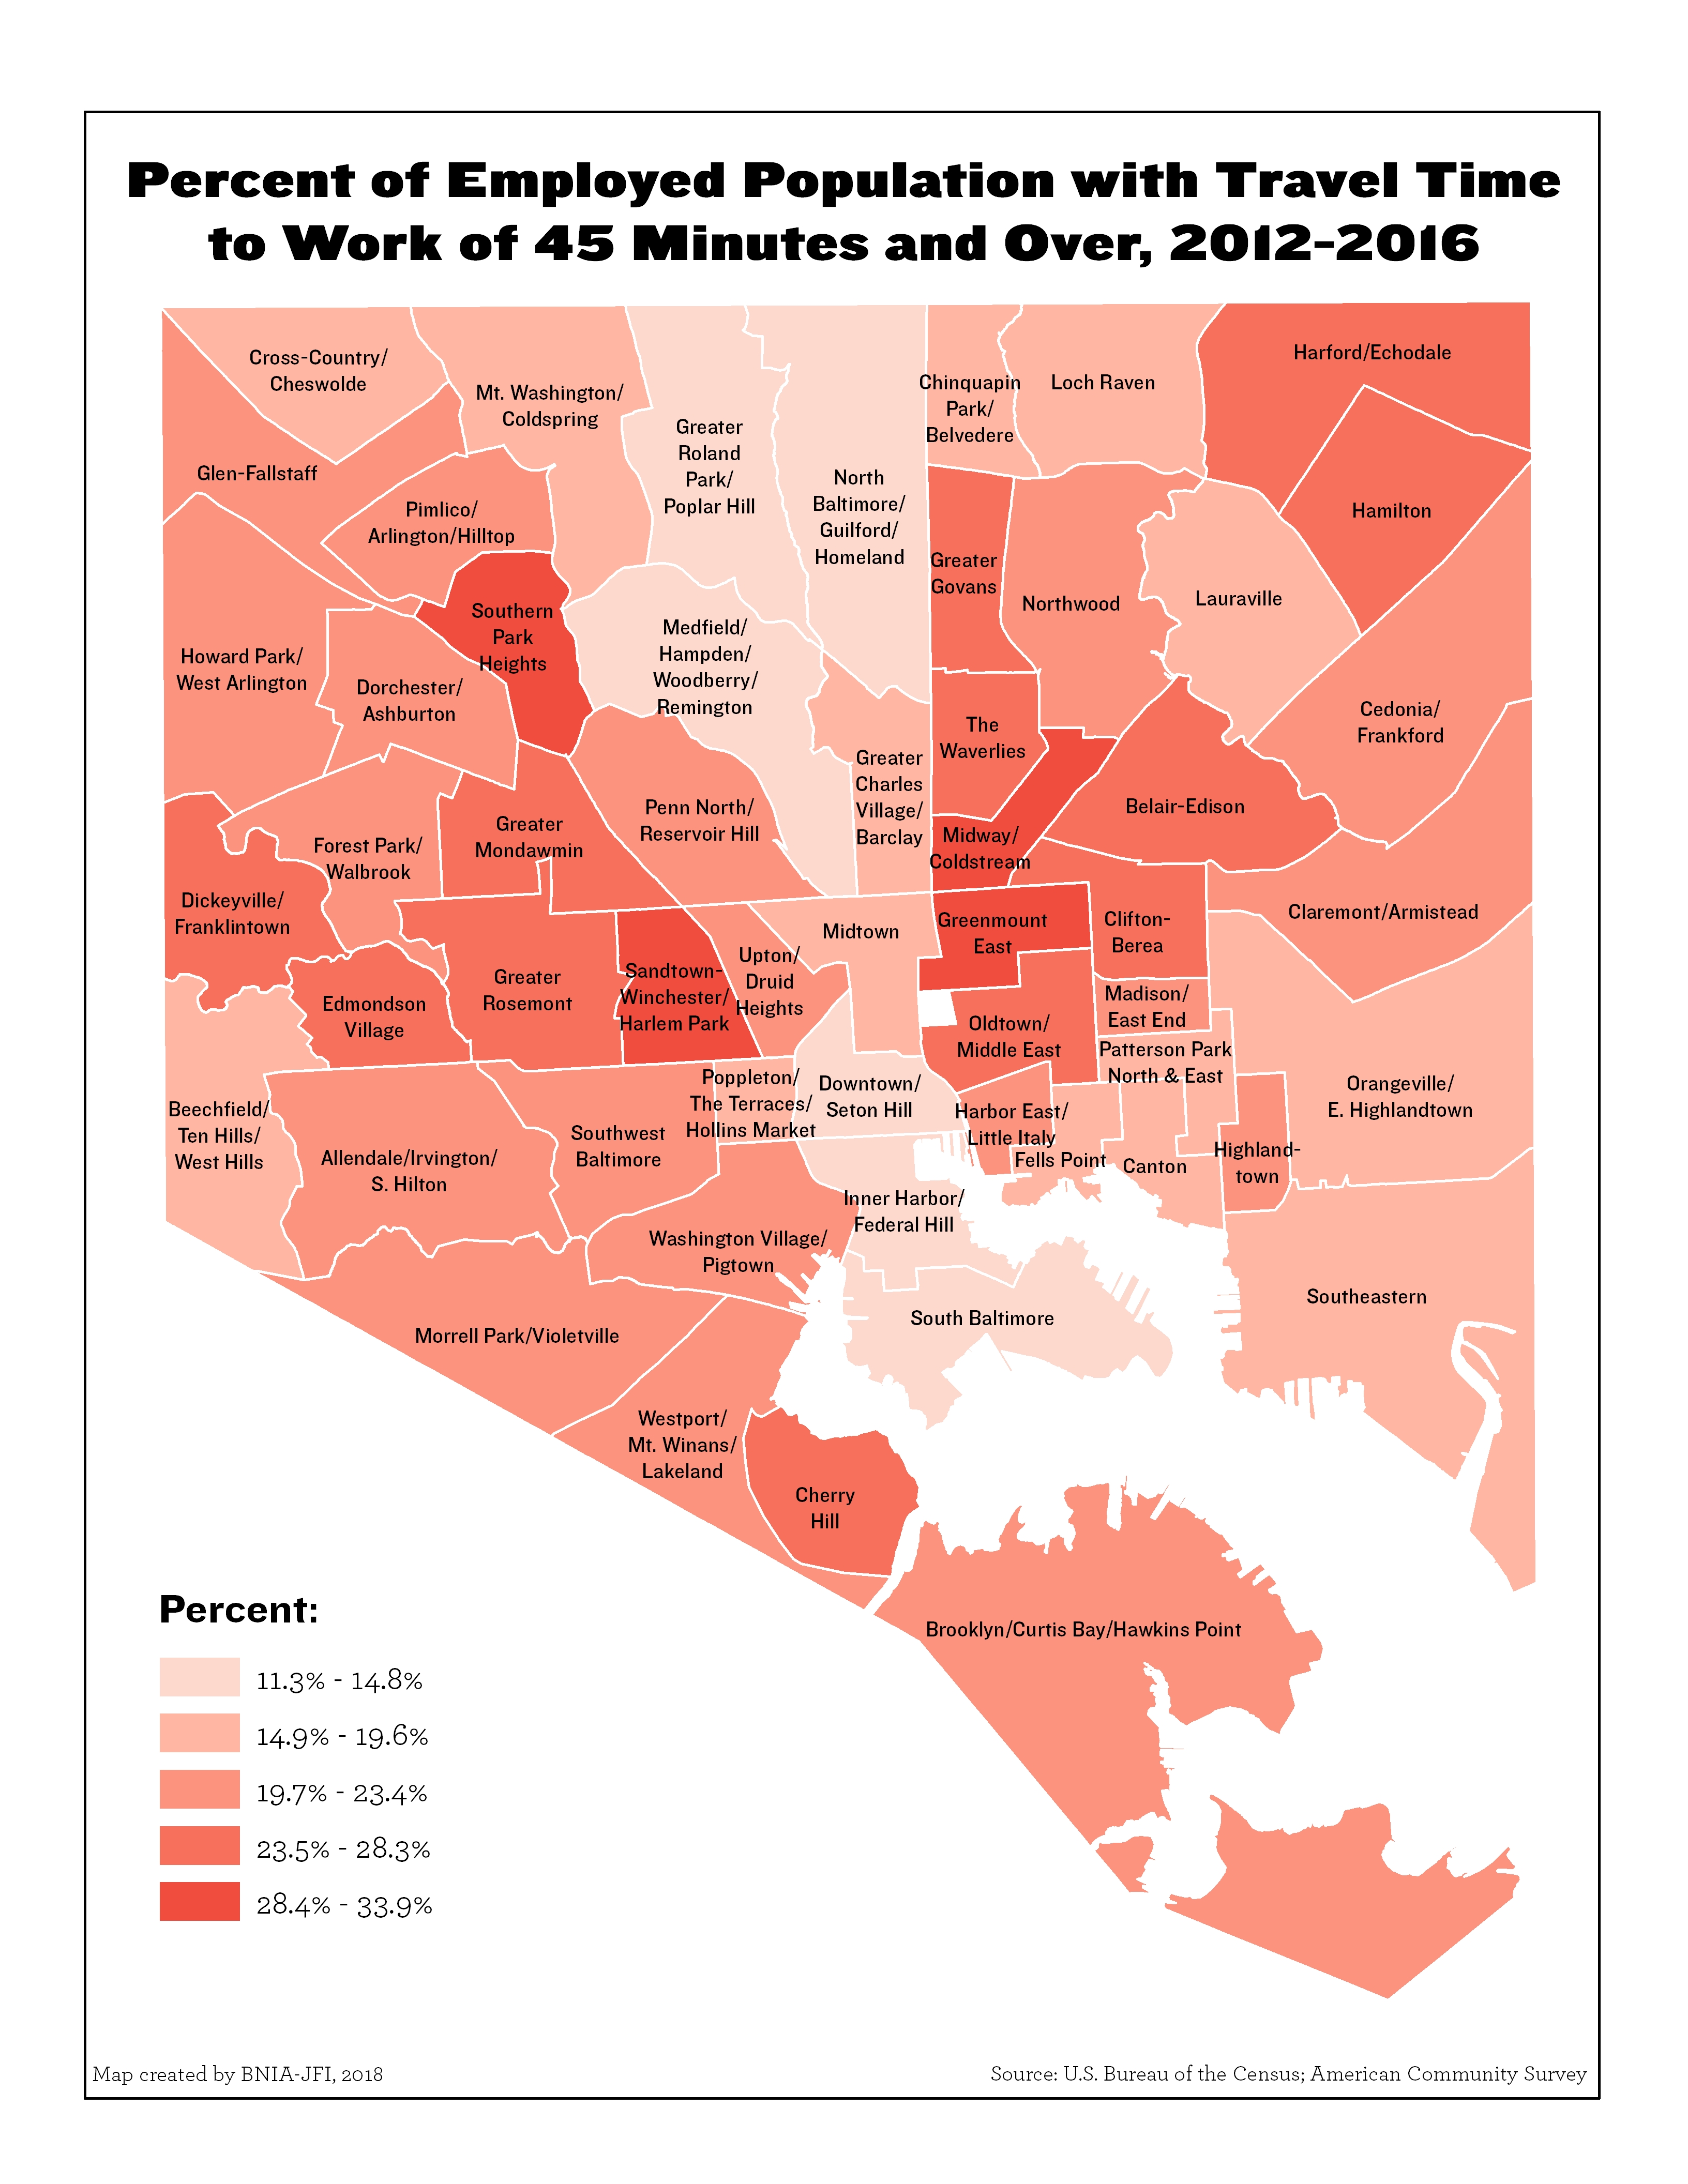
Percent of Employed Population with a Travel Time to Work of 45 Minutes or More
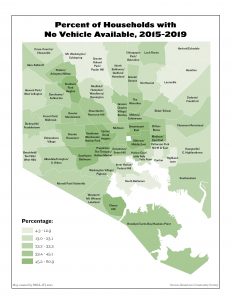
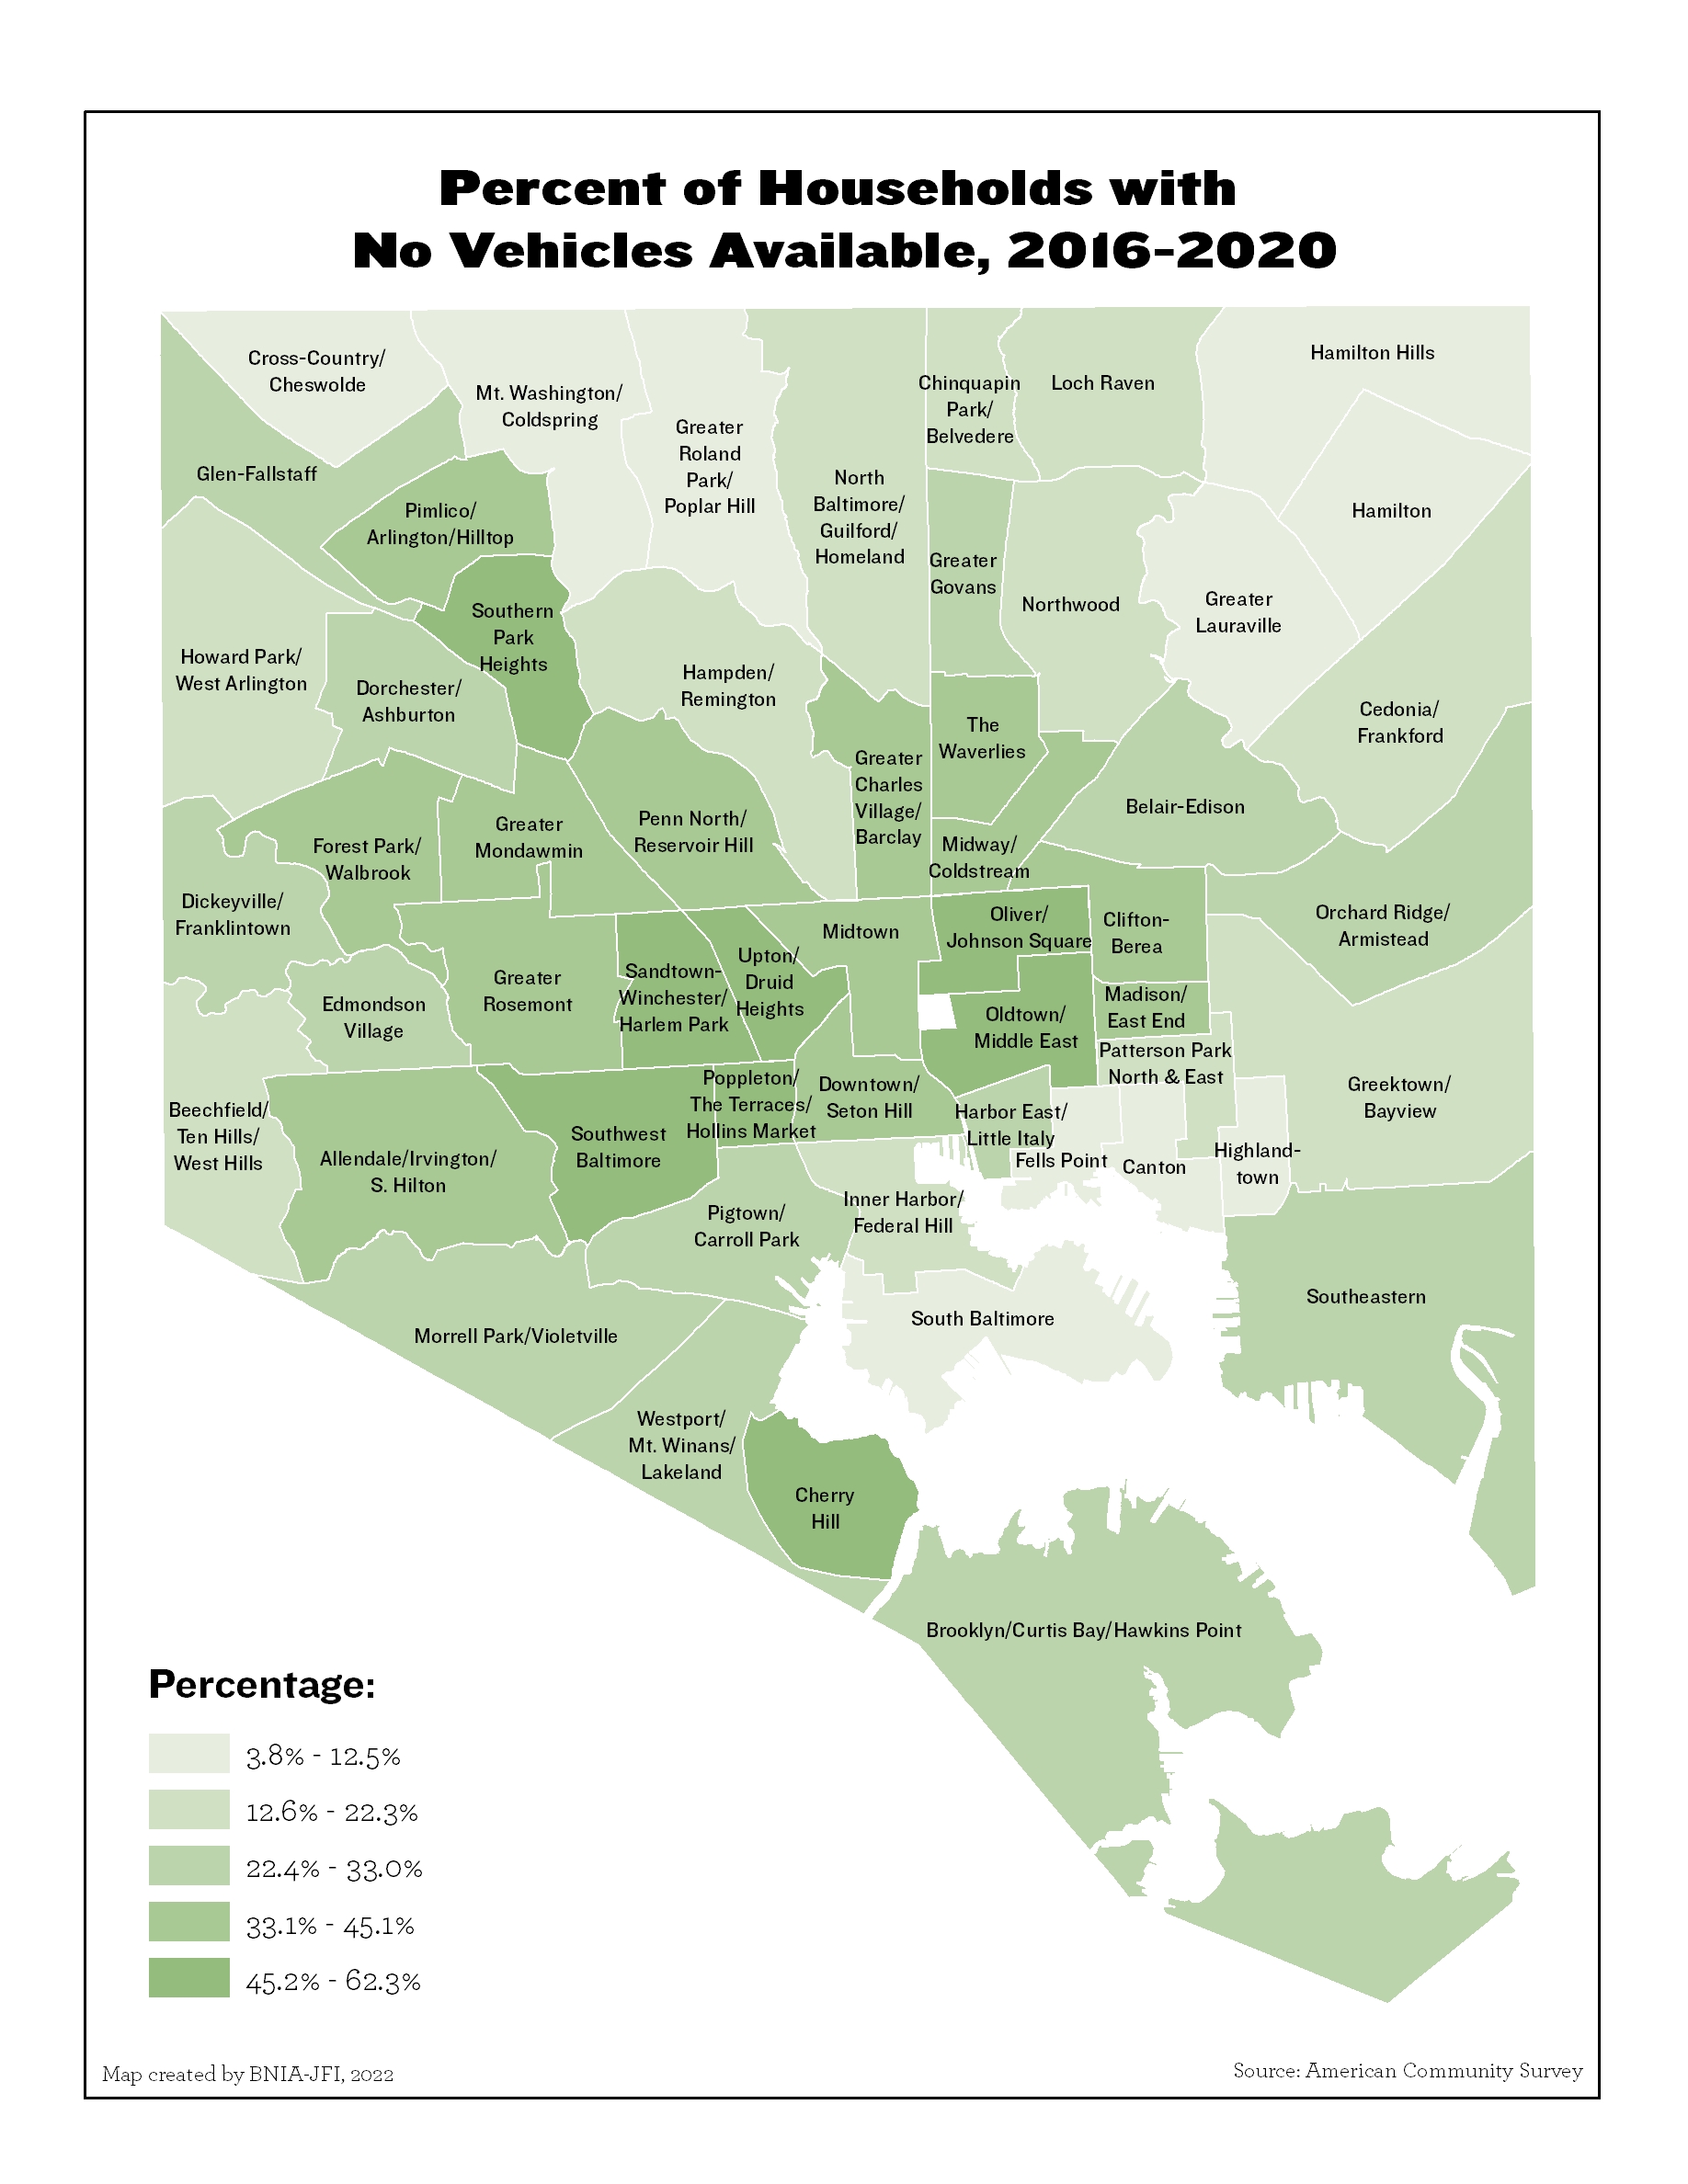
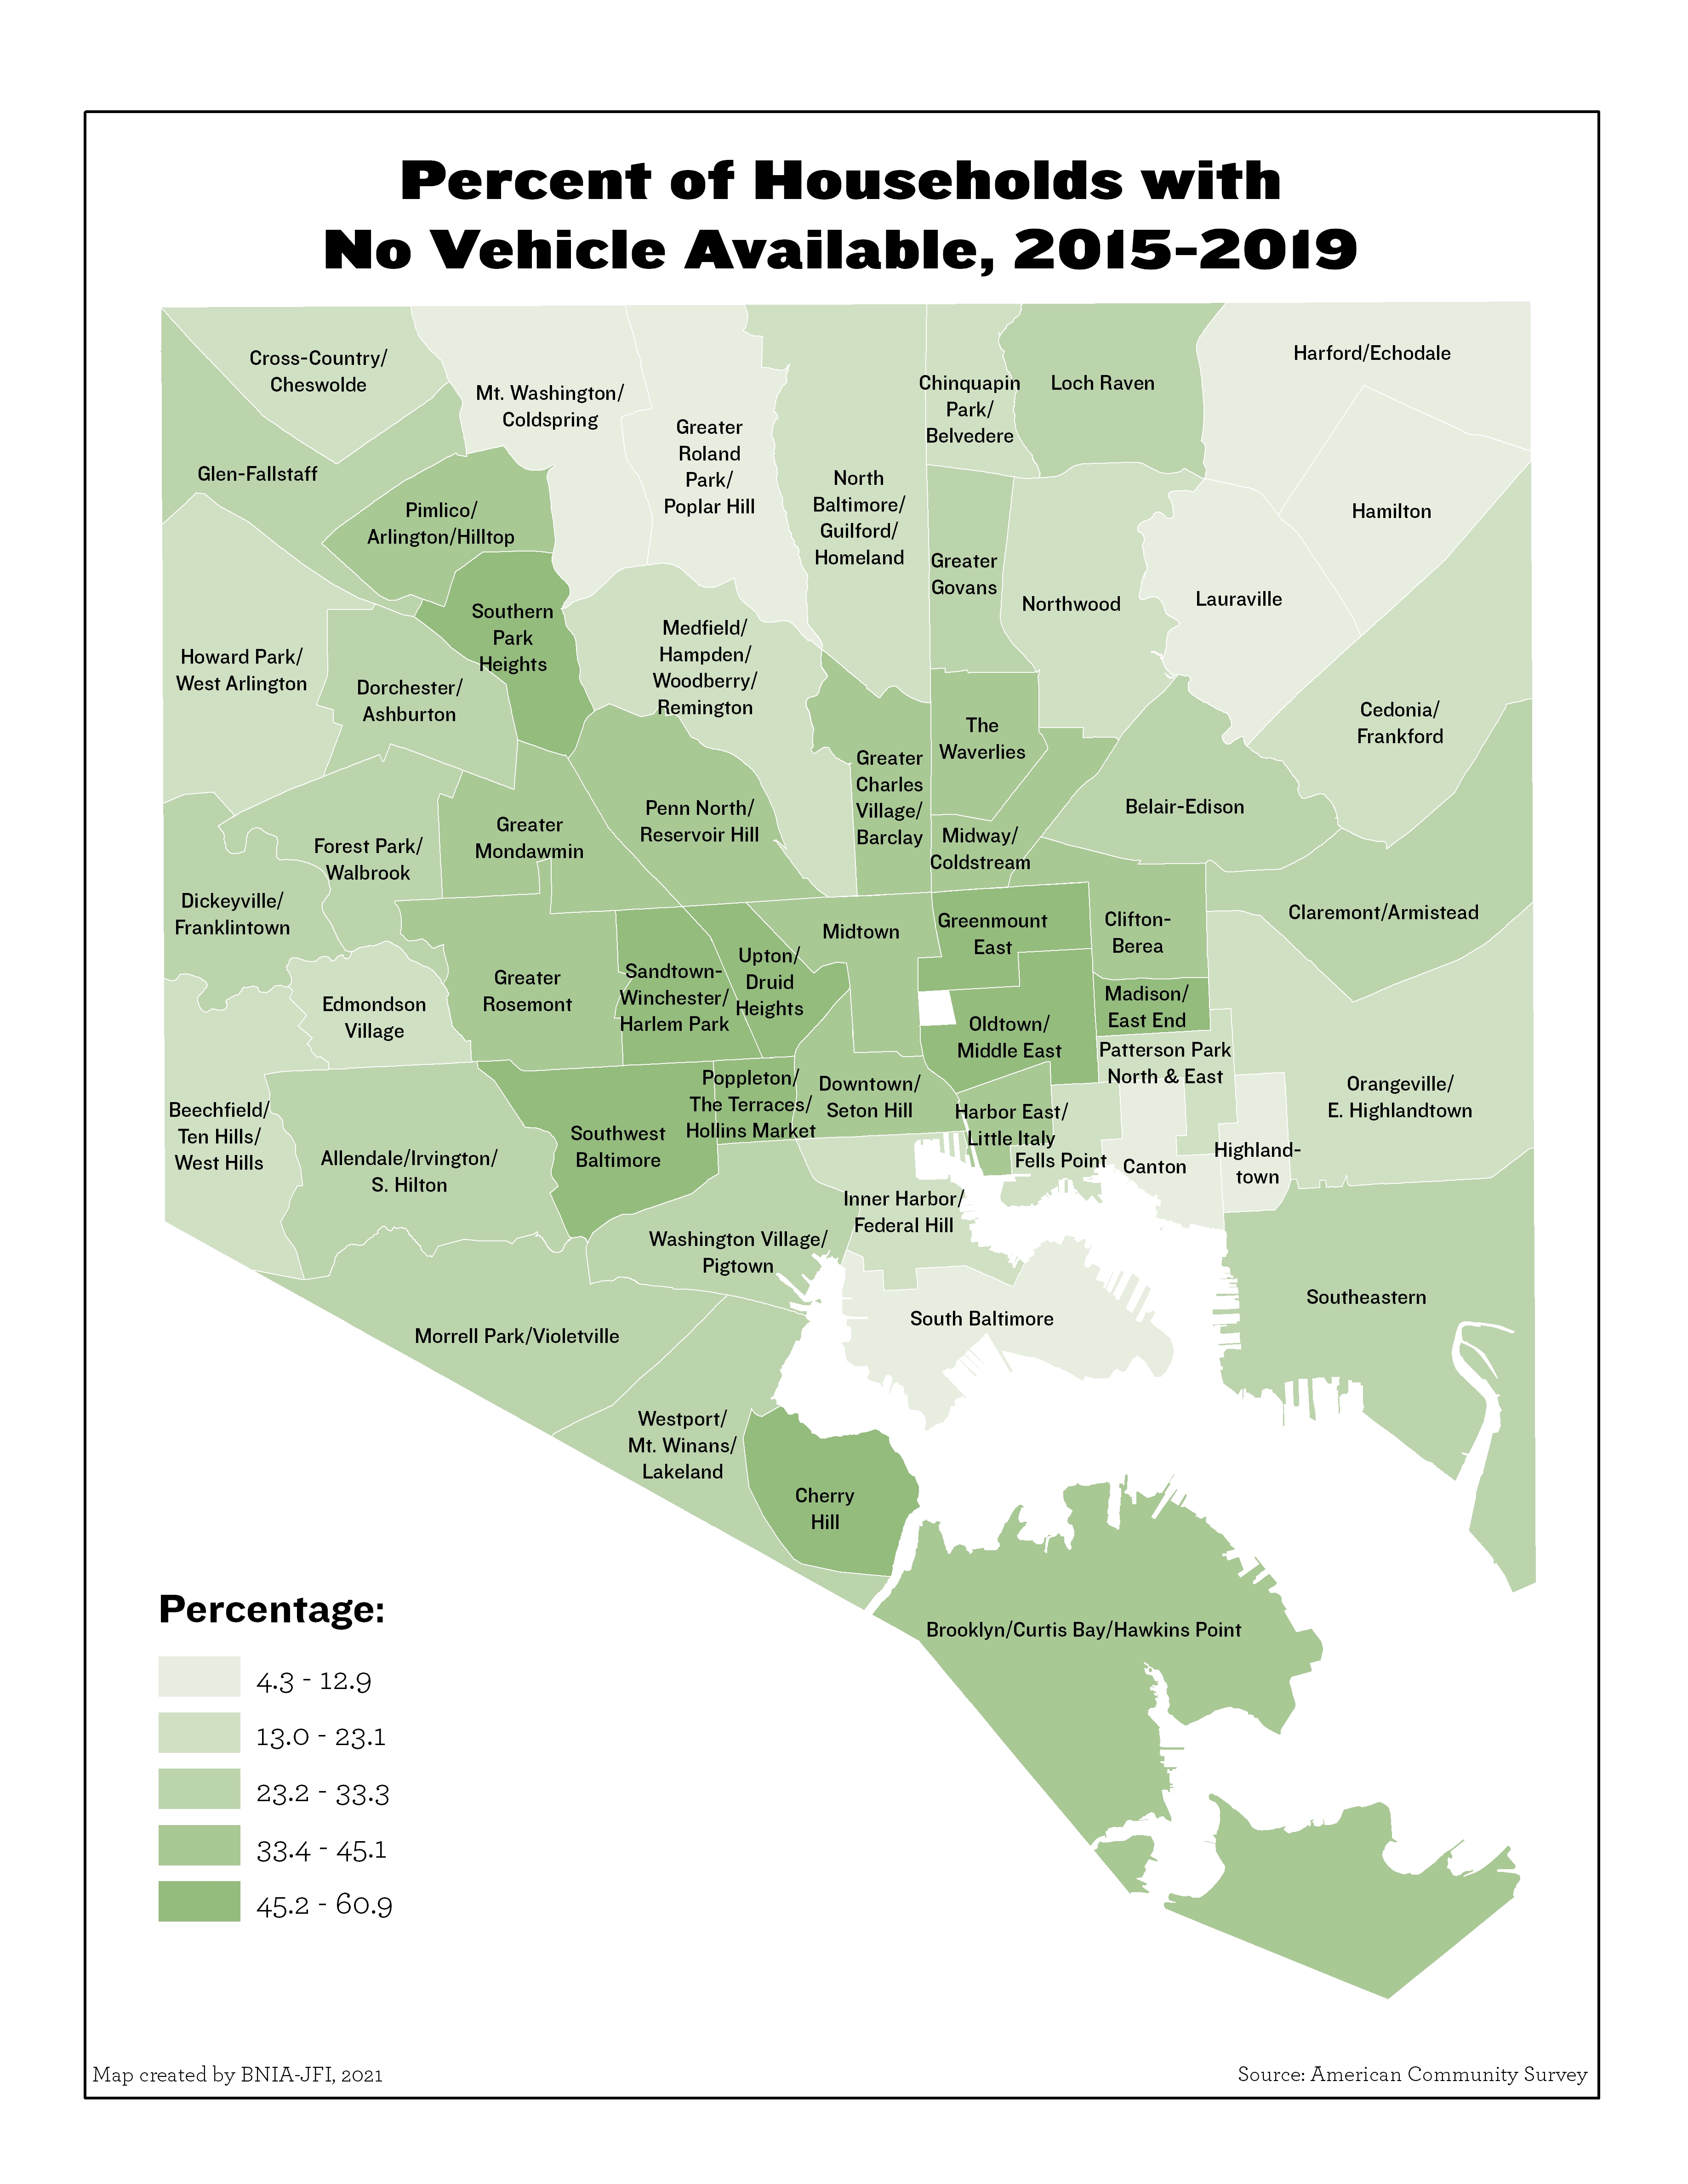
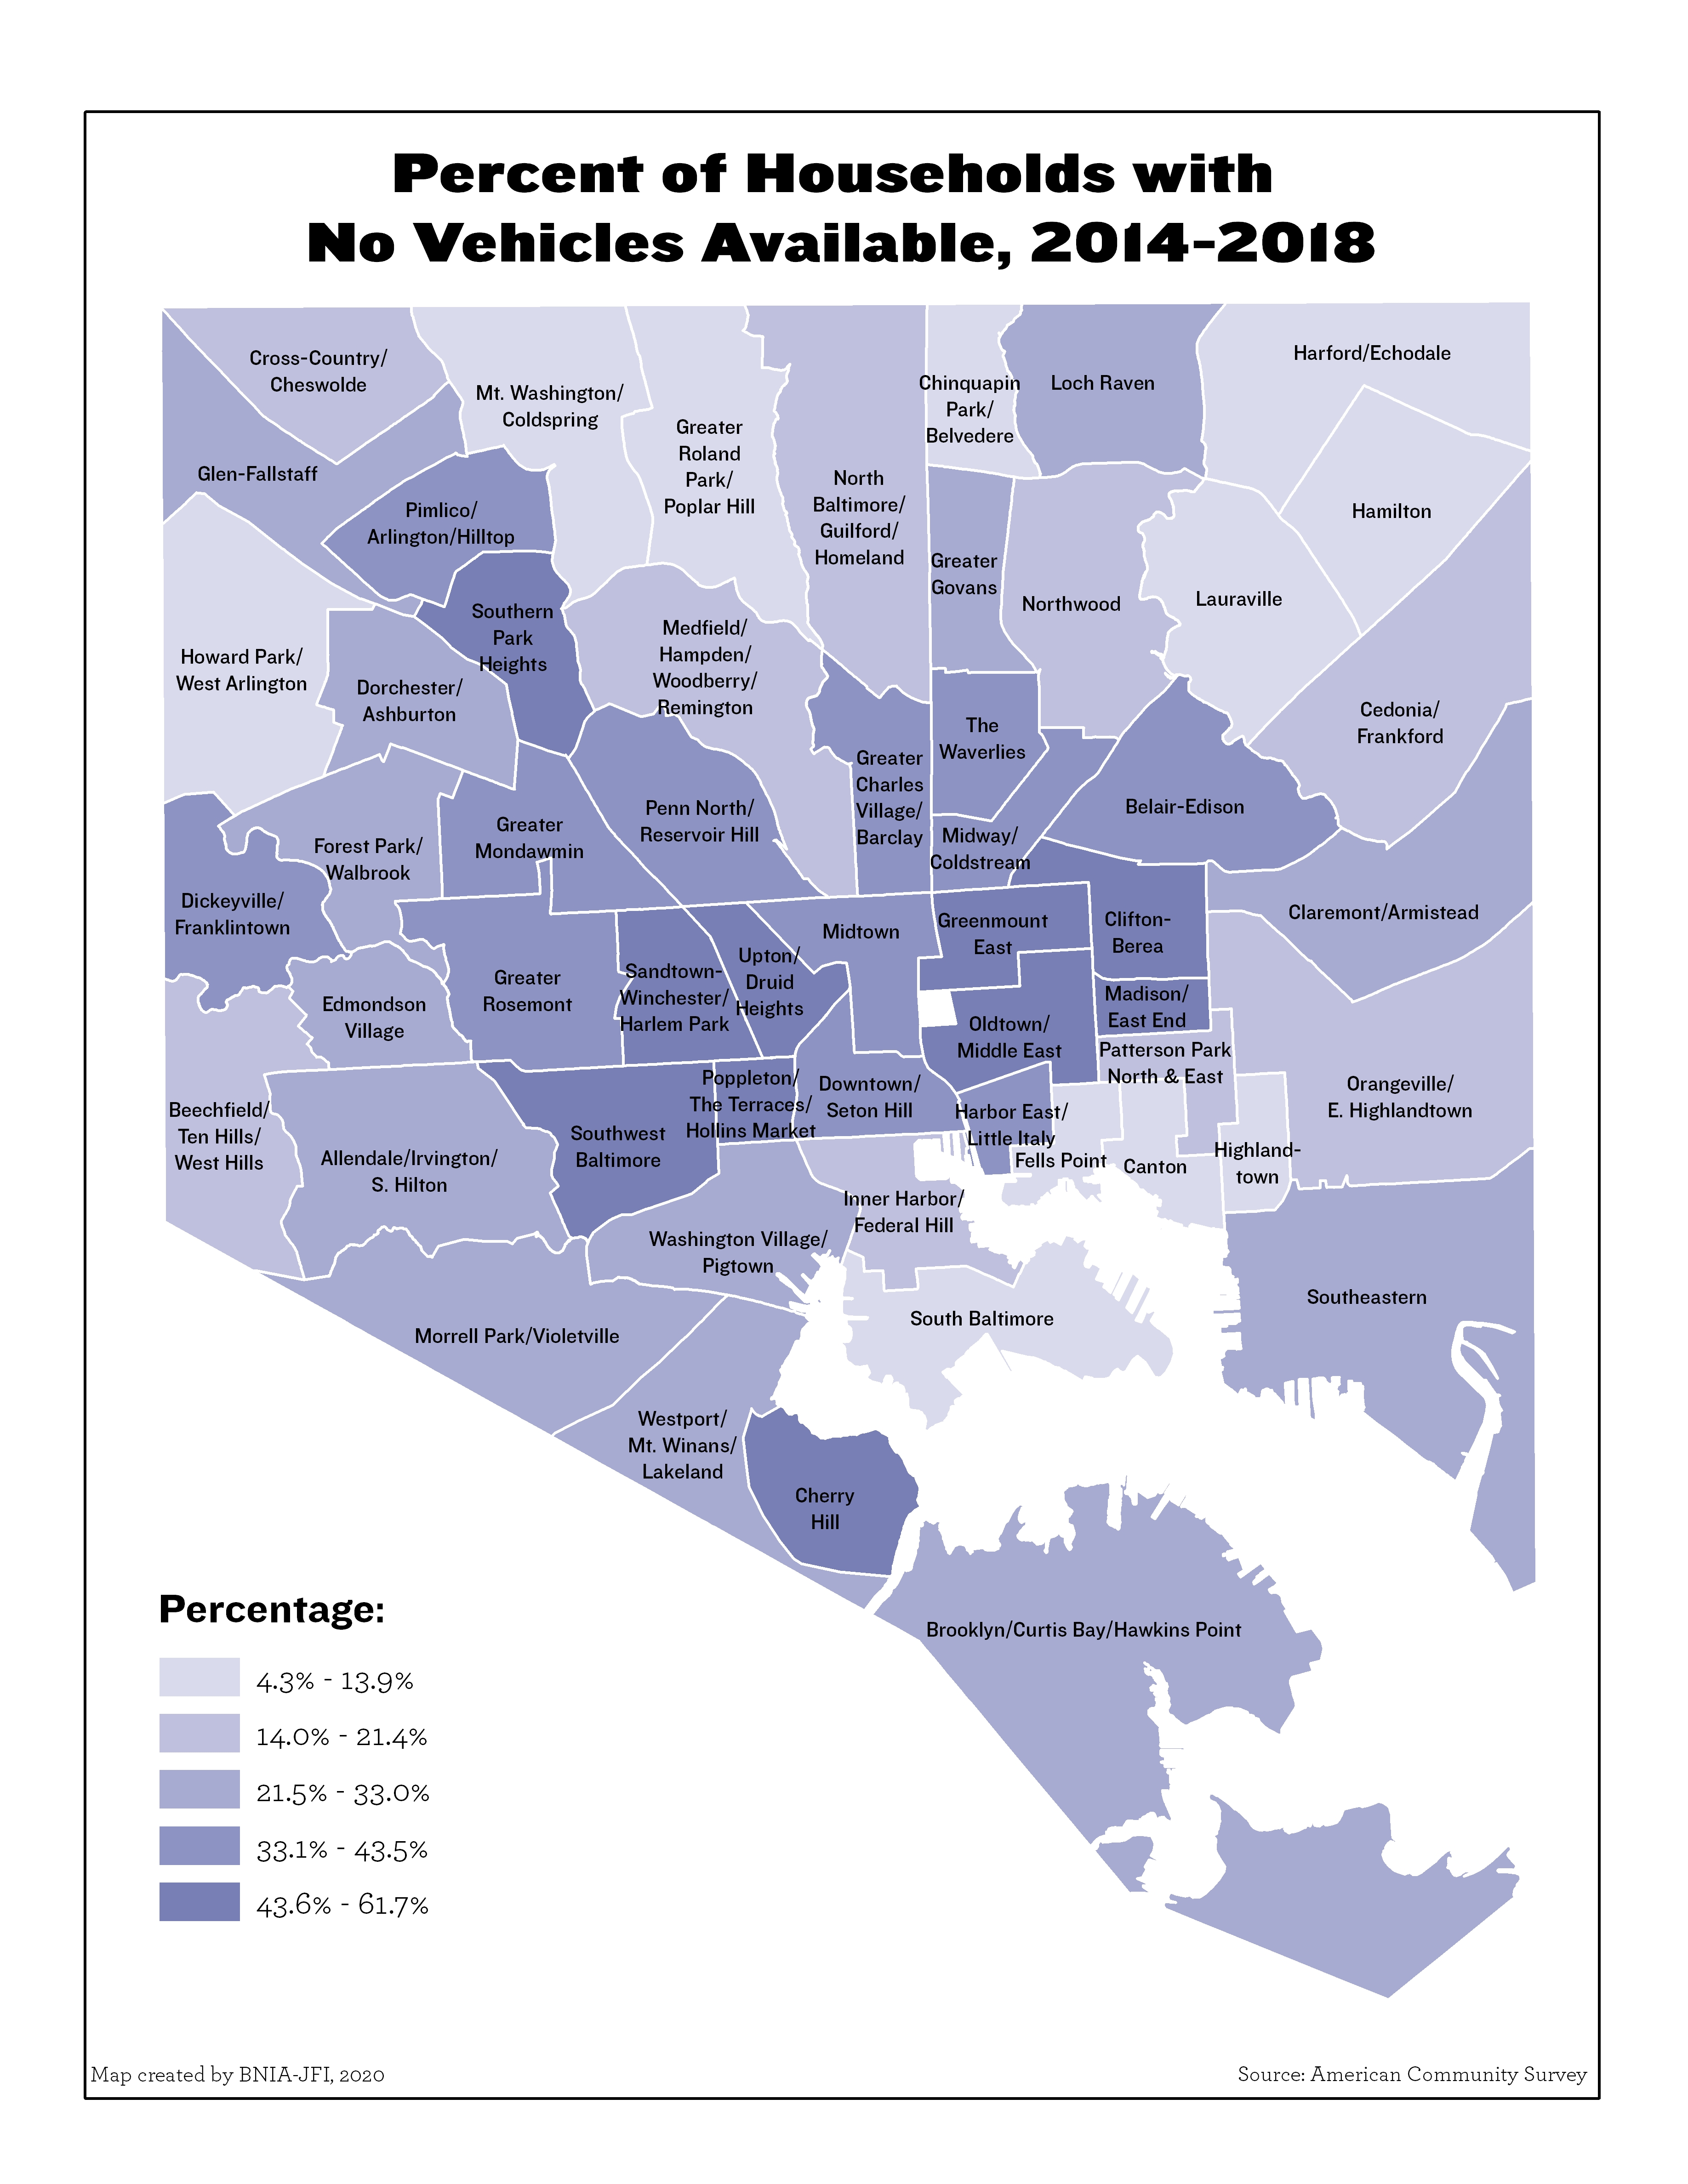
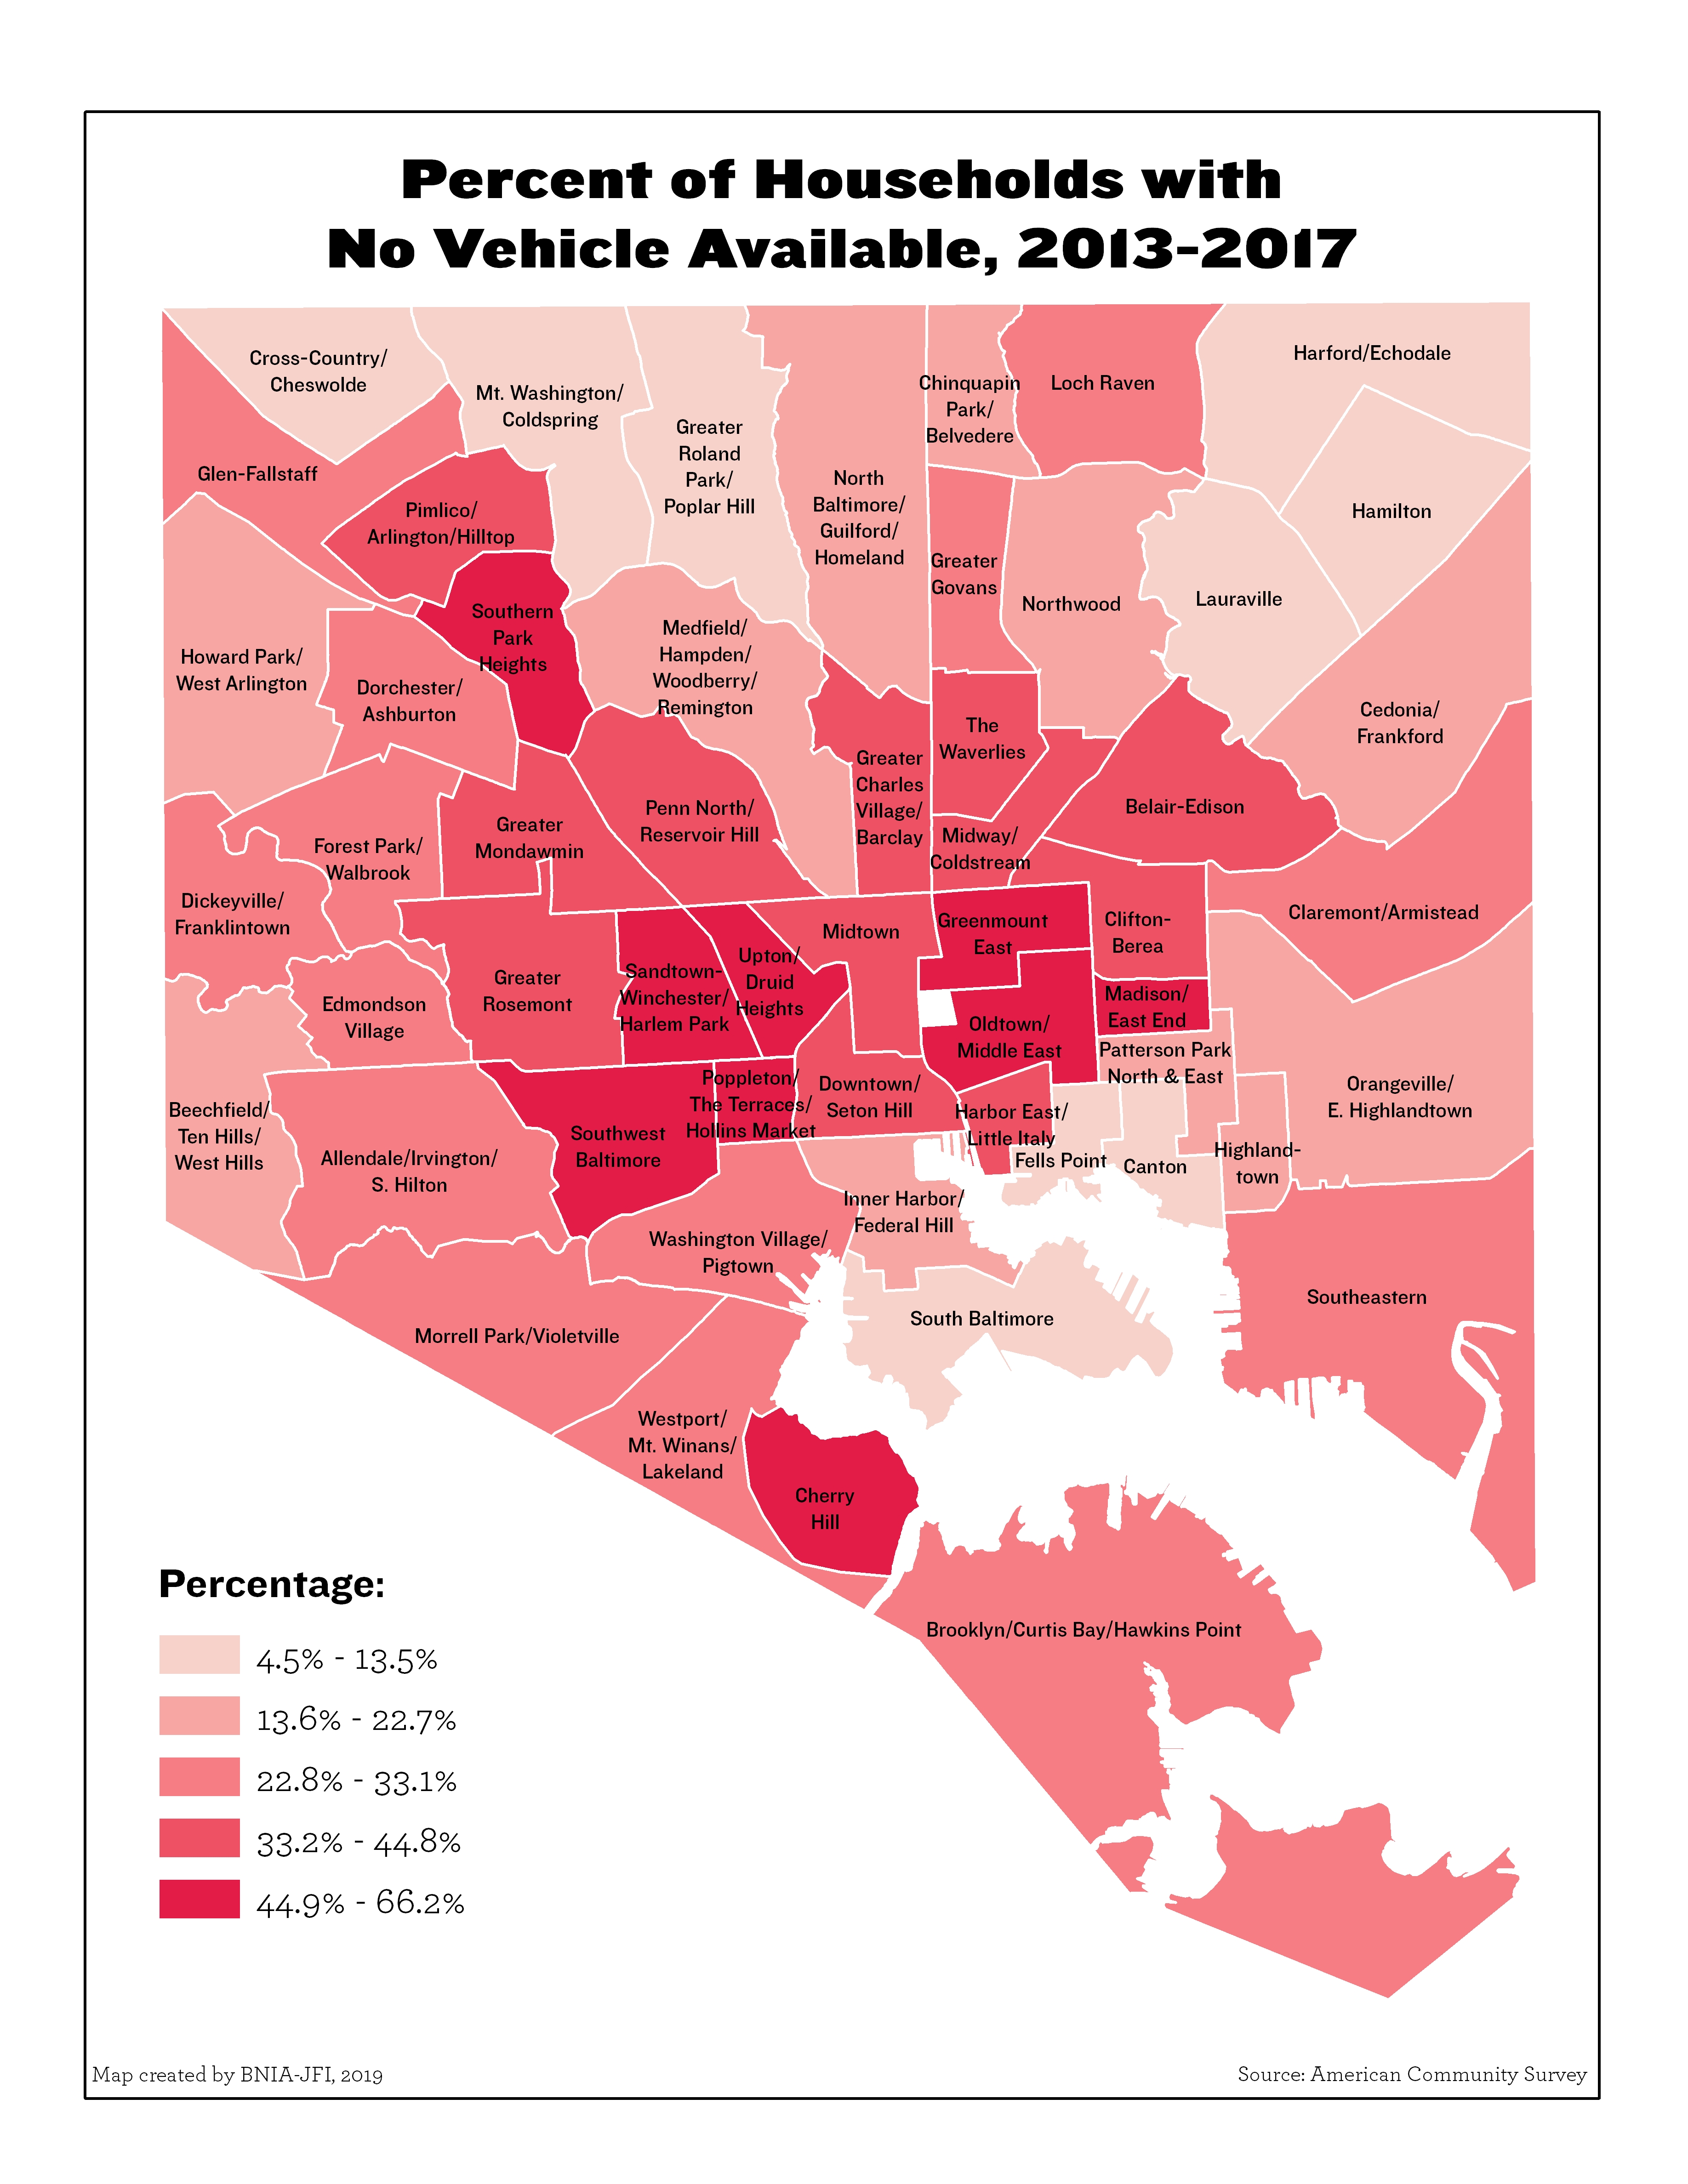
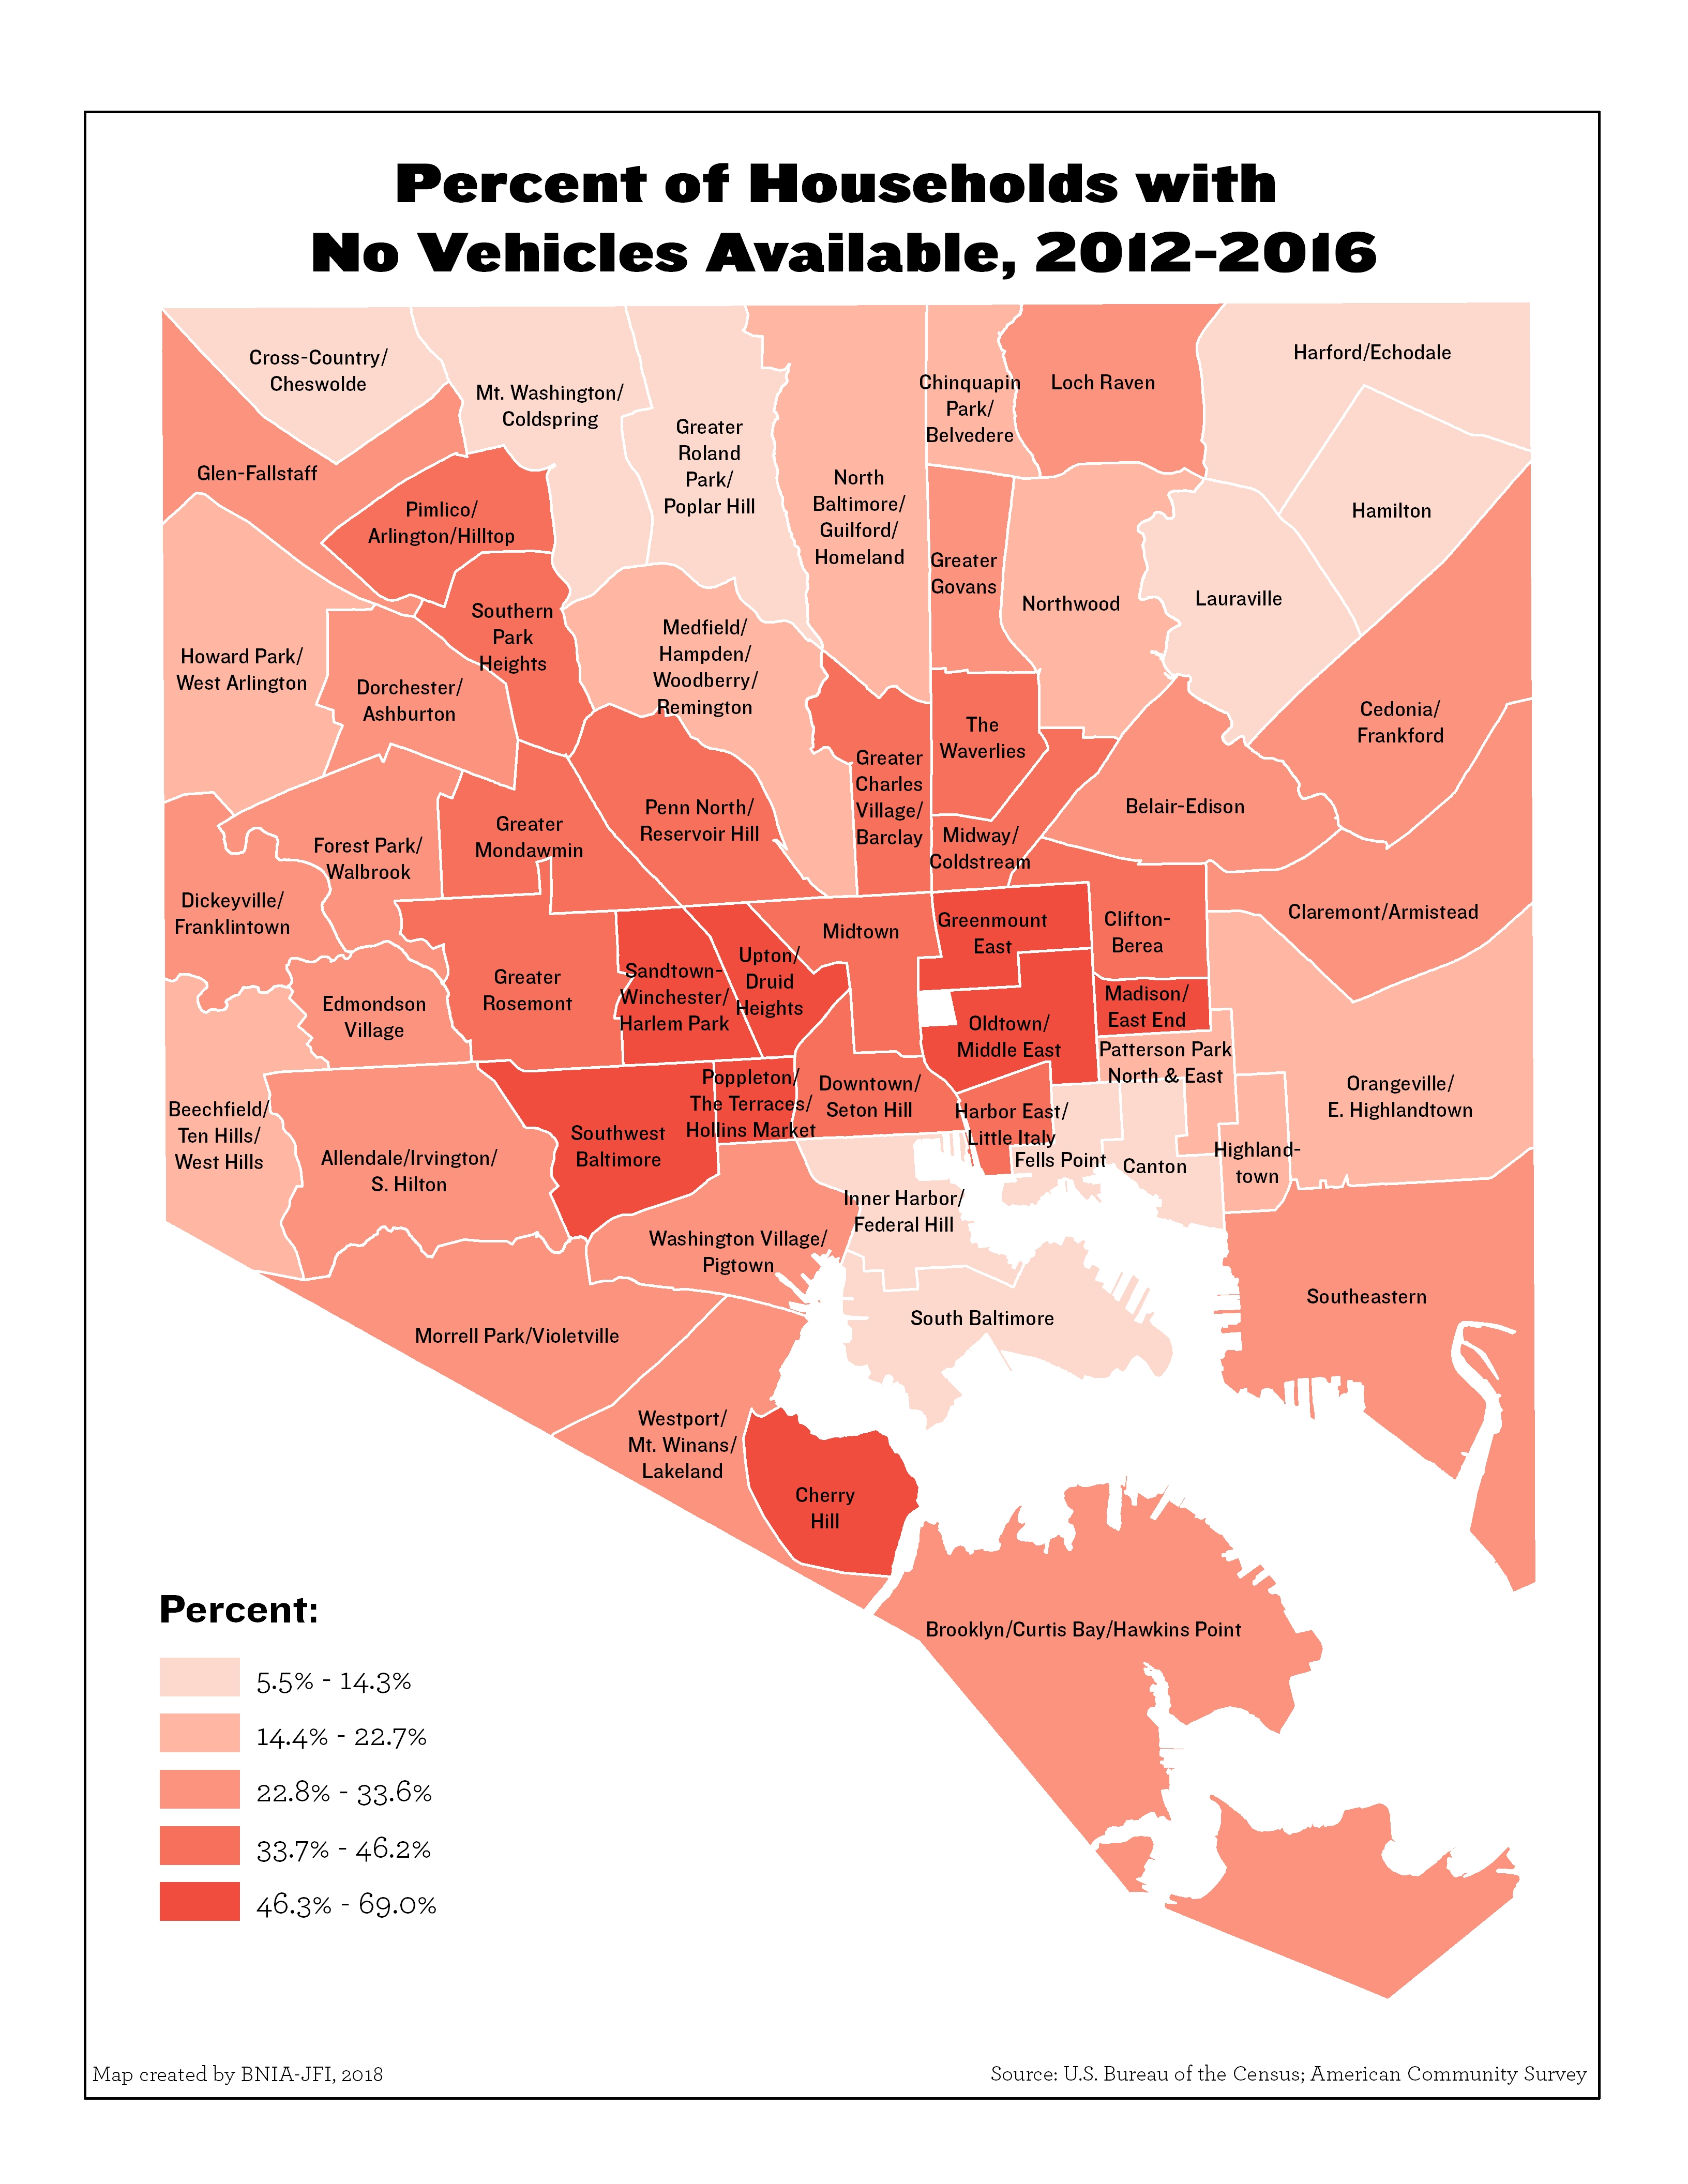
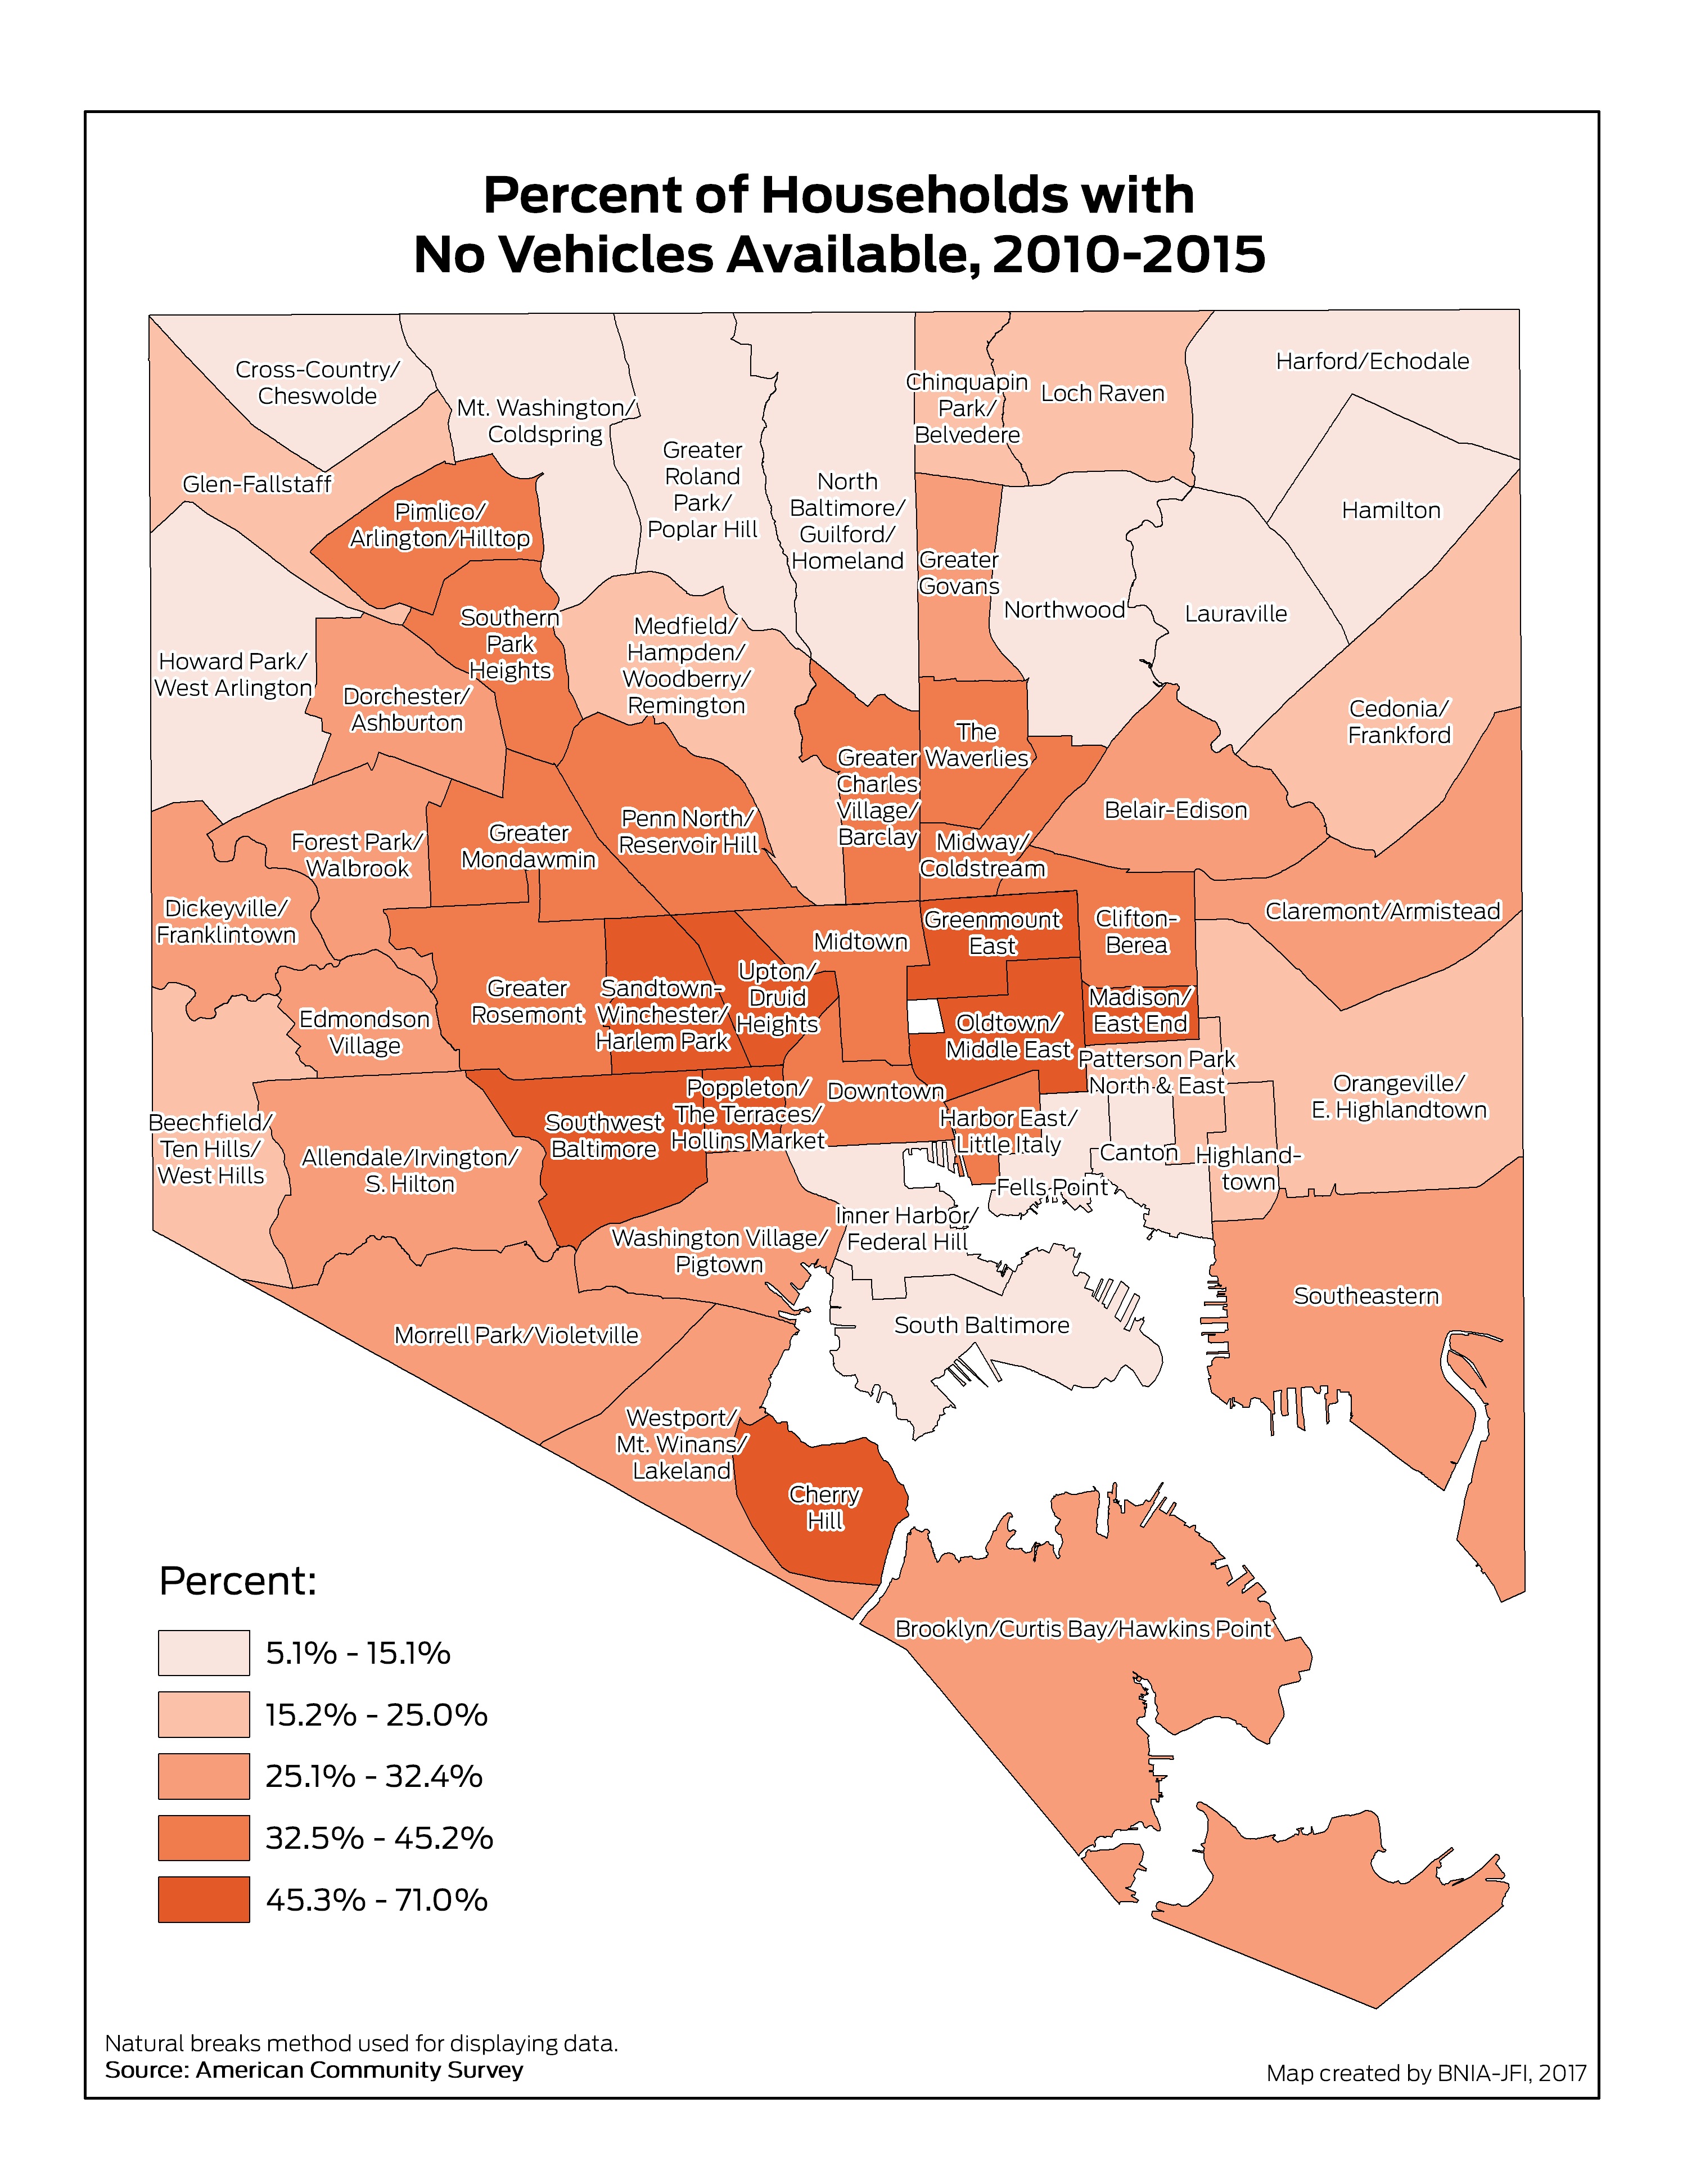
Percent of Households with No Vehicle Available
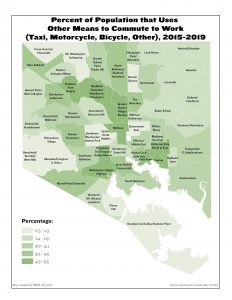
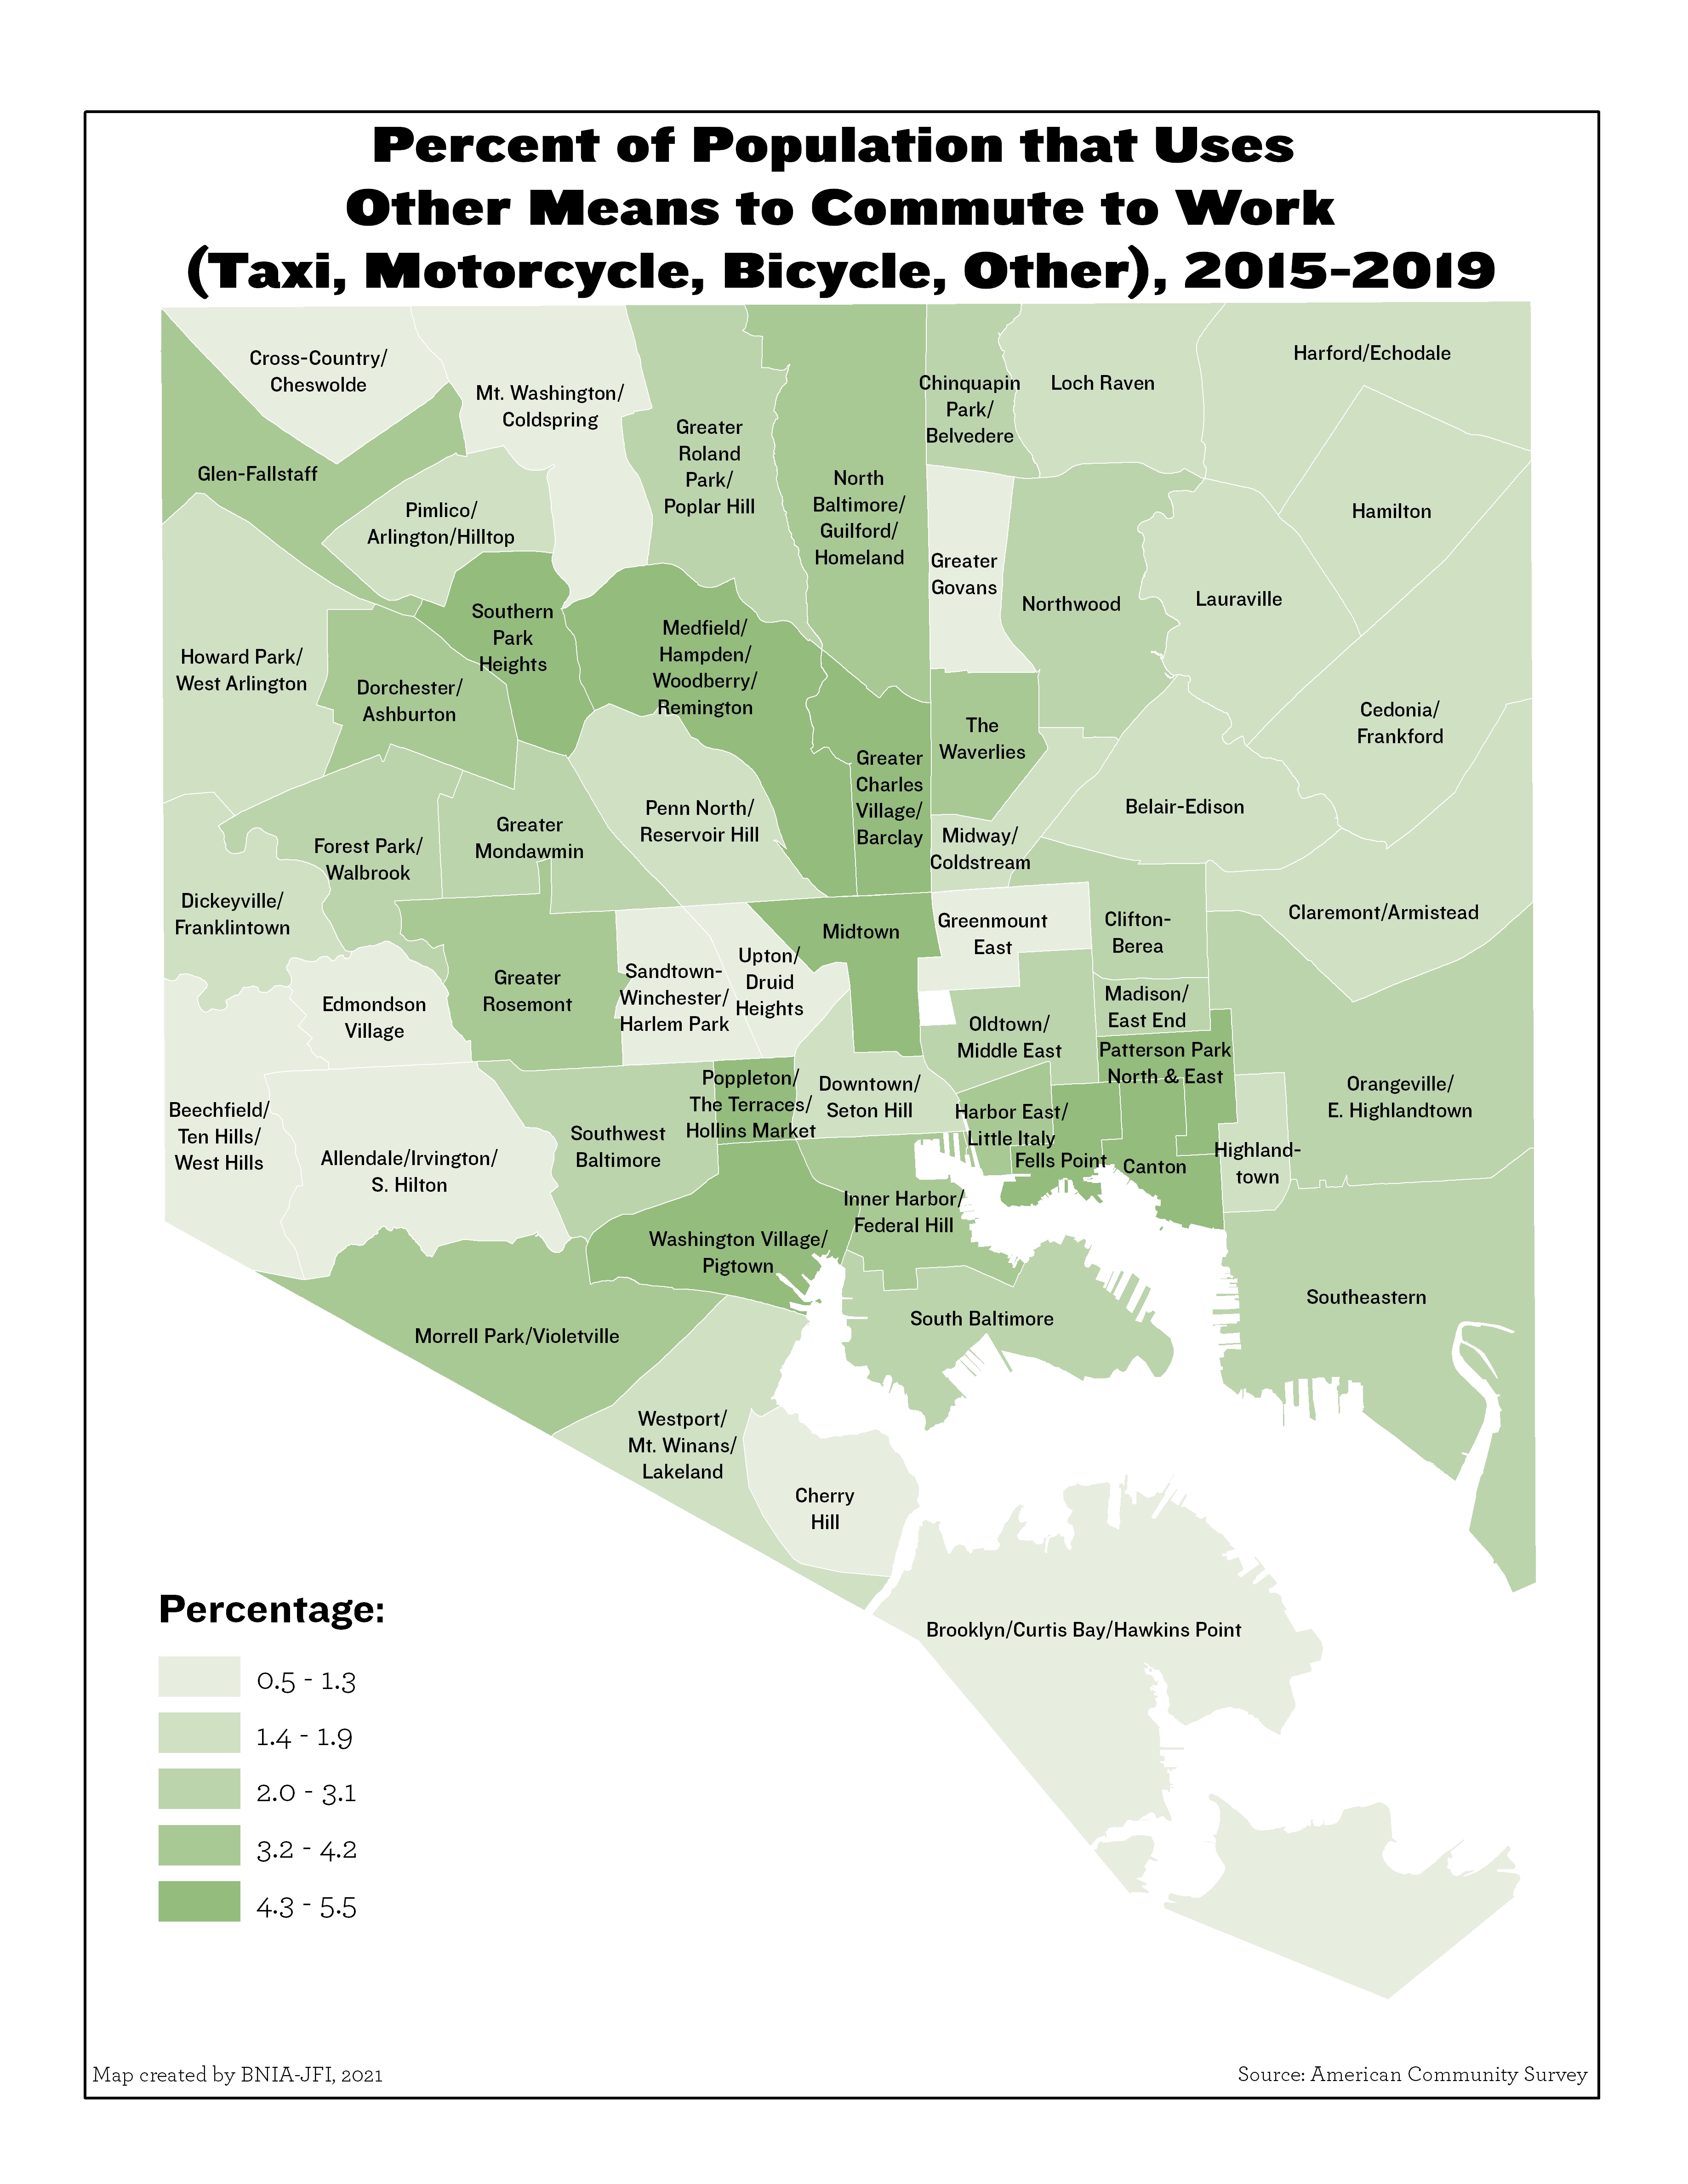
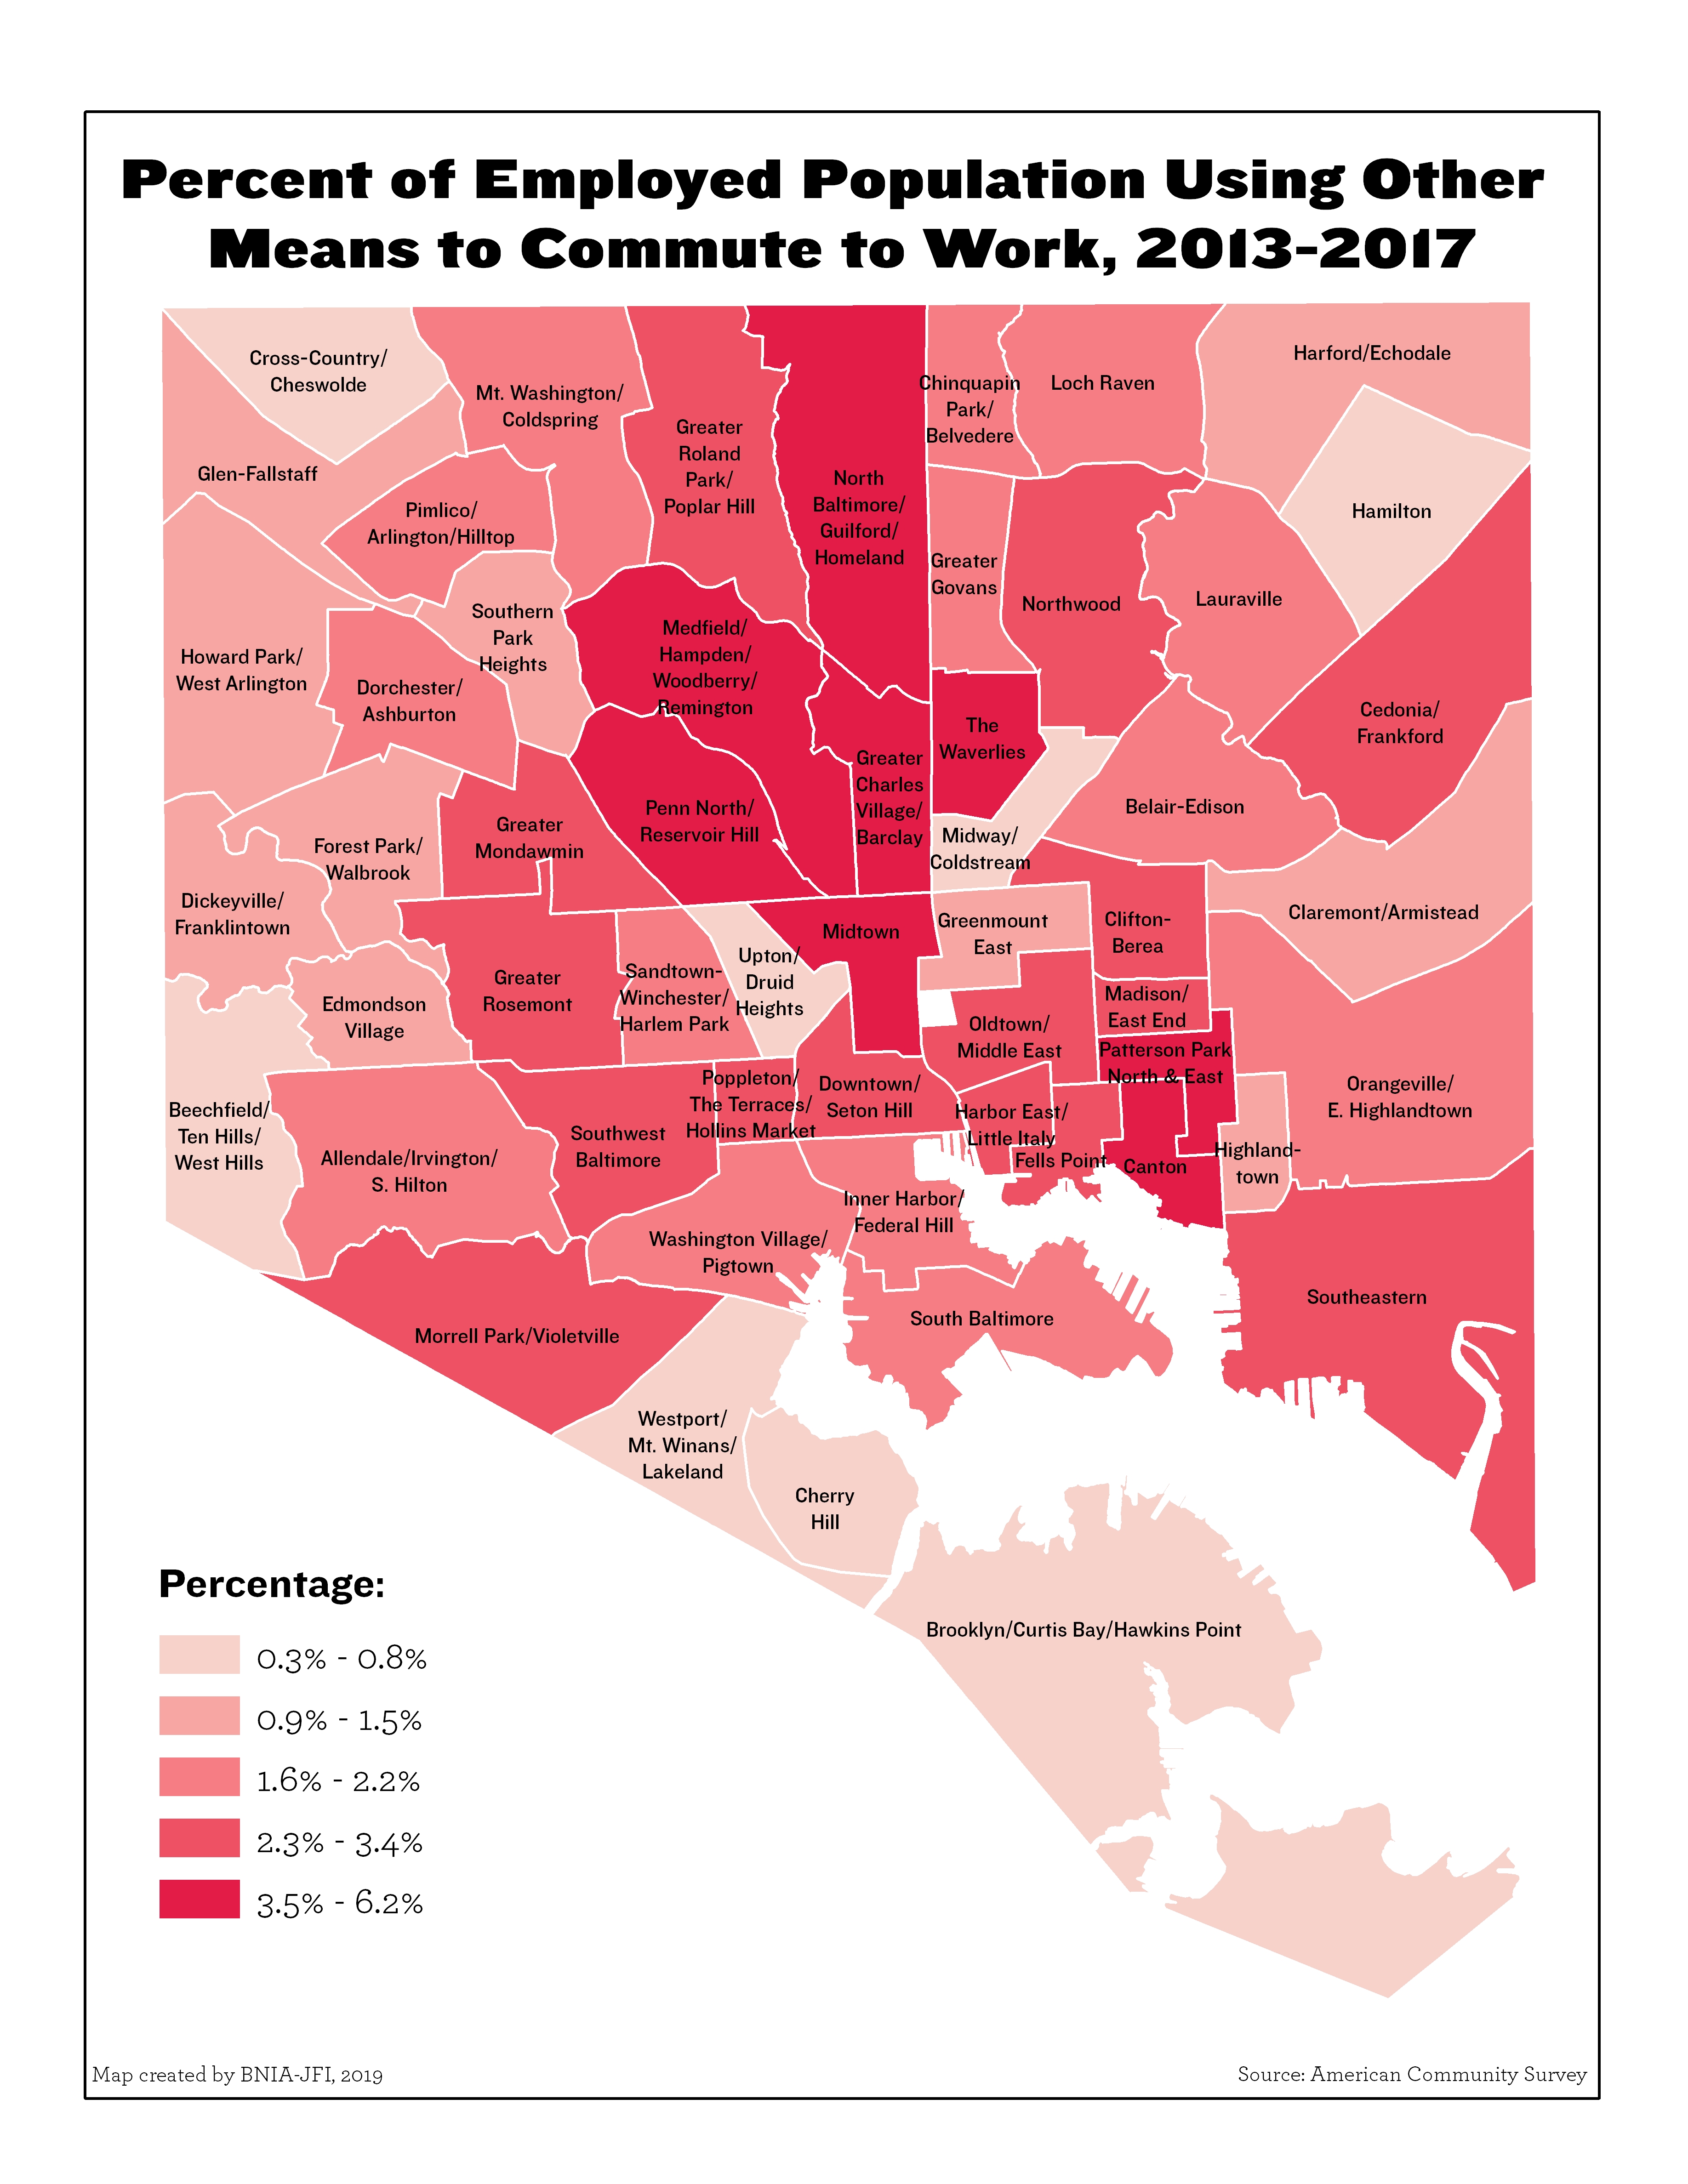
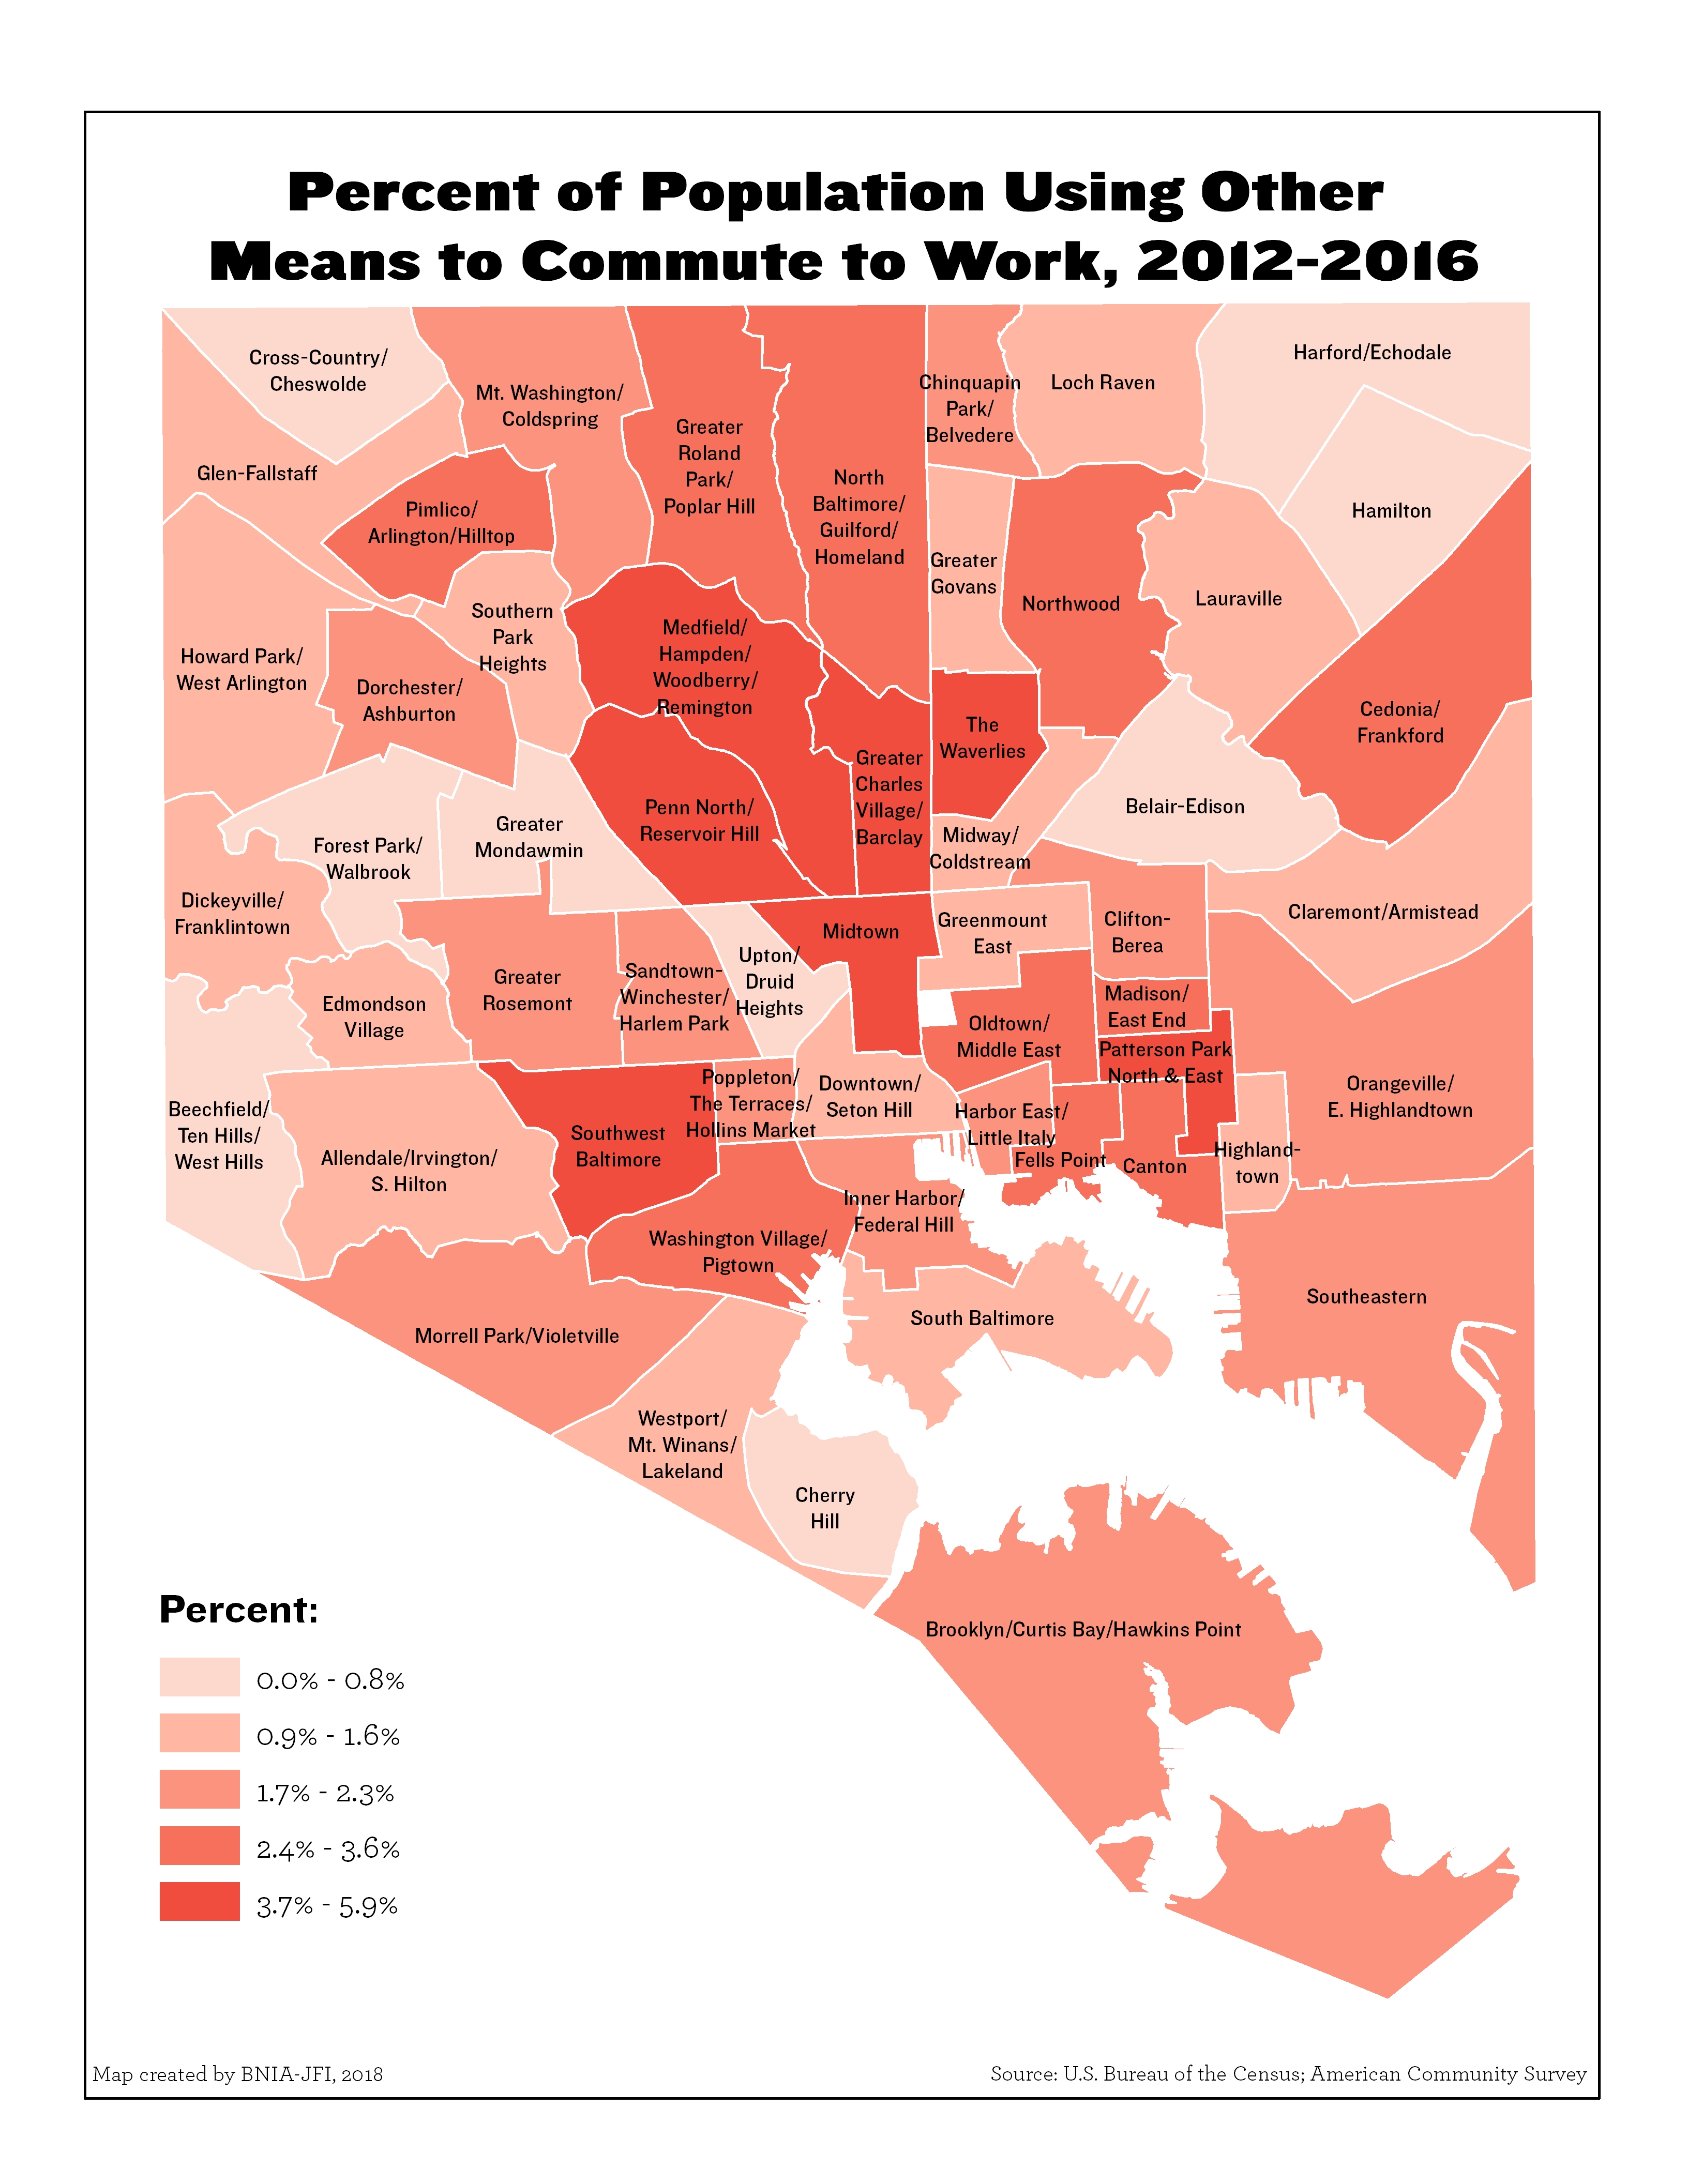
Percent of Population that Uses Other Means to Commute to Work (Taxi, Motorcycle, Bicycle, Other)
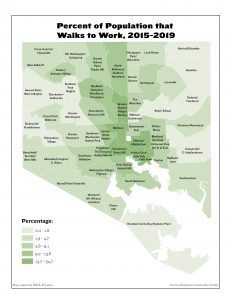
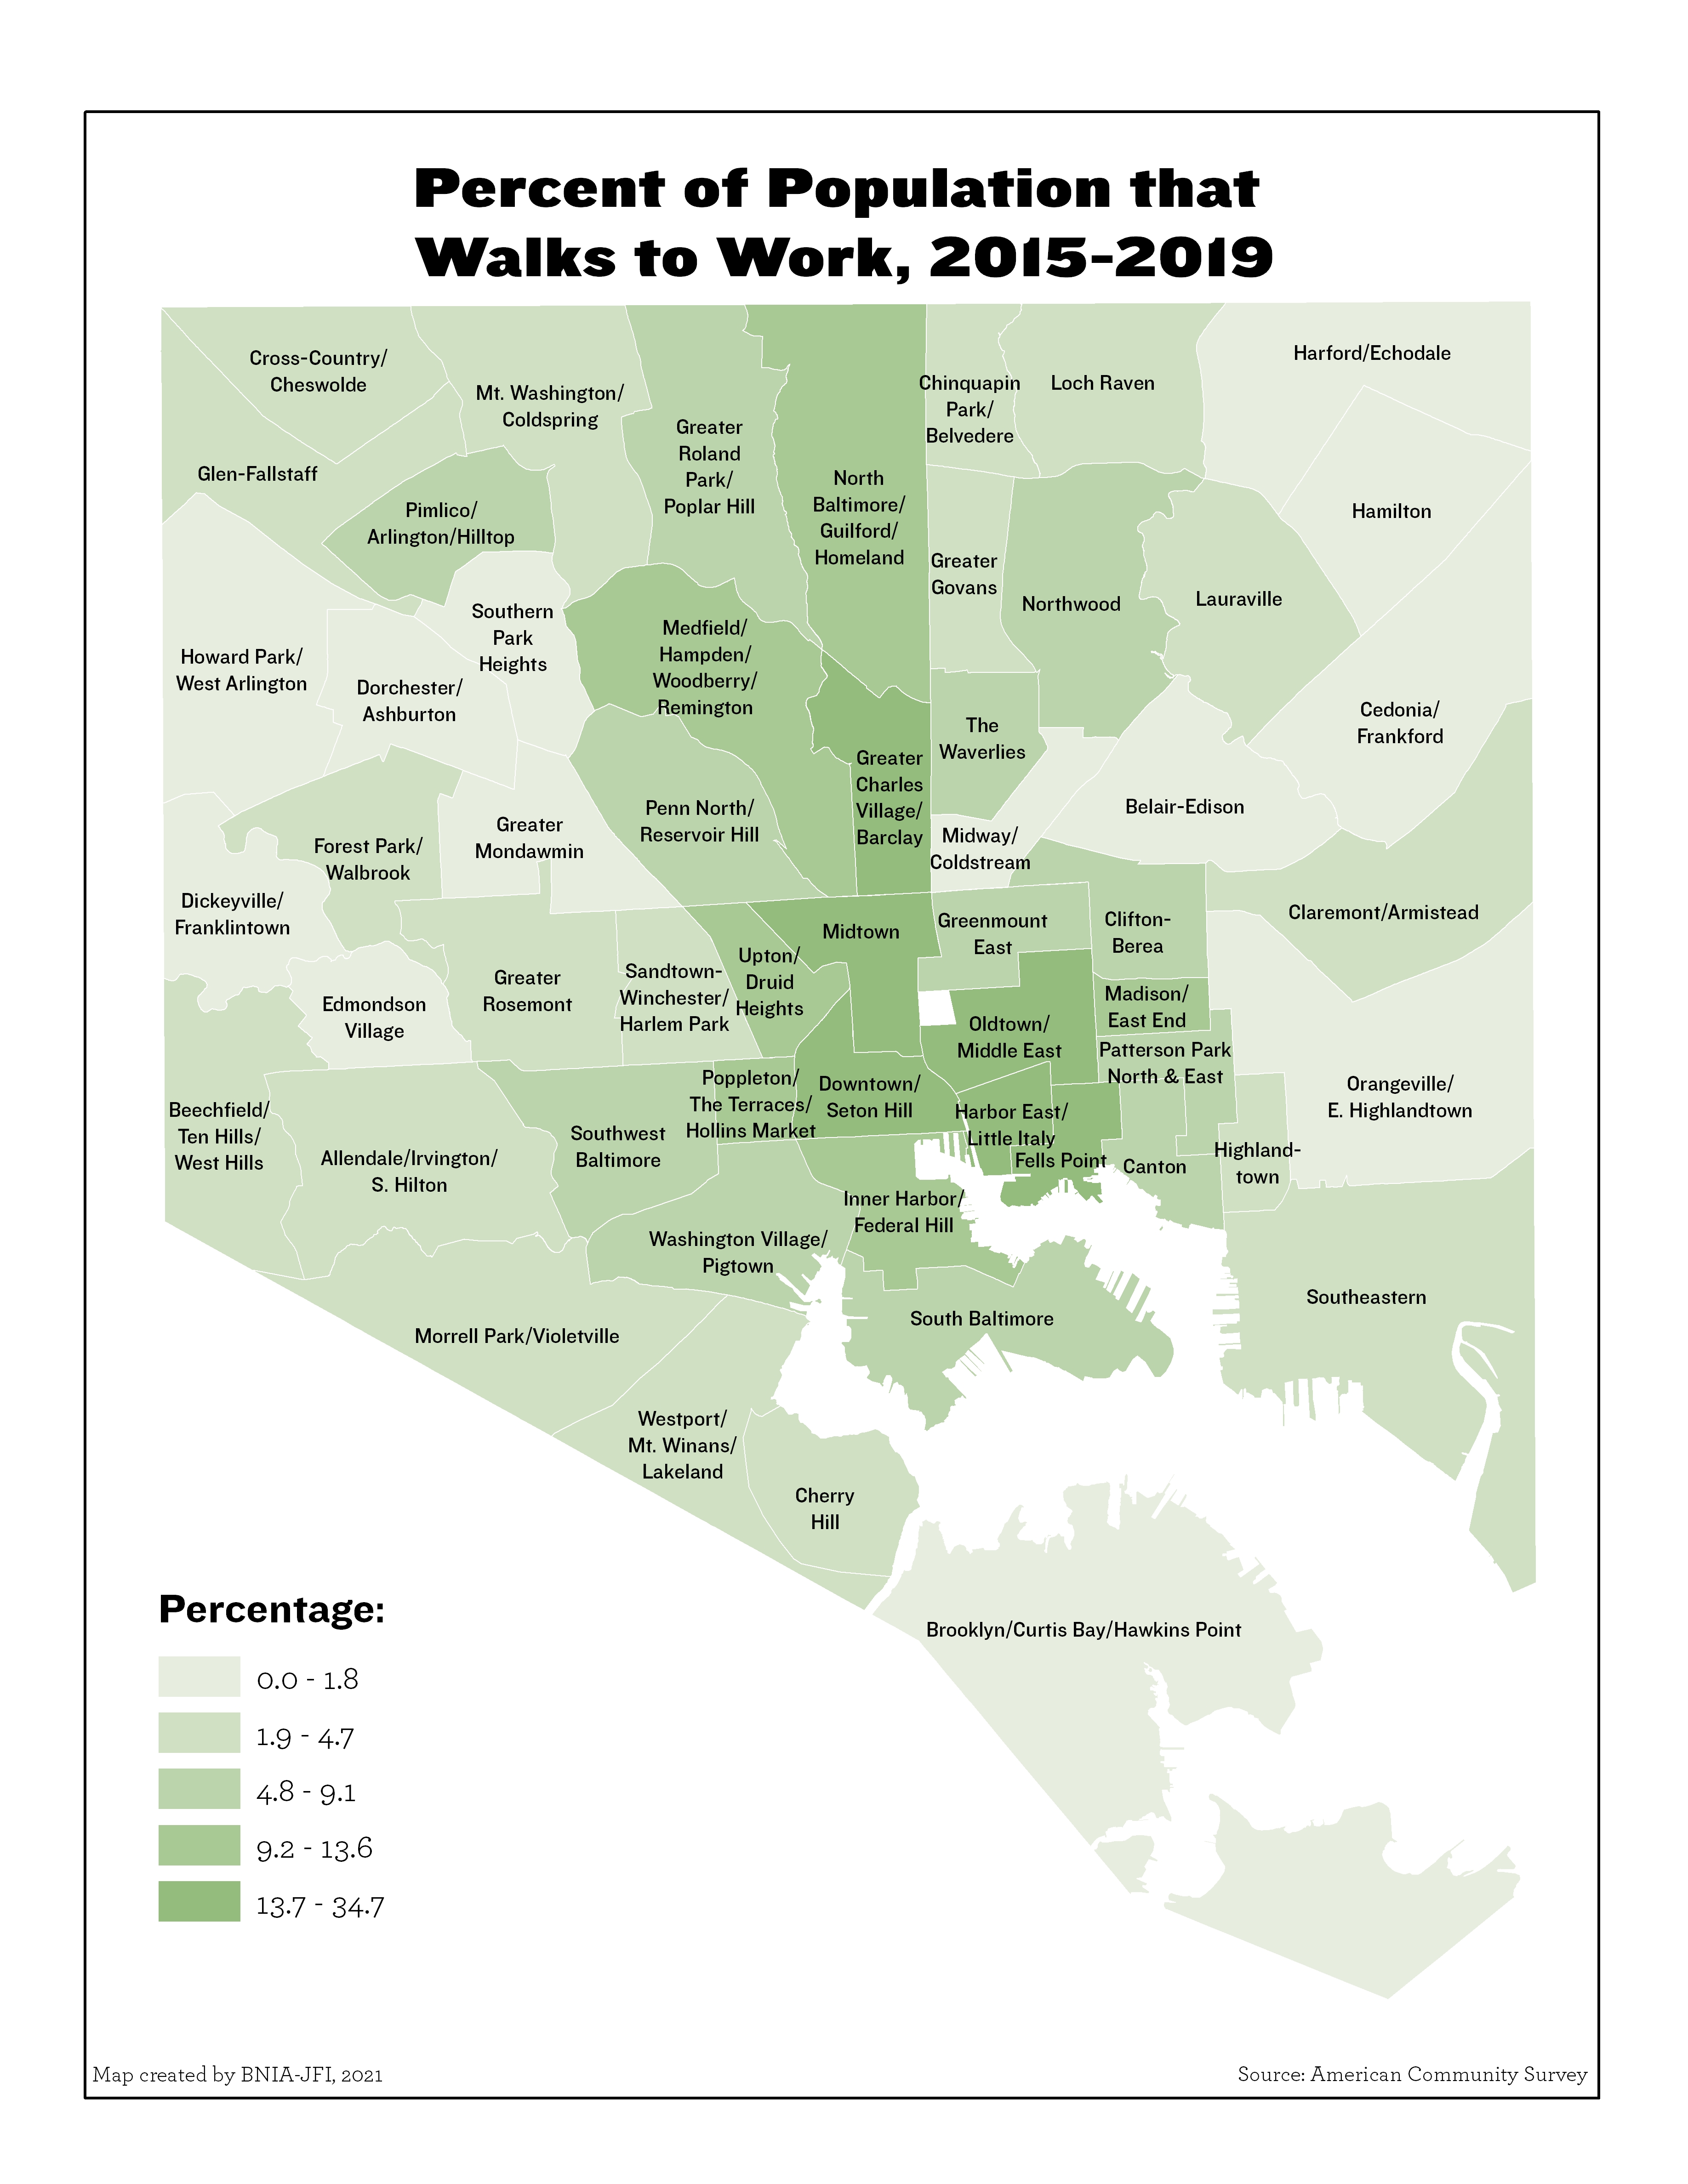
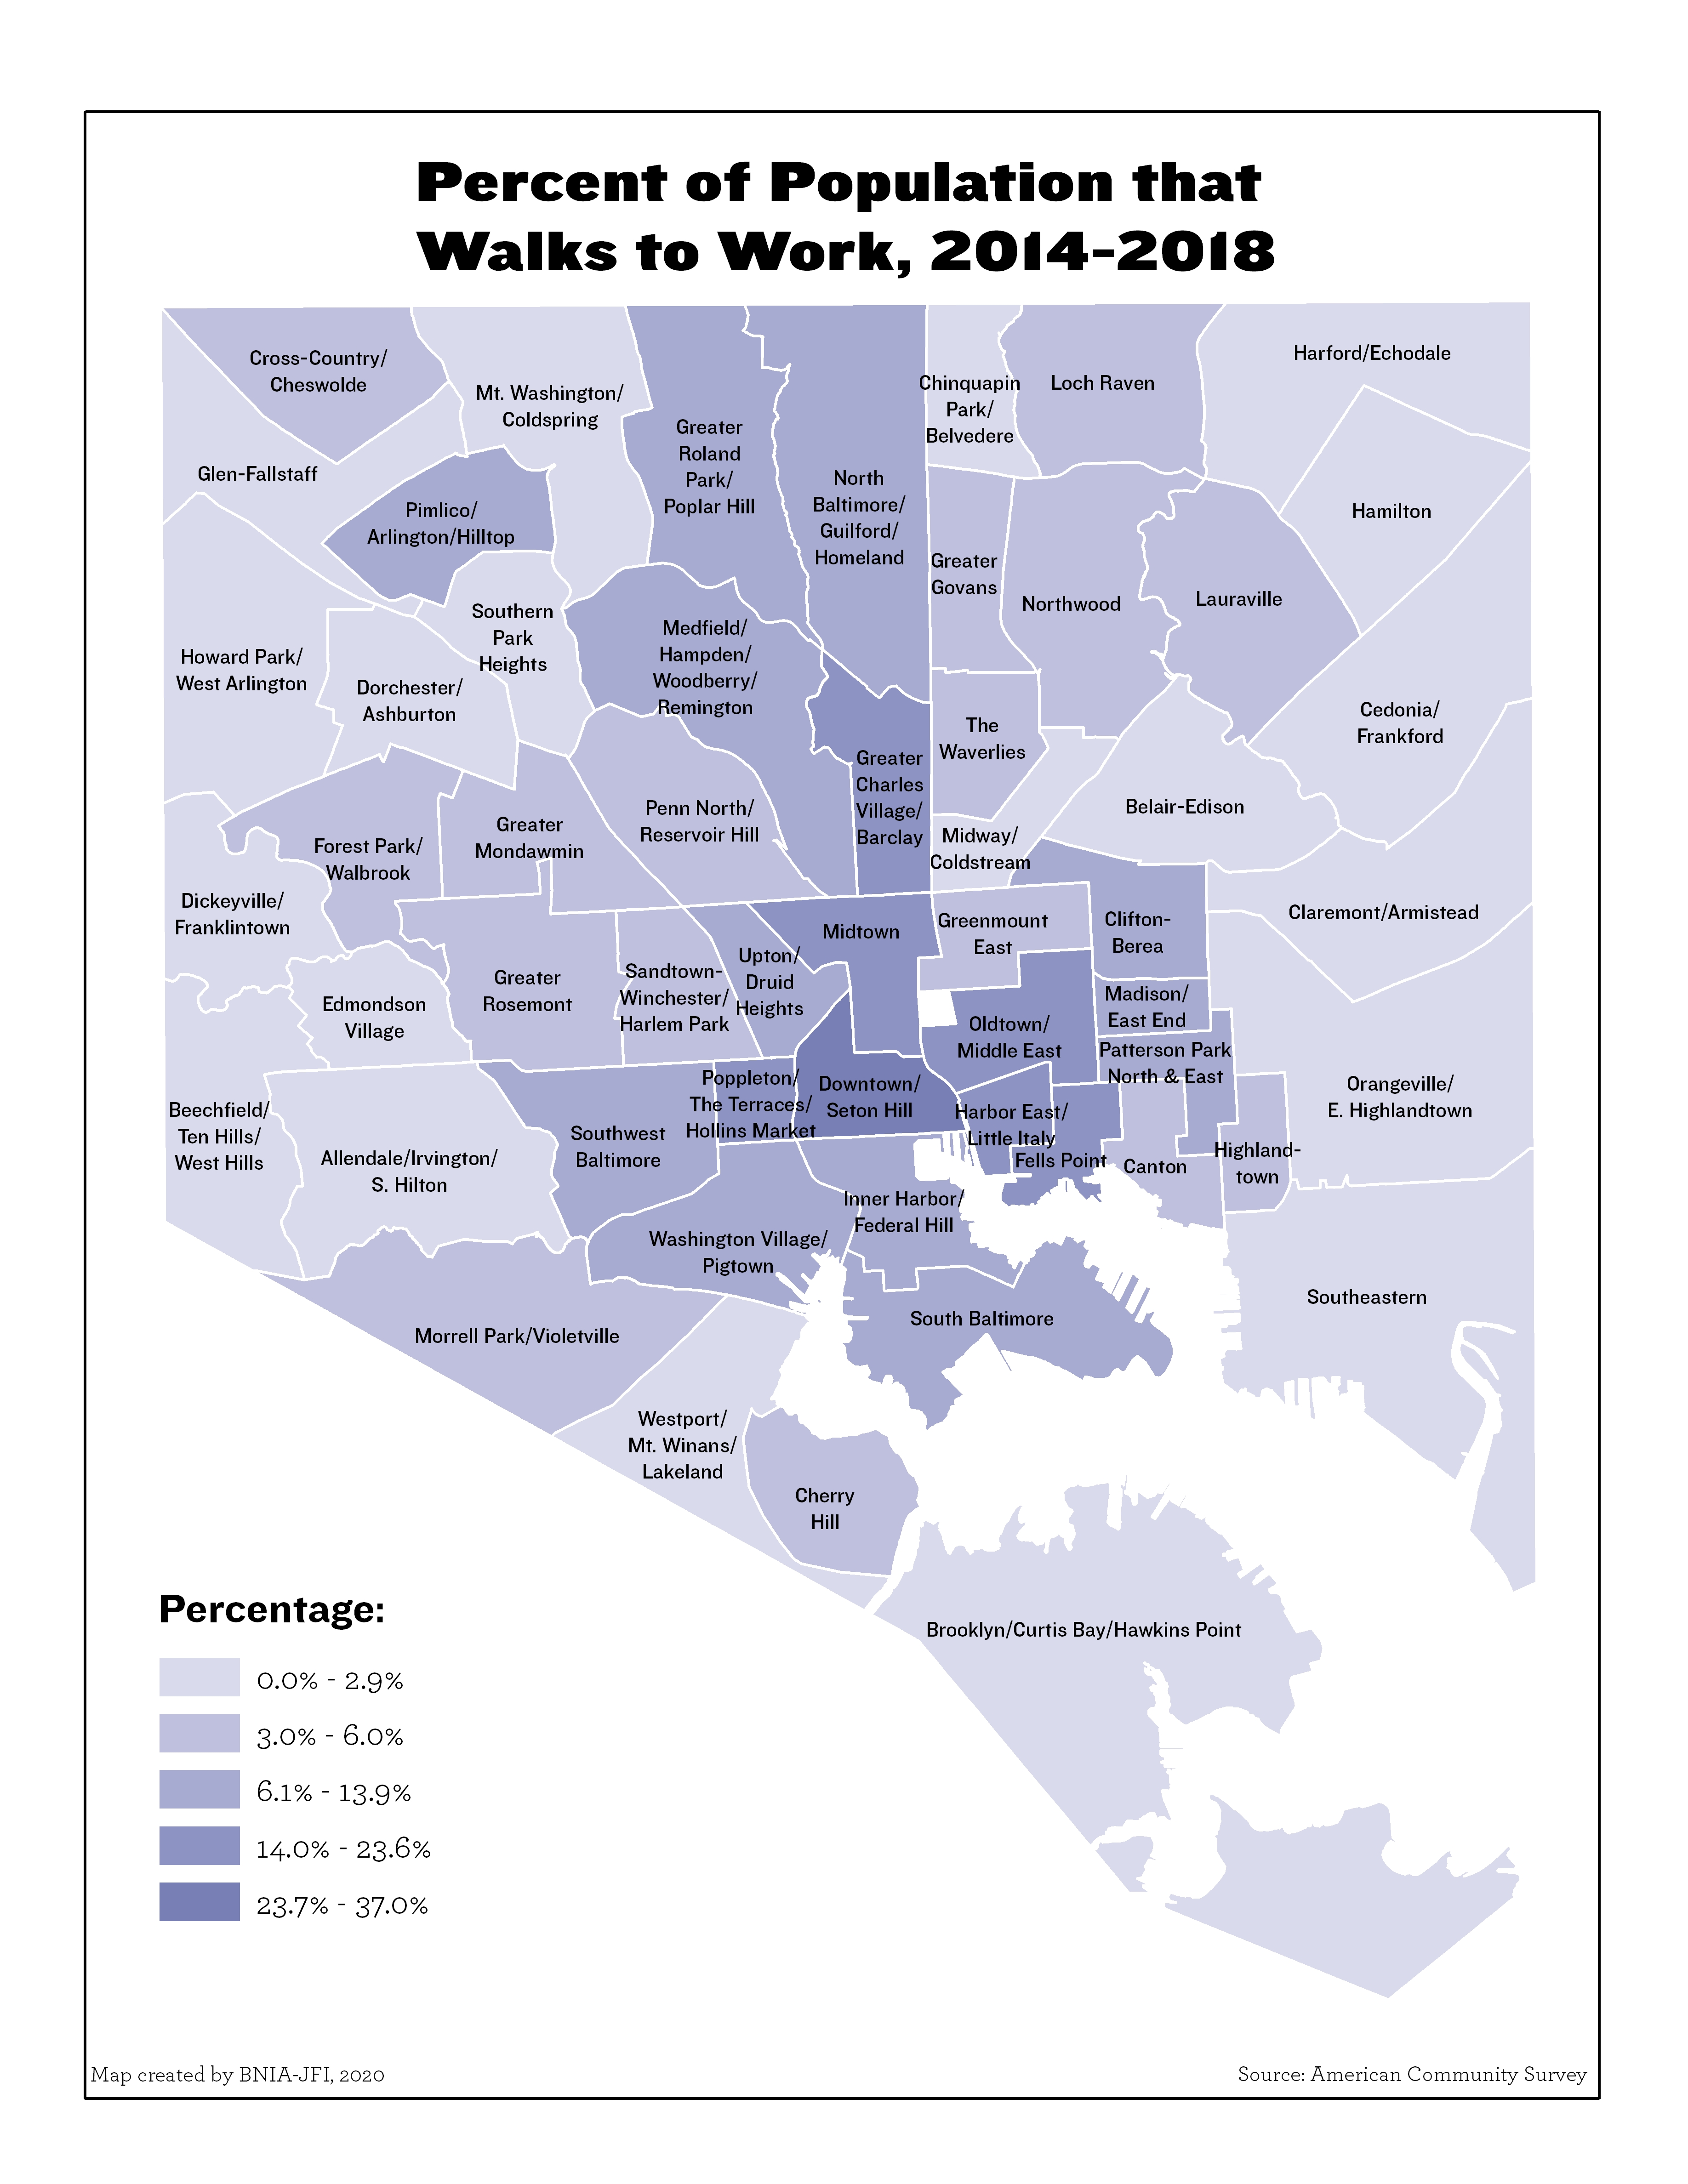
Percent of Population that Walks to Work
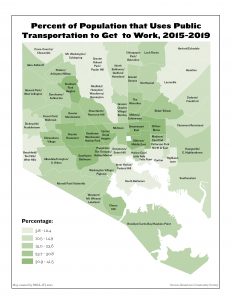
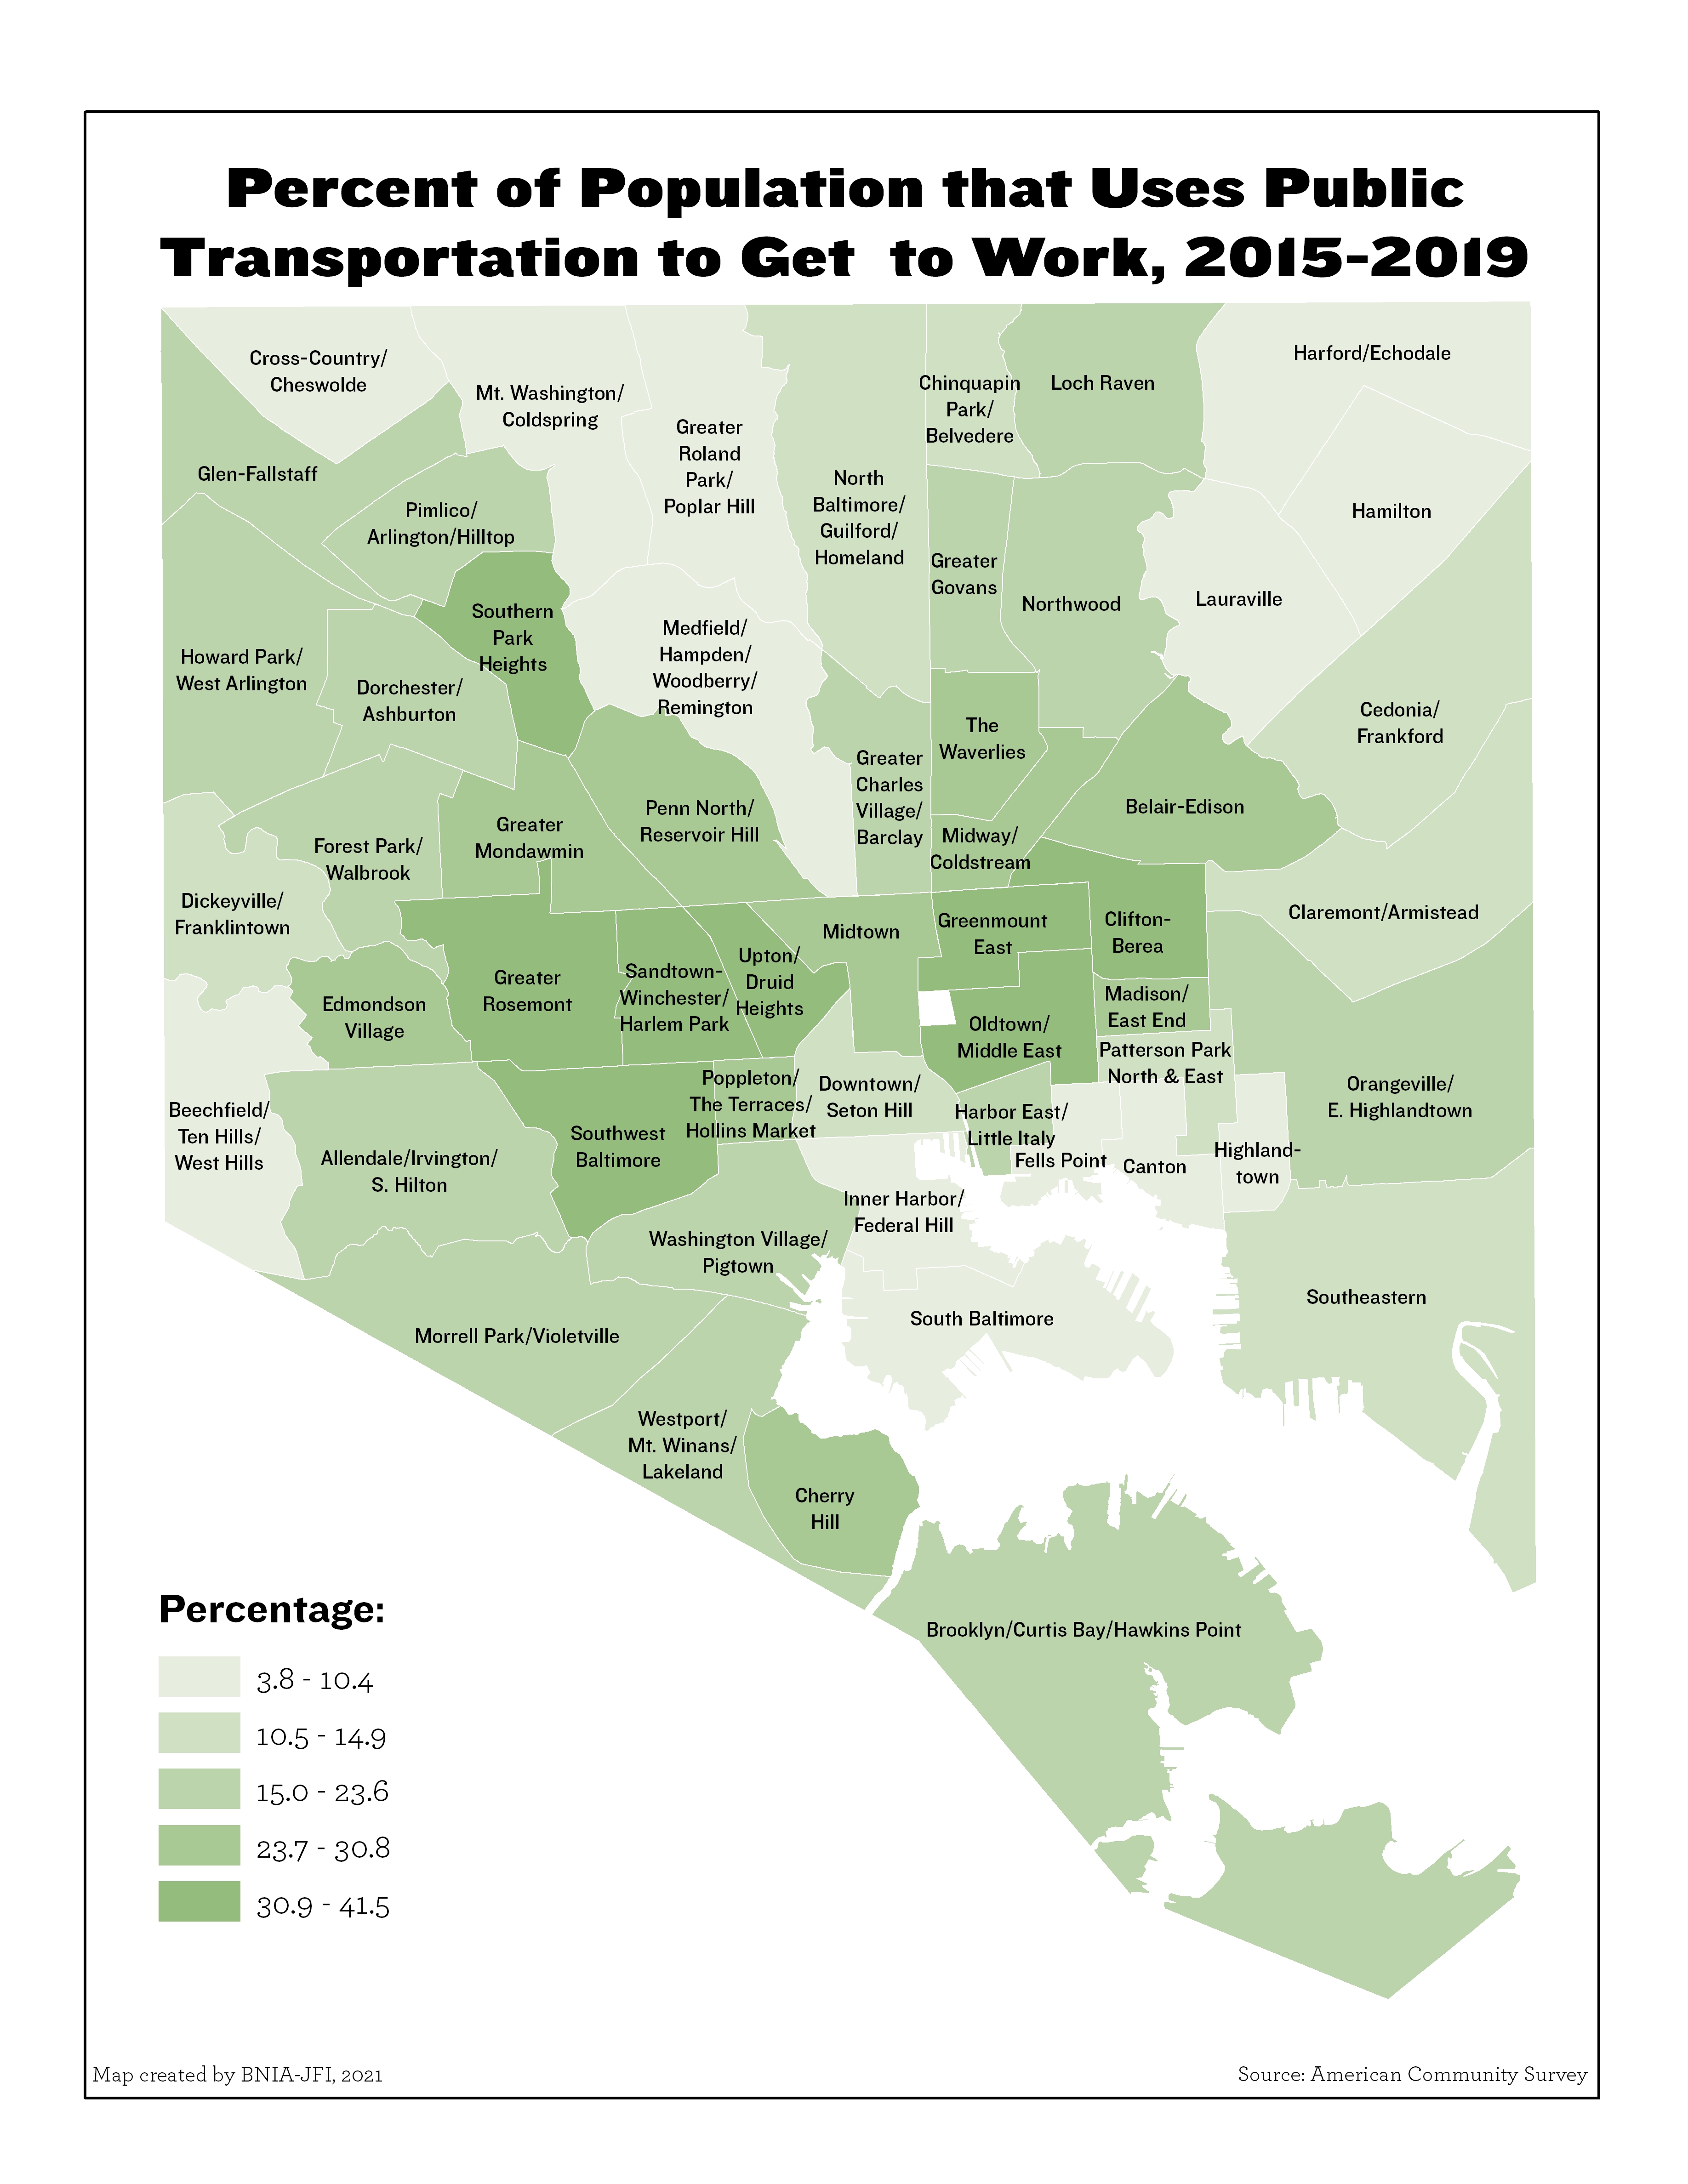
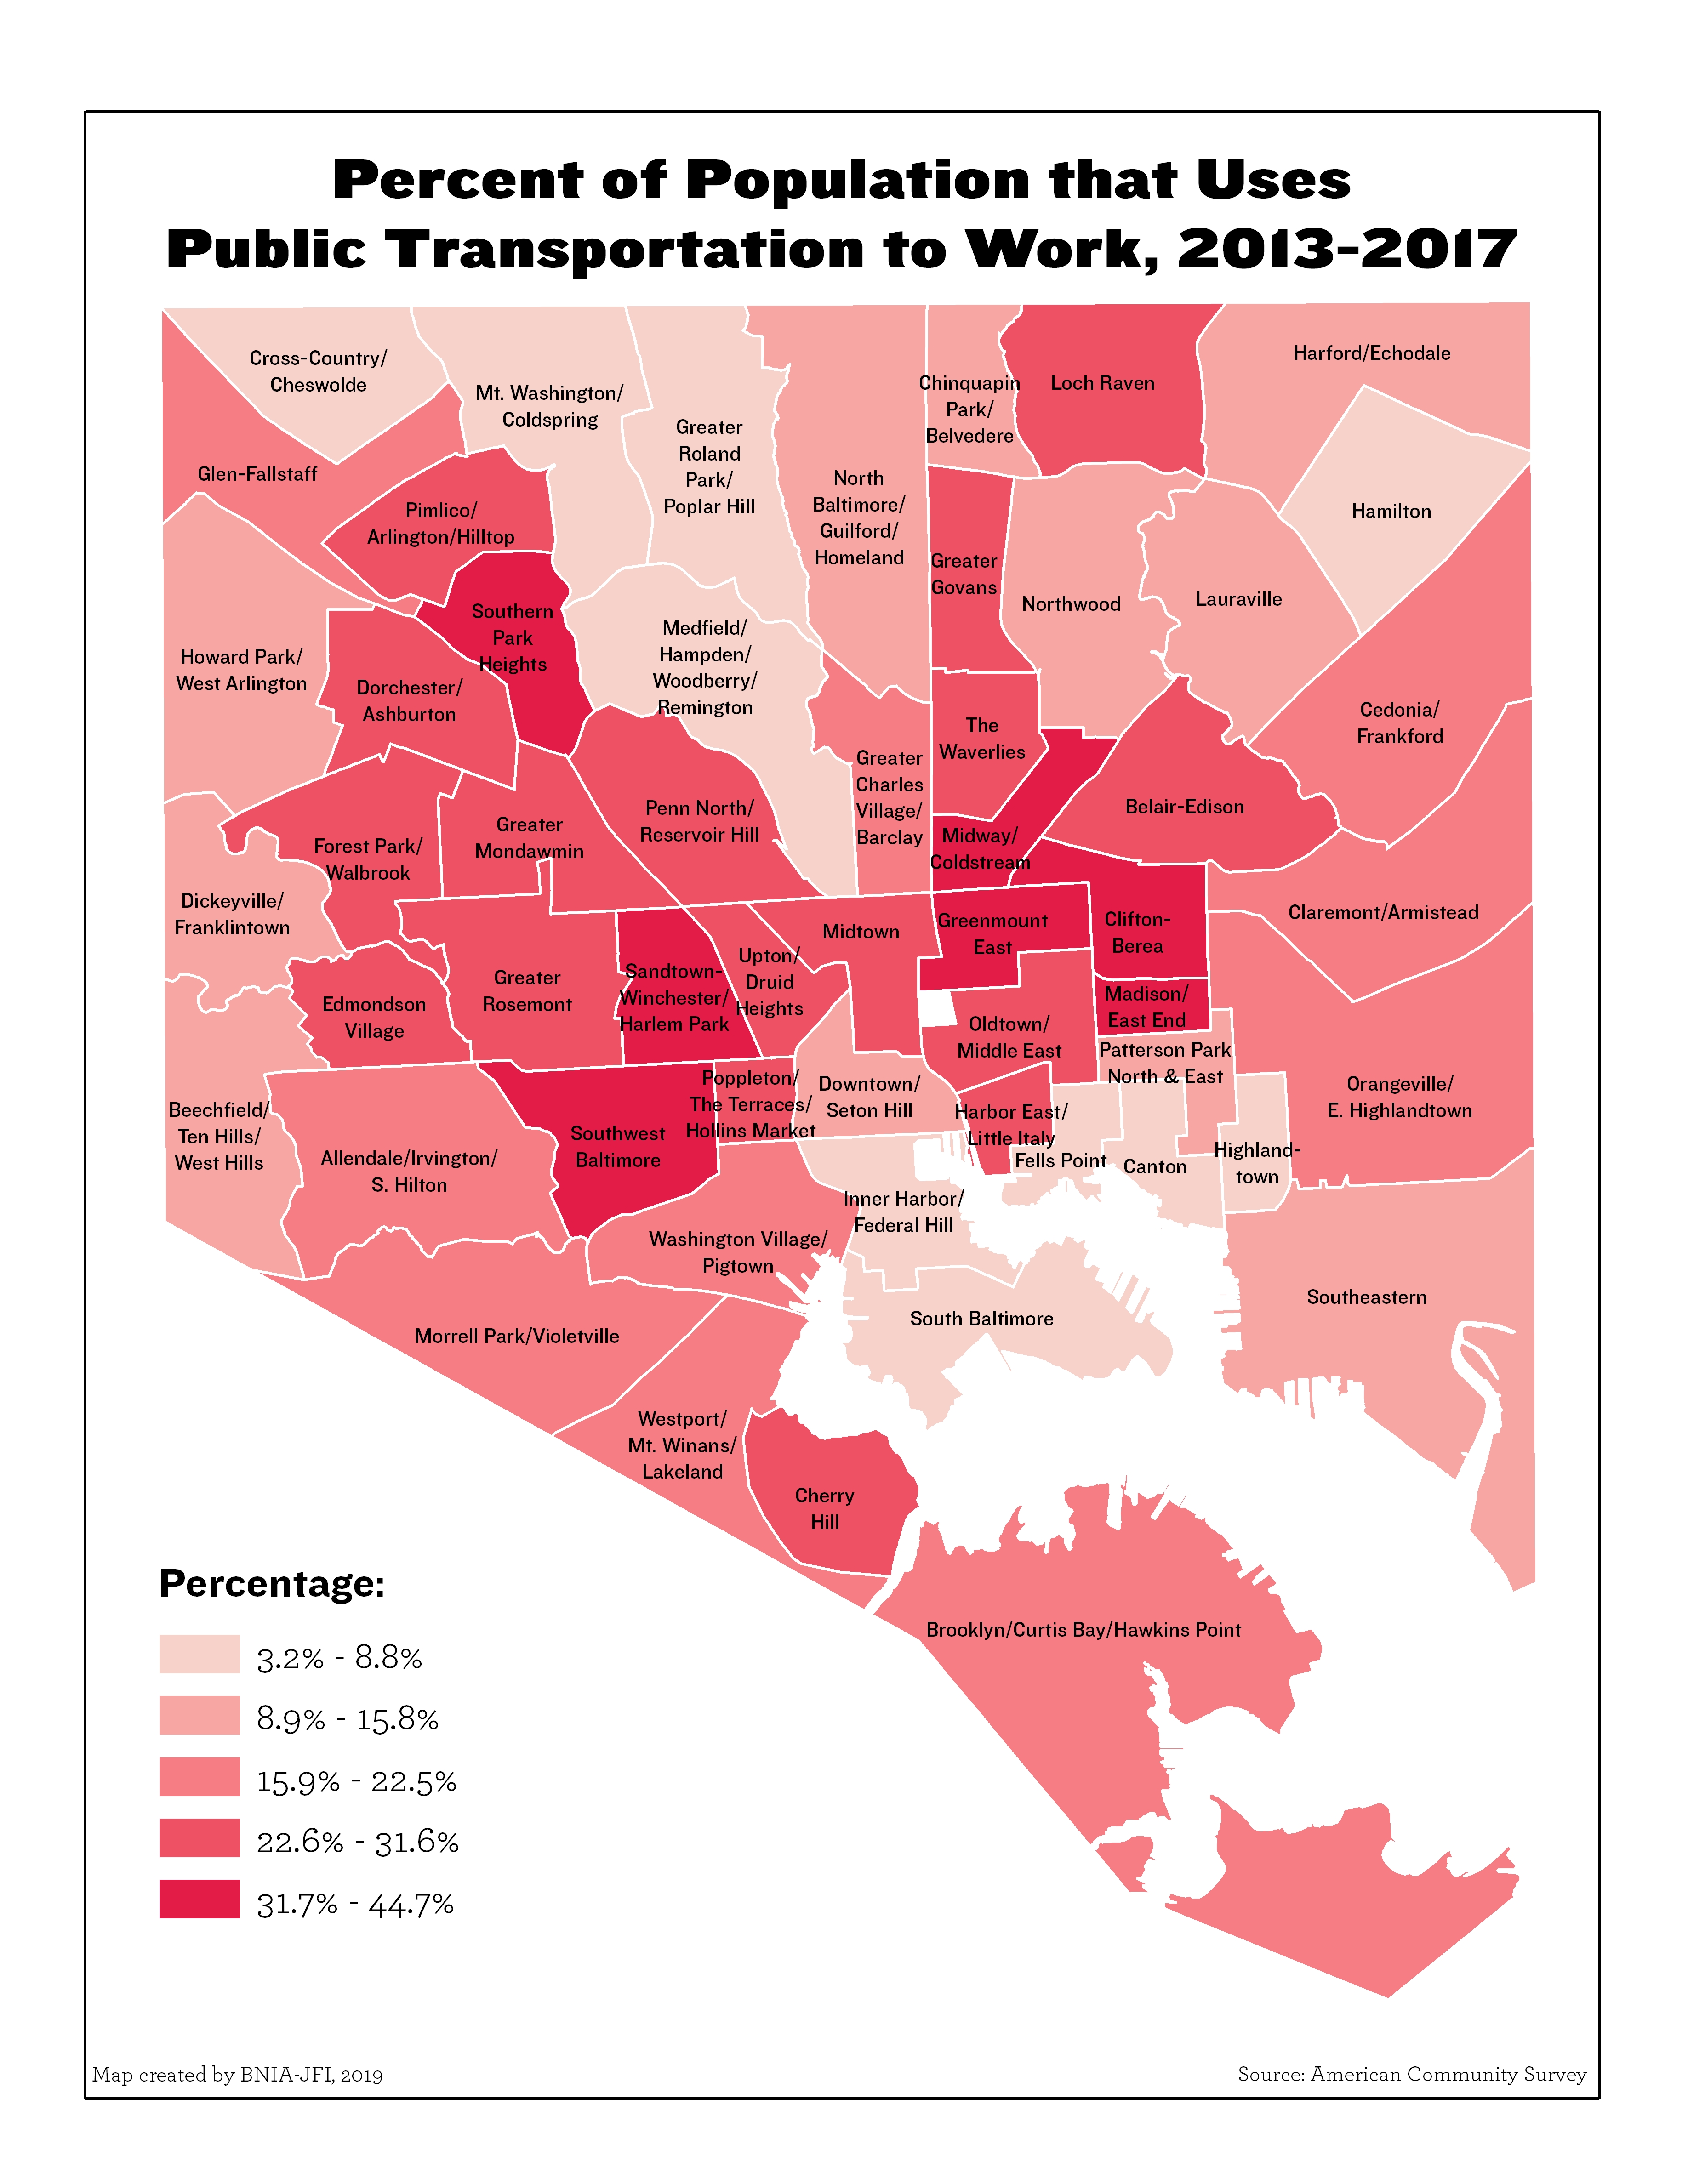
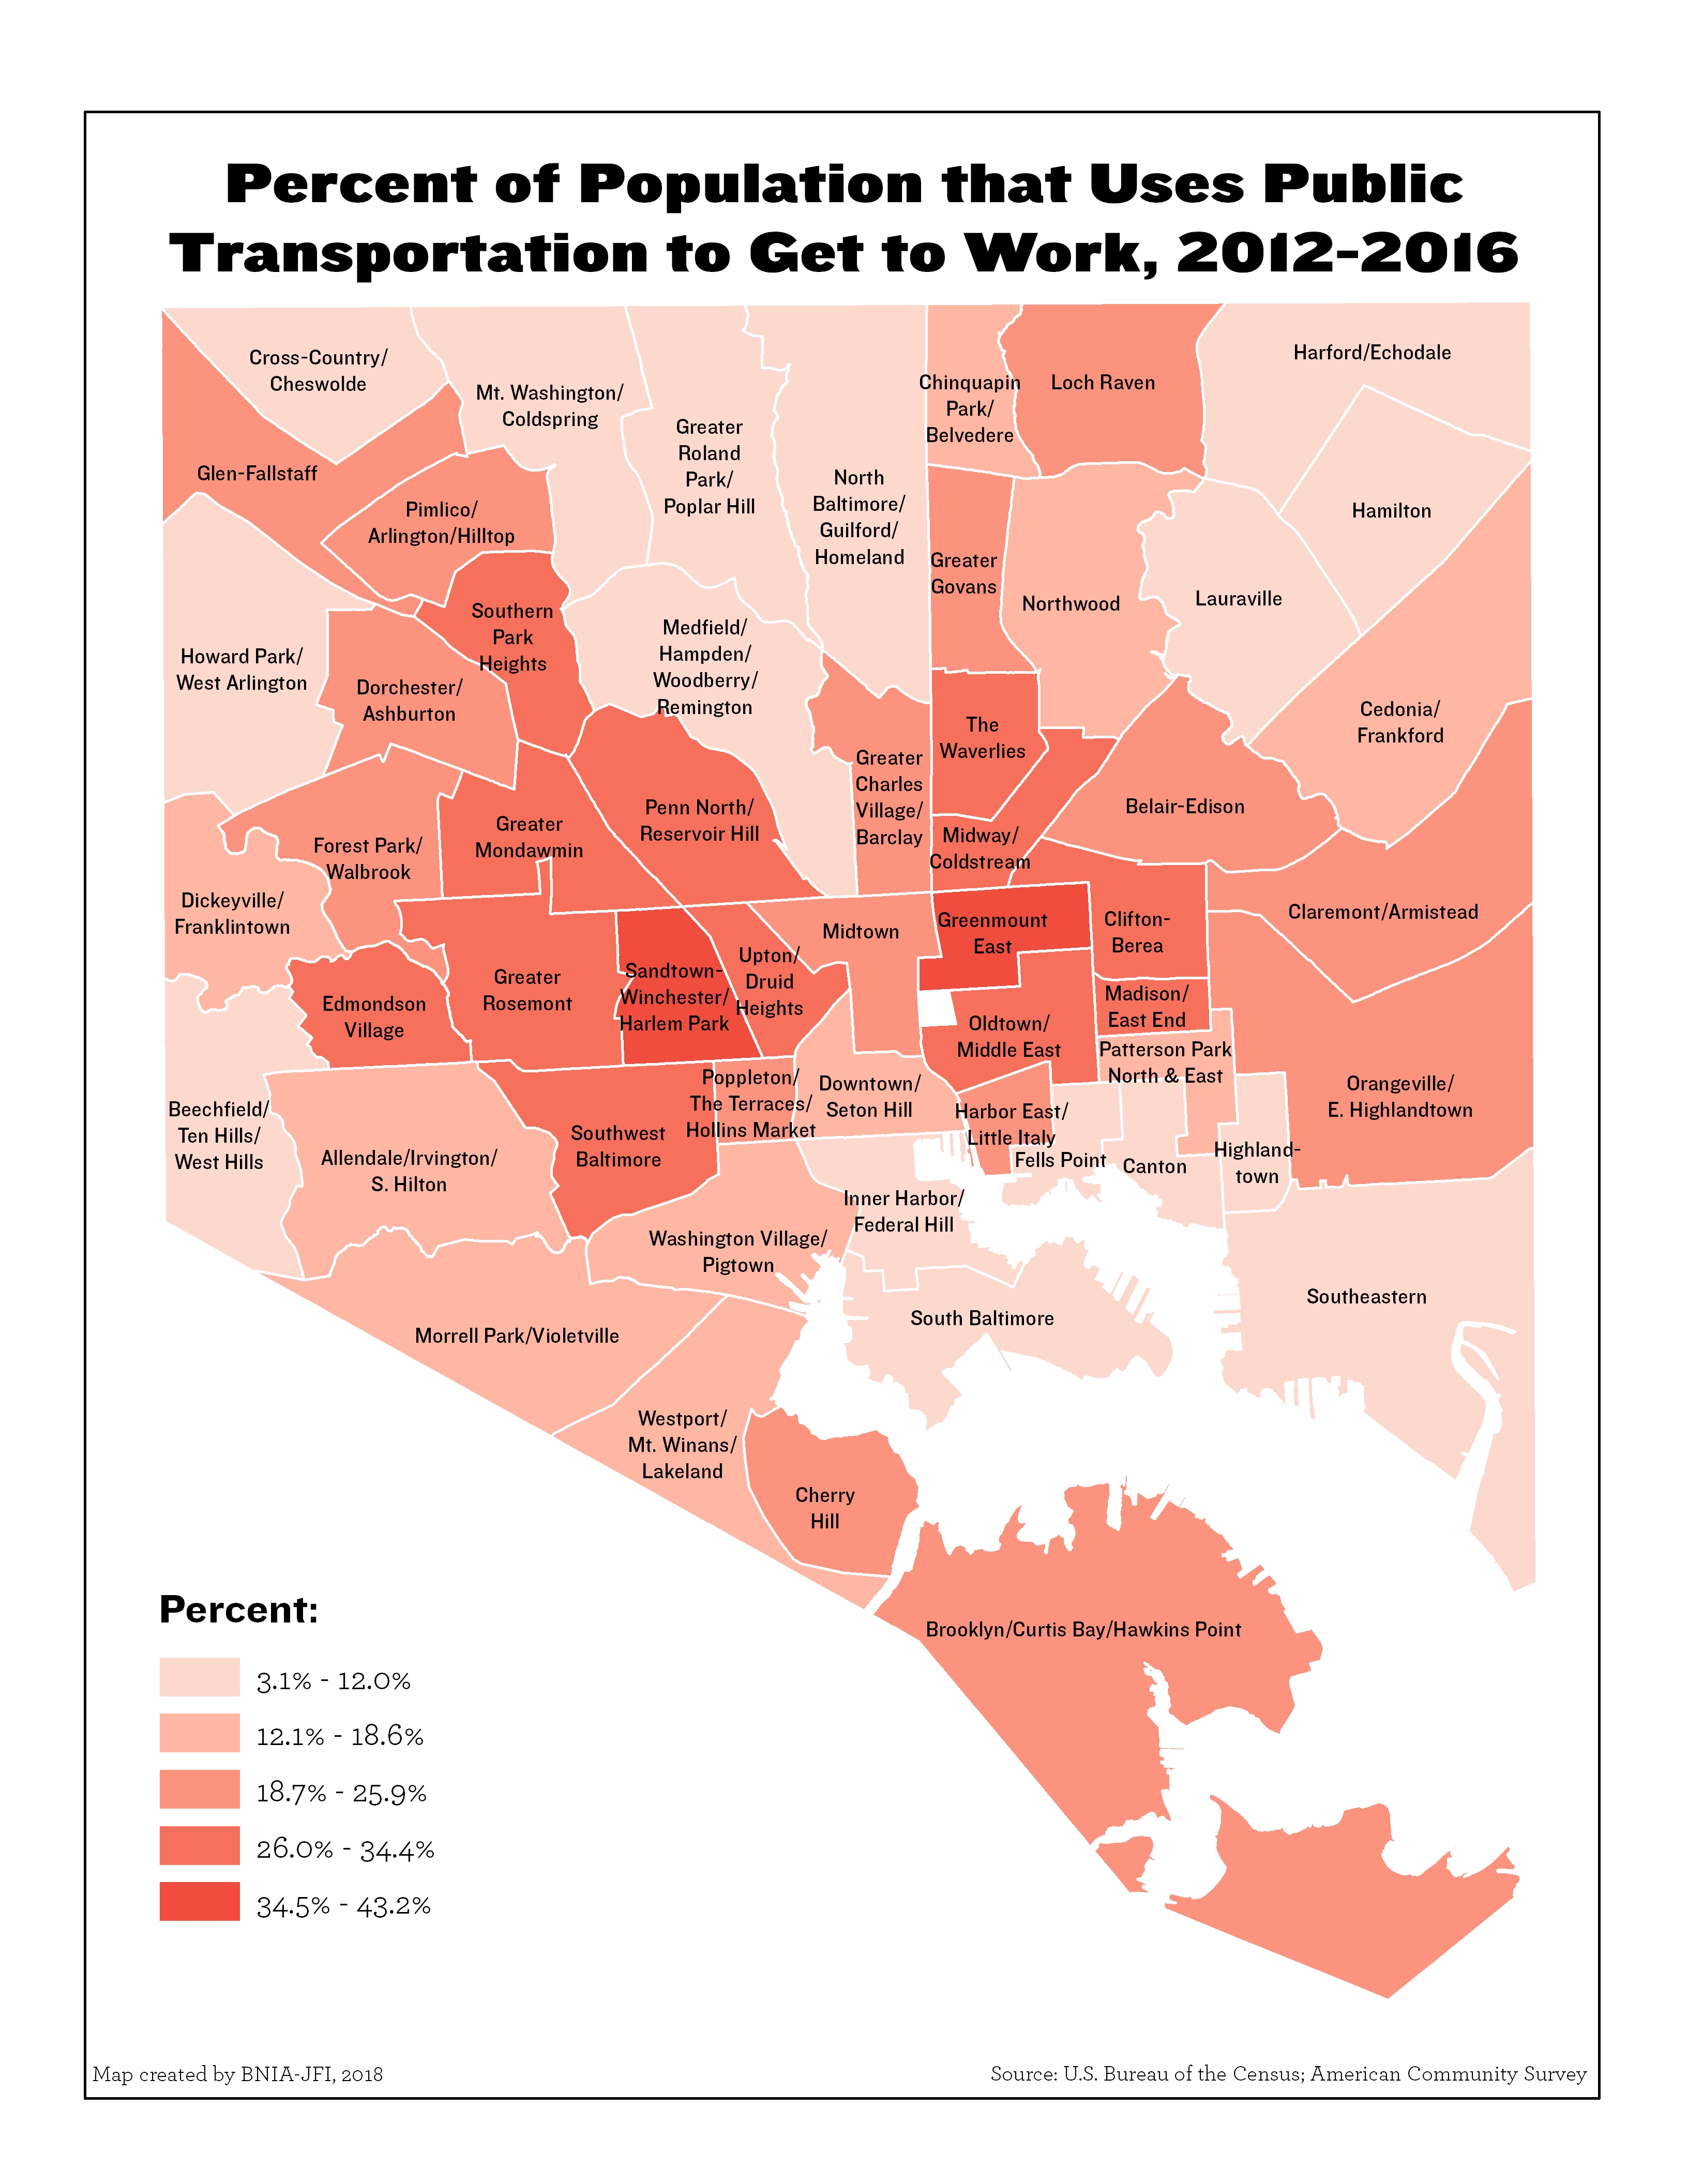
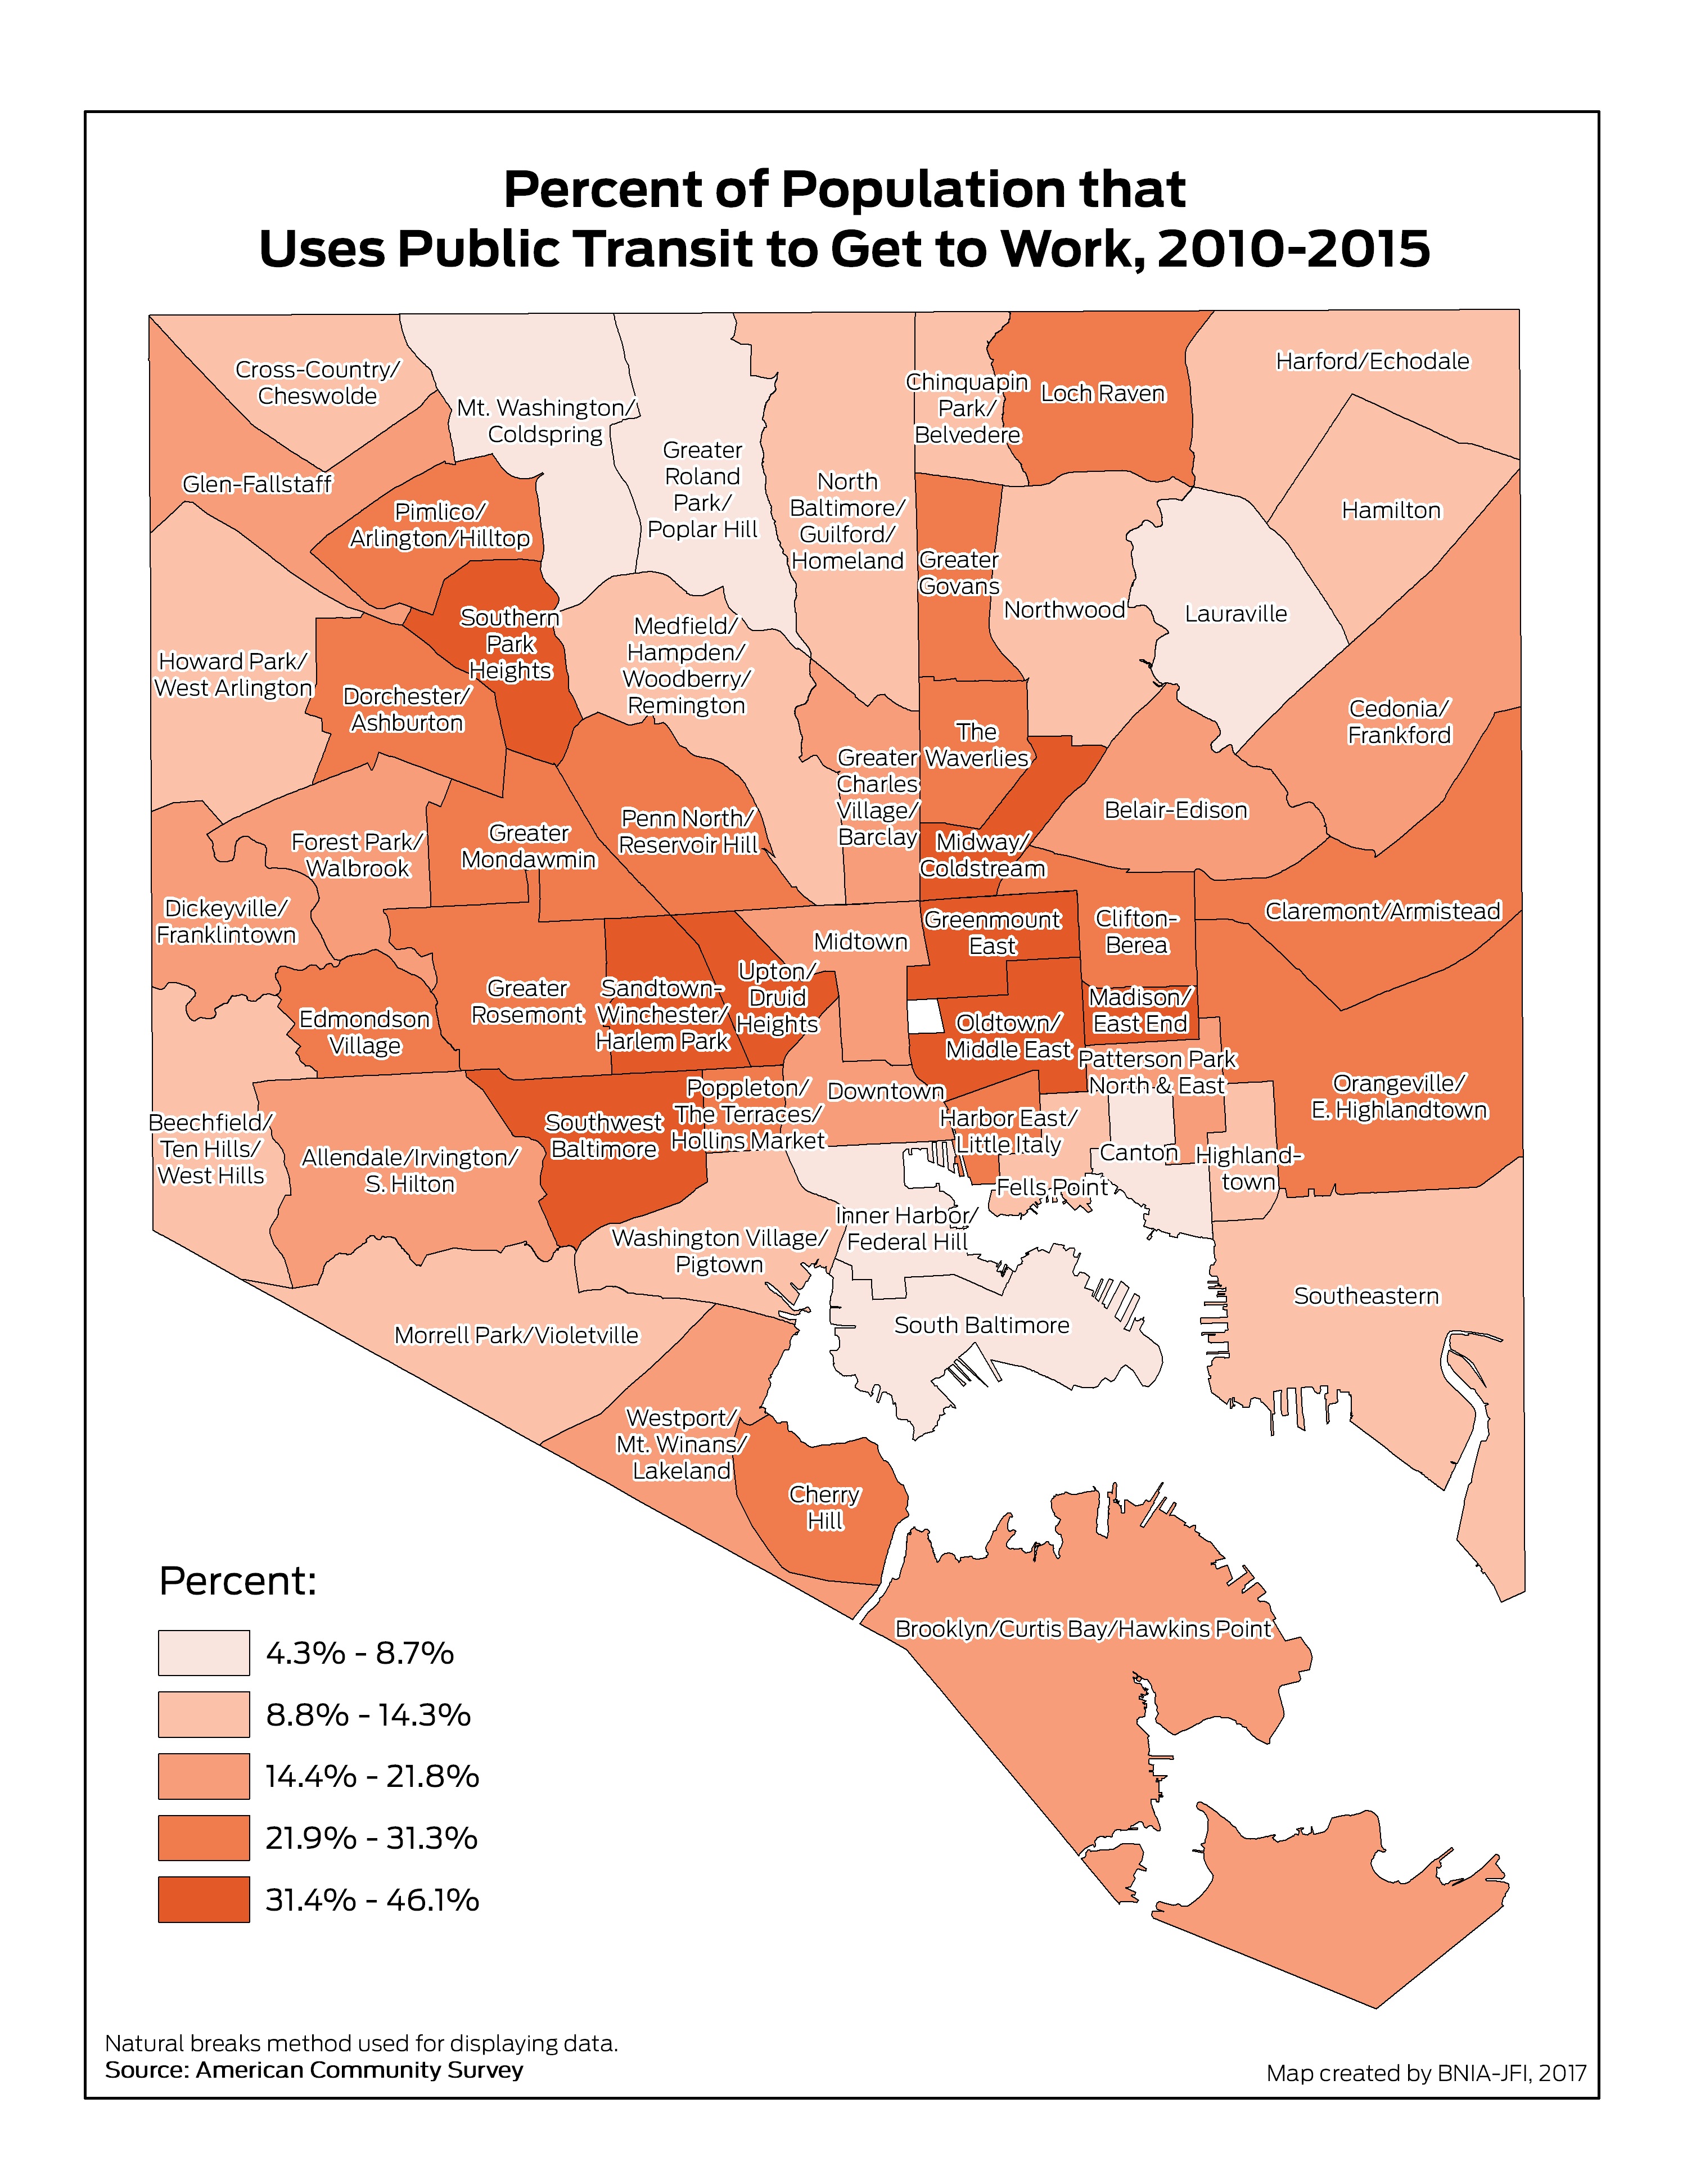
Percent of Population that Uses Public Transportation to Get to Work
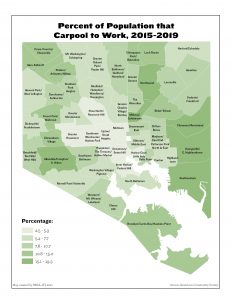
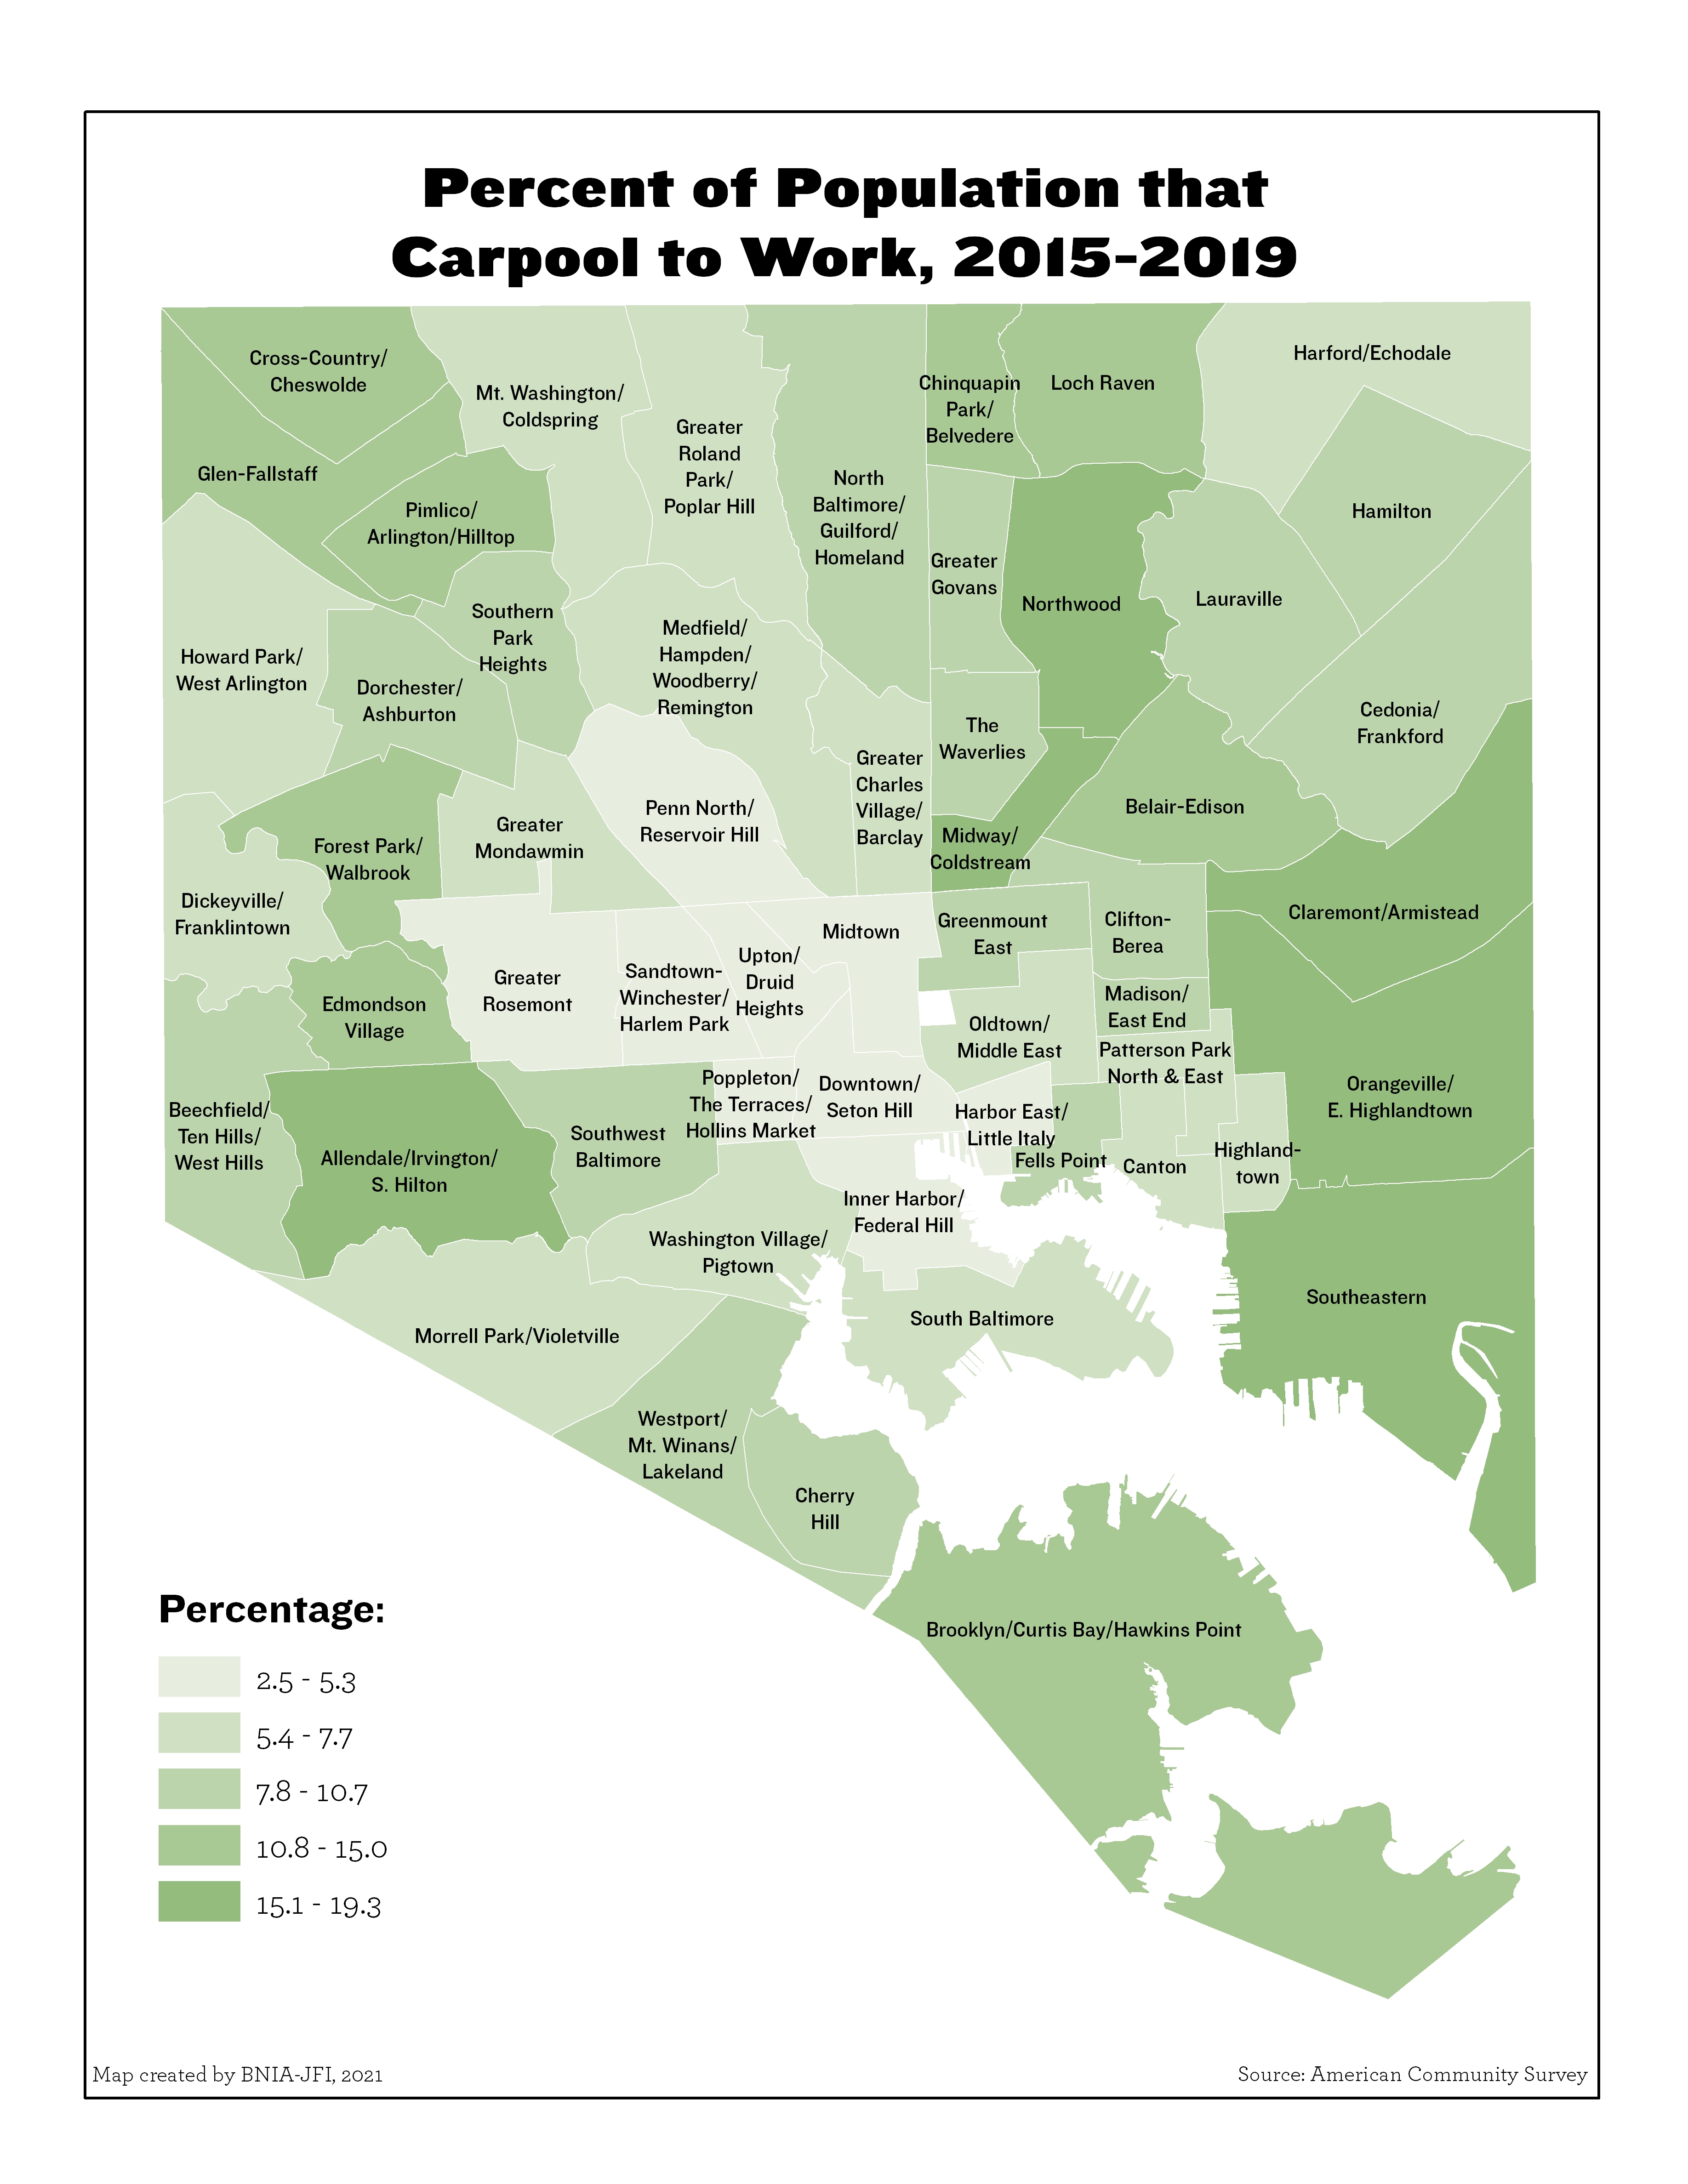
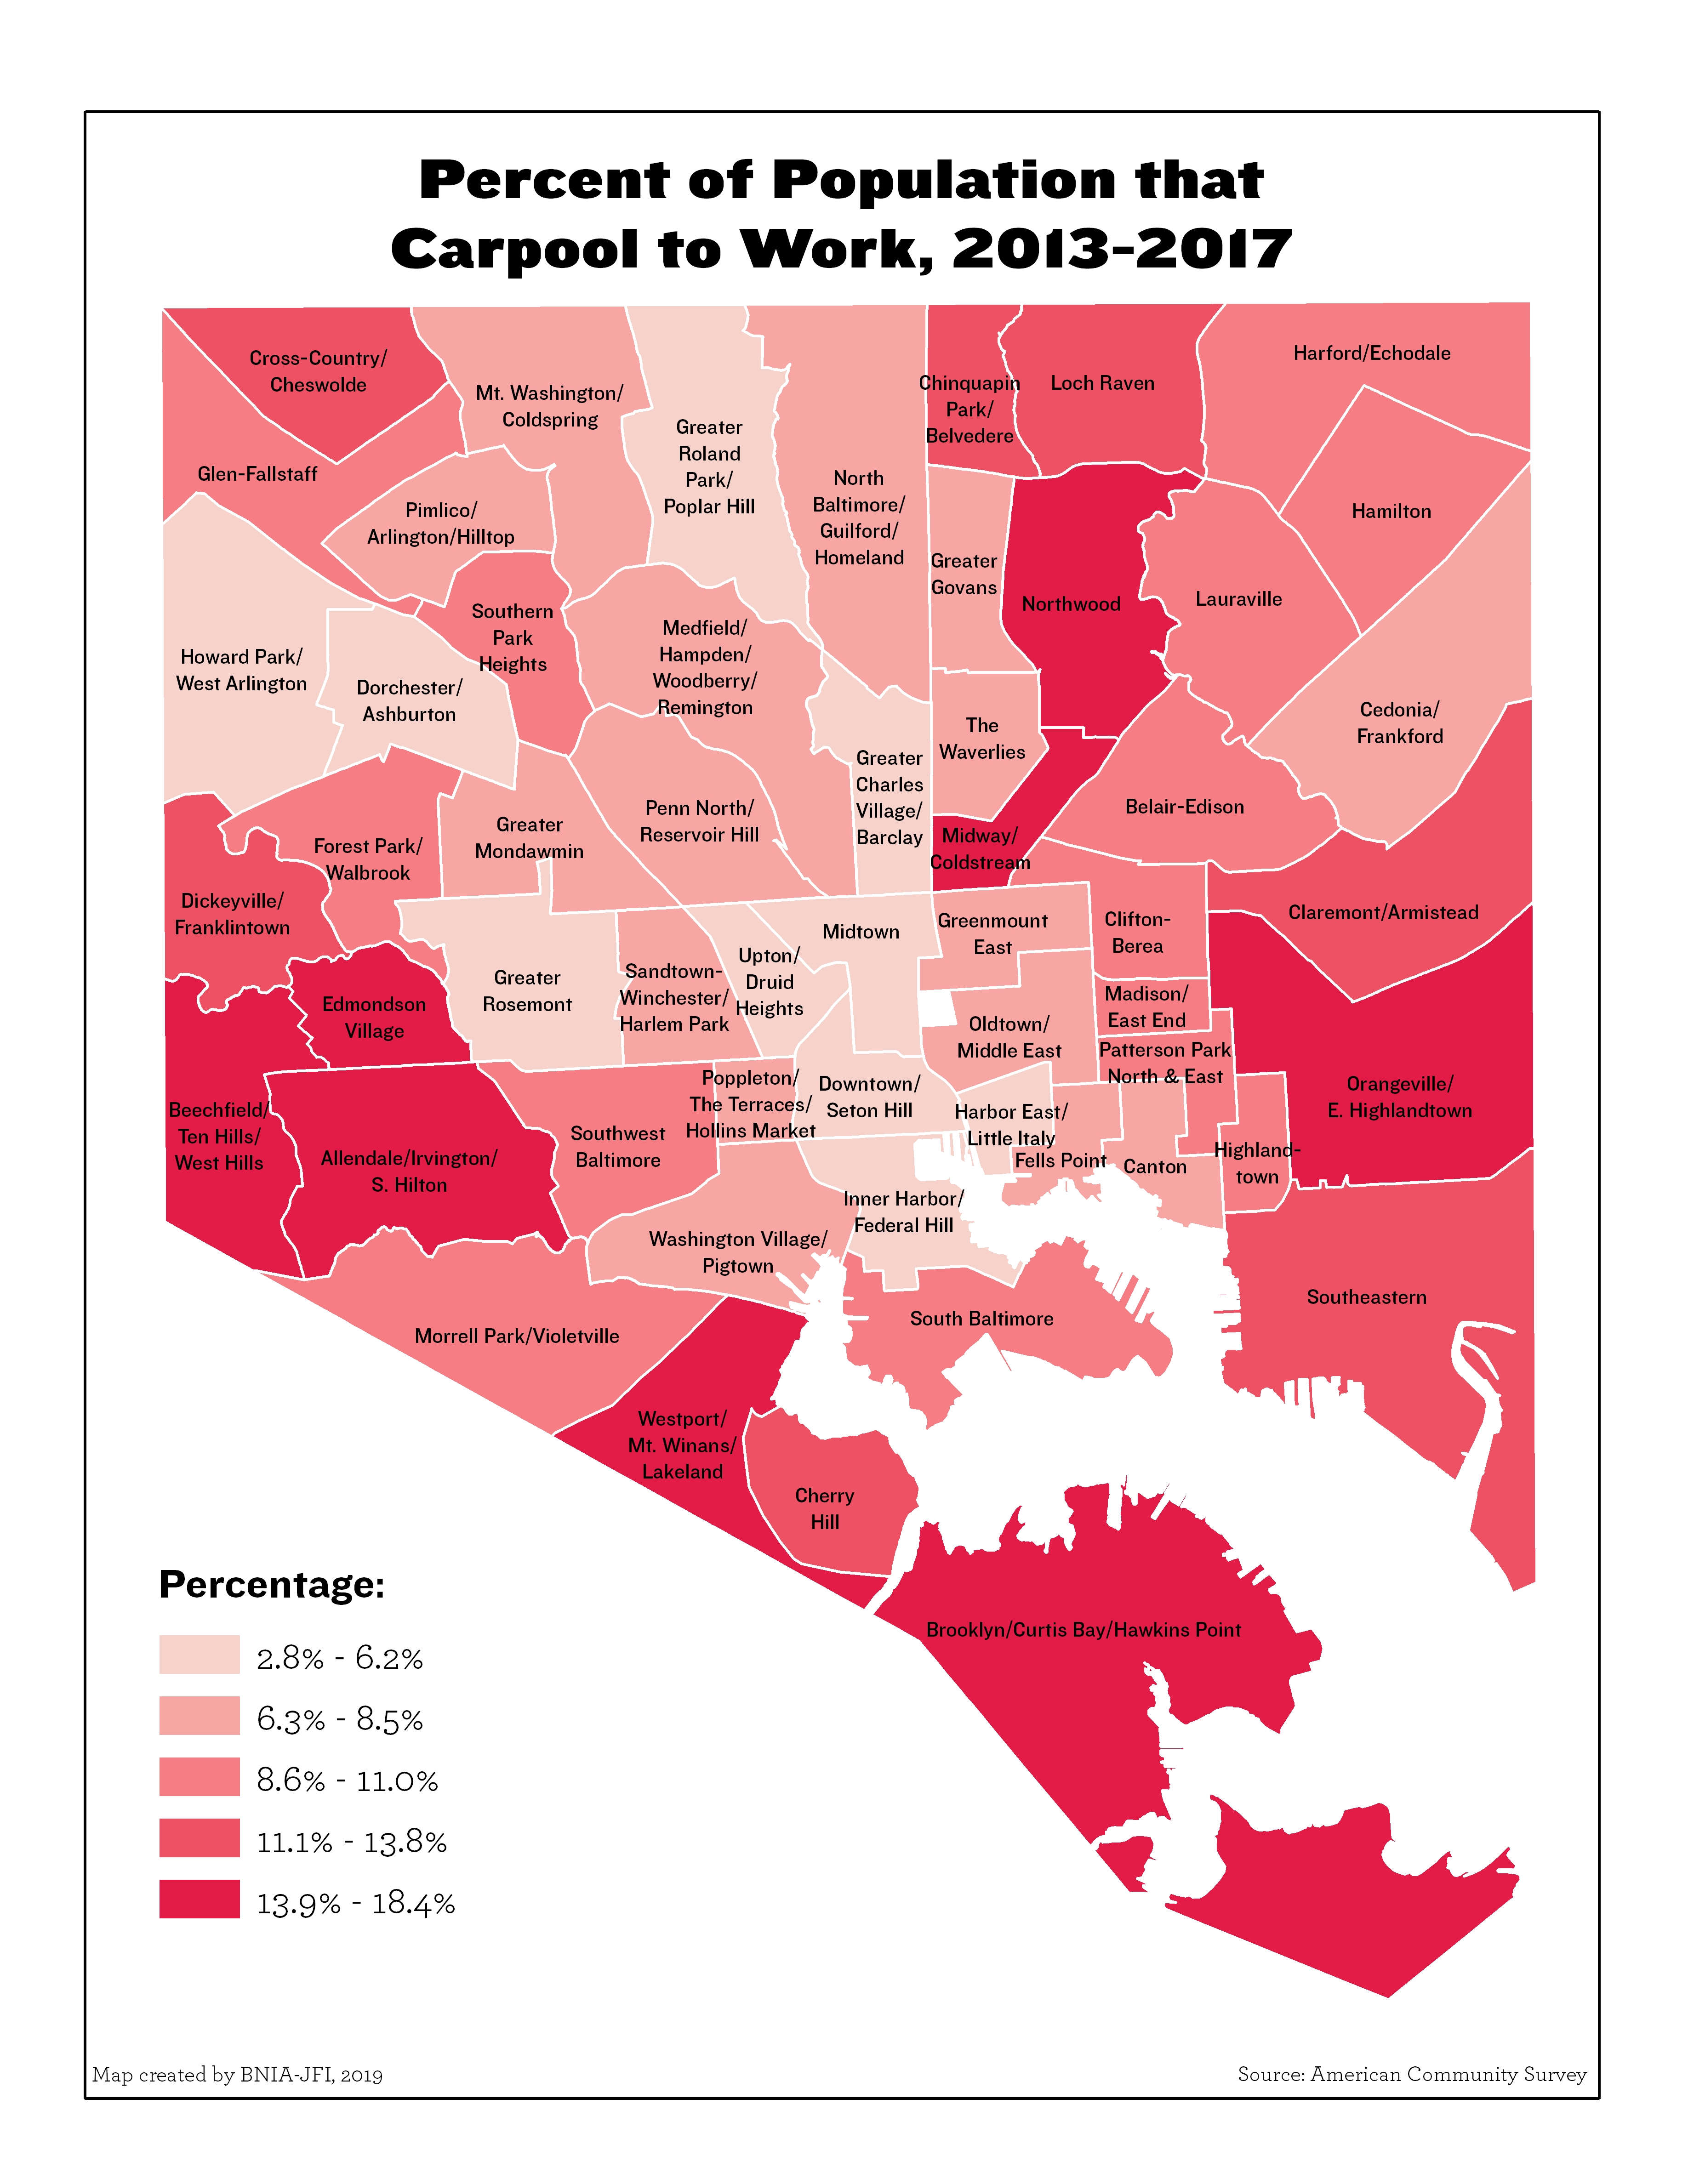
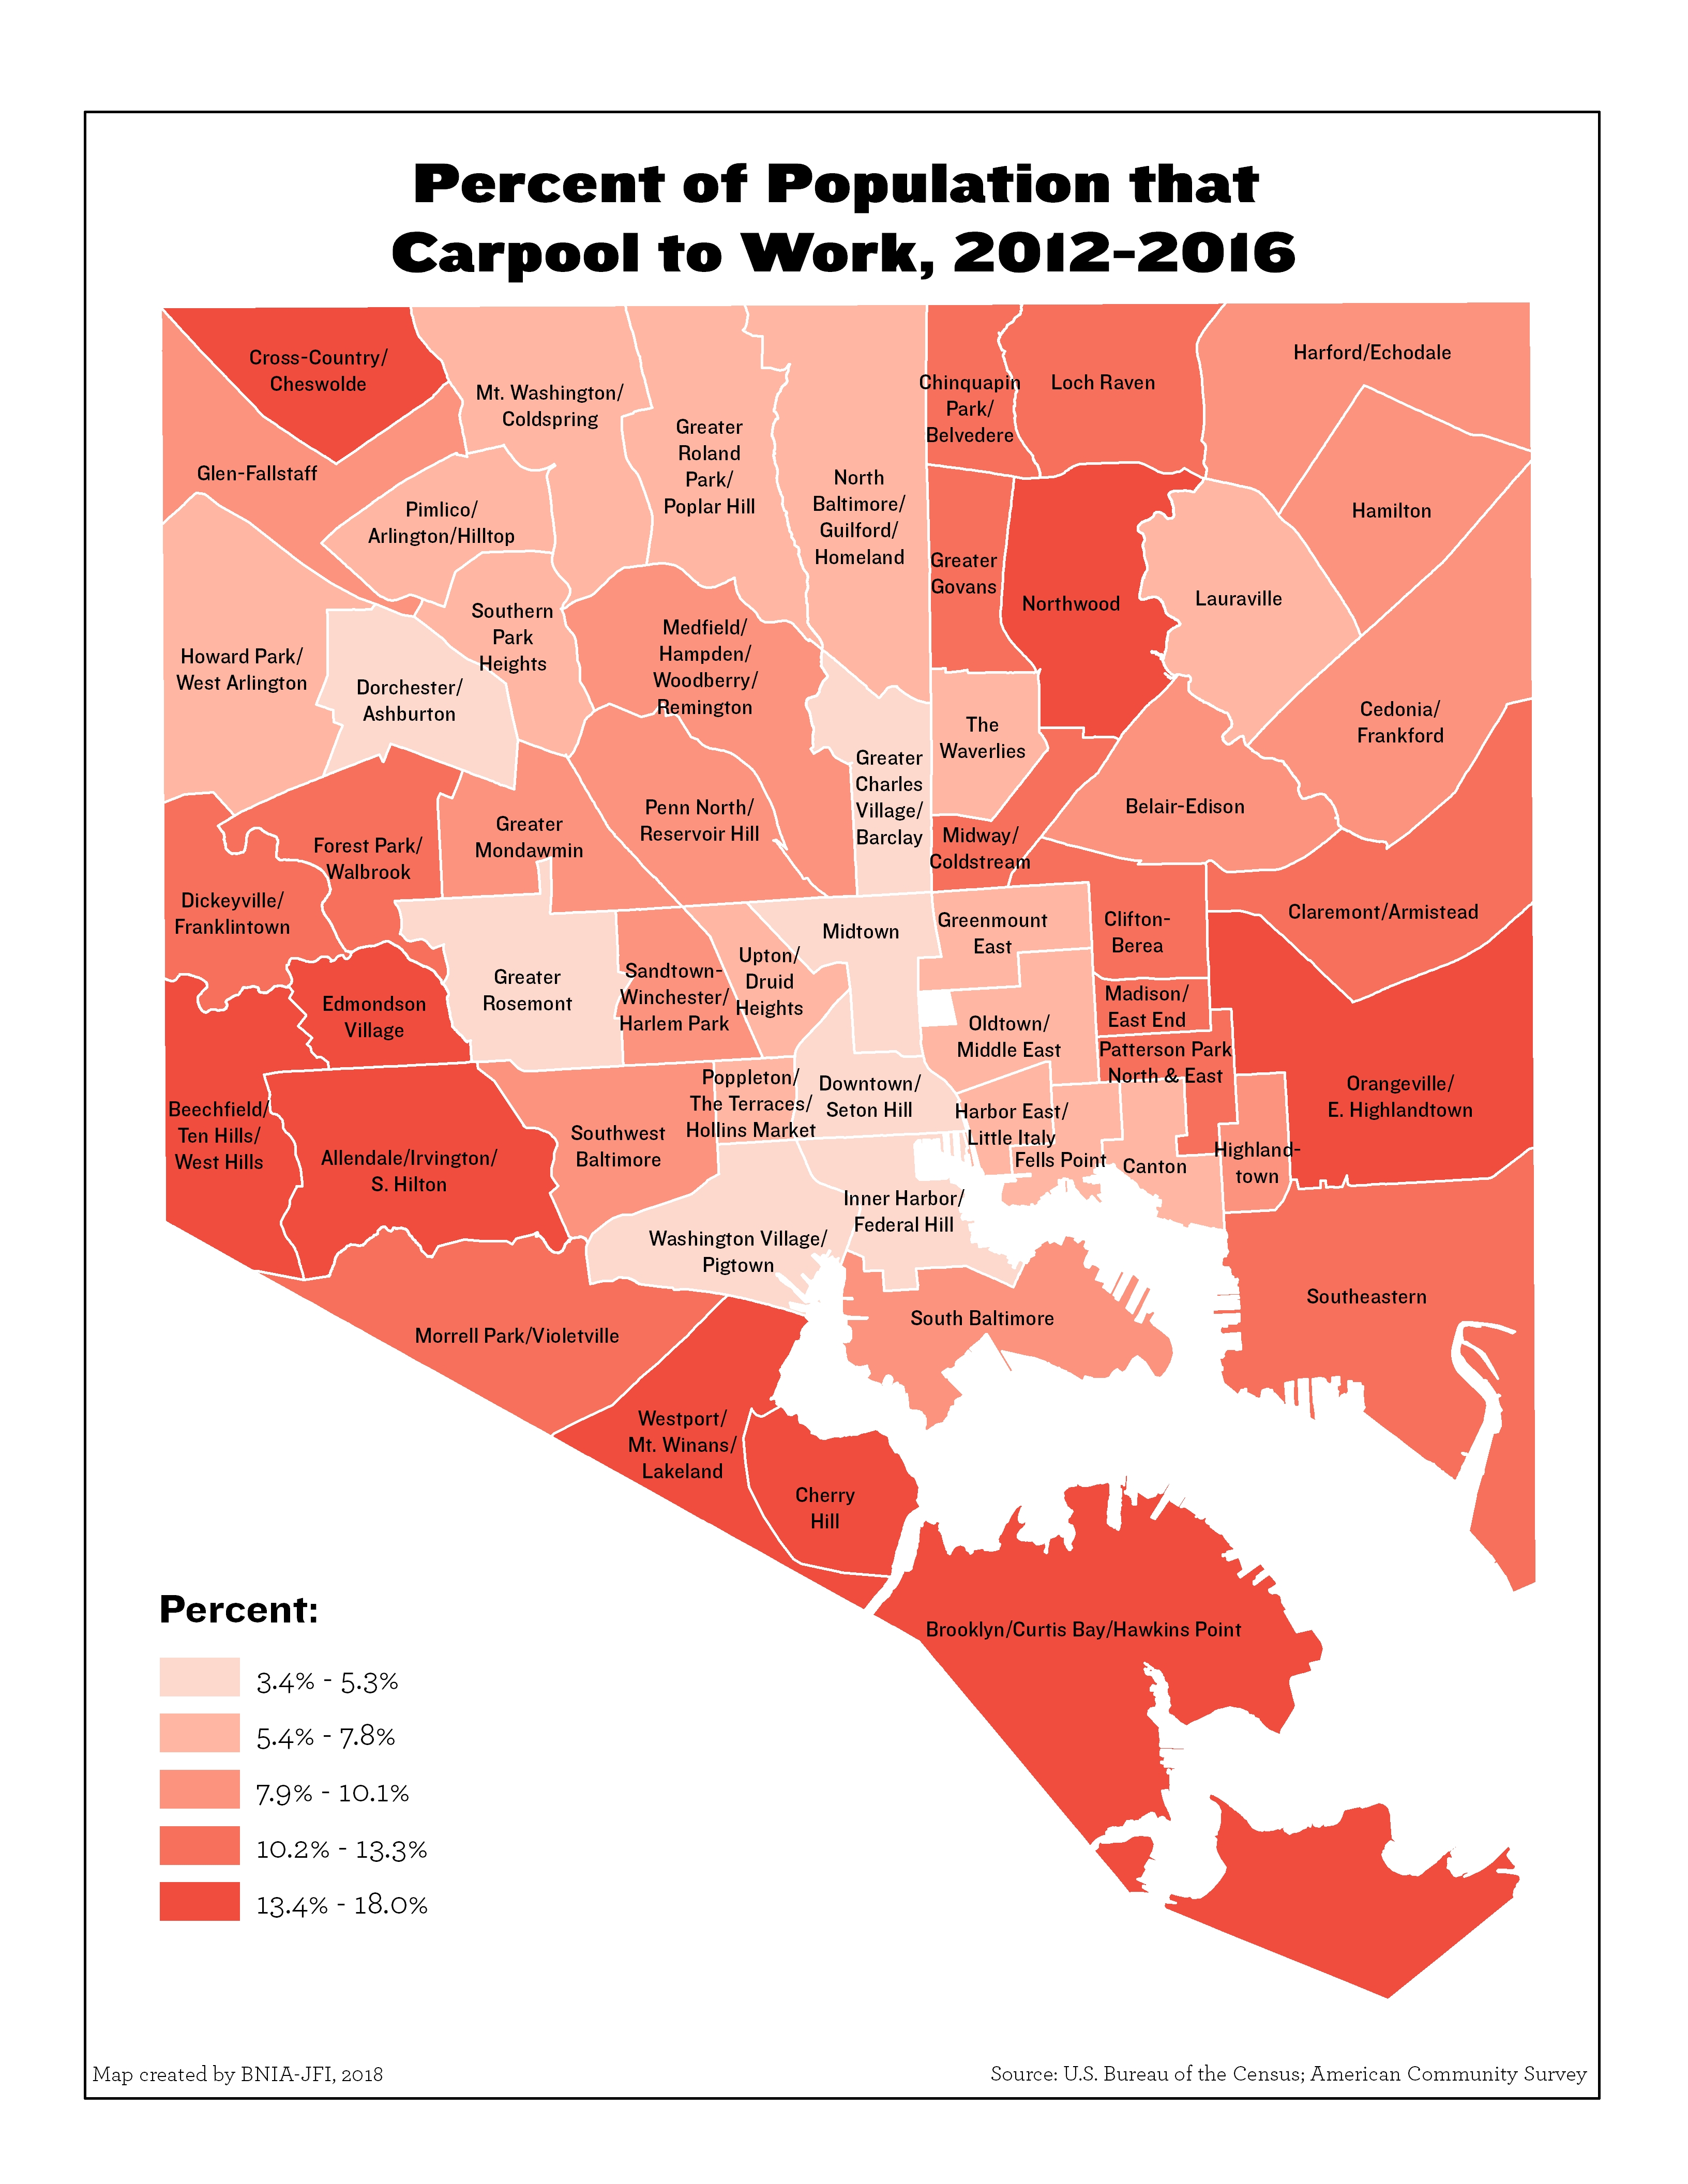
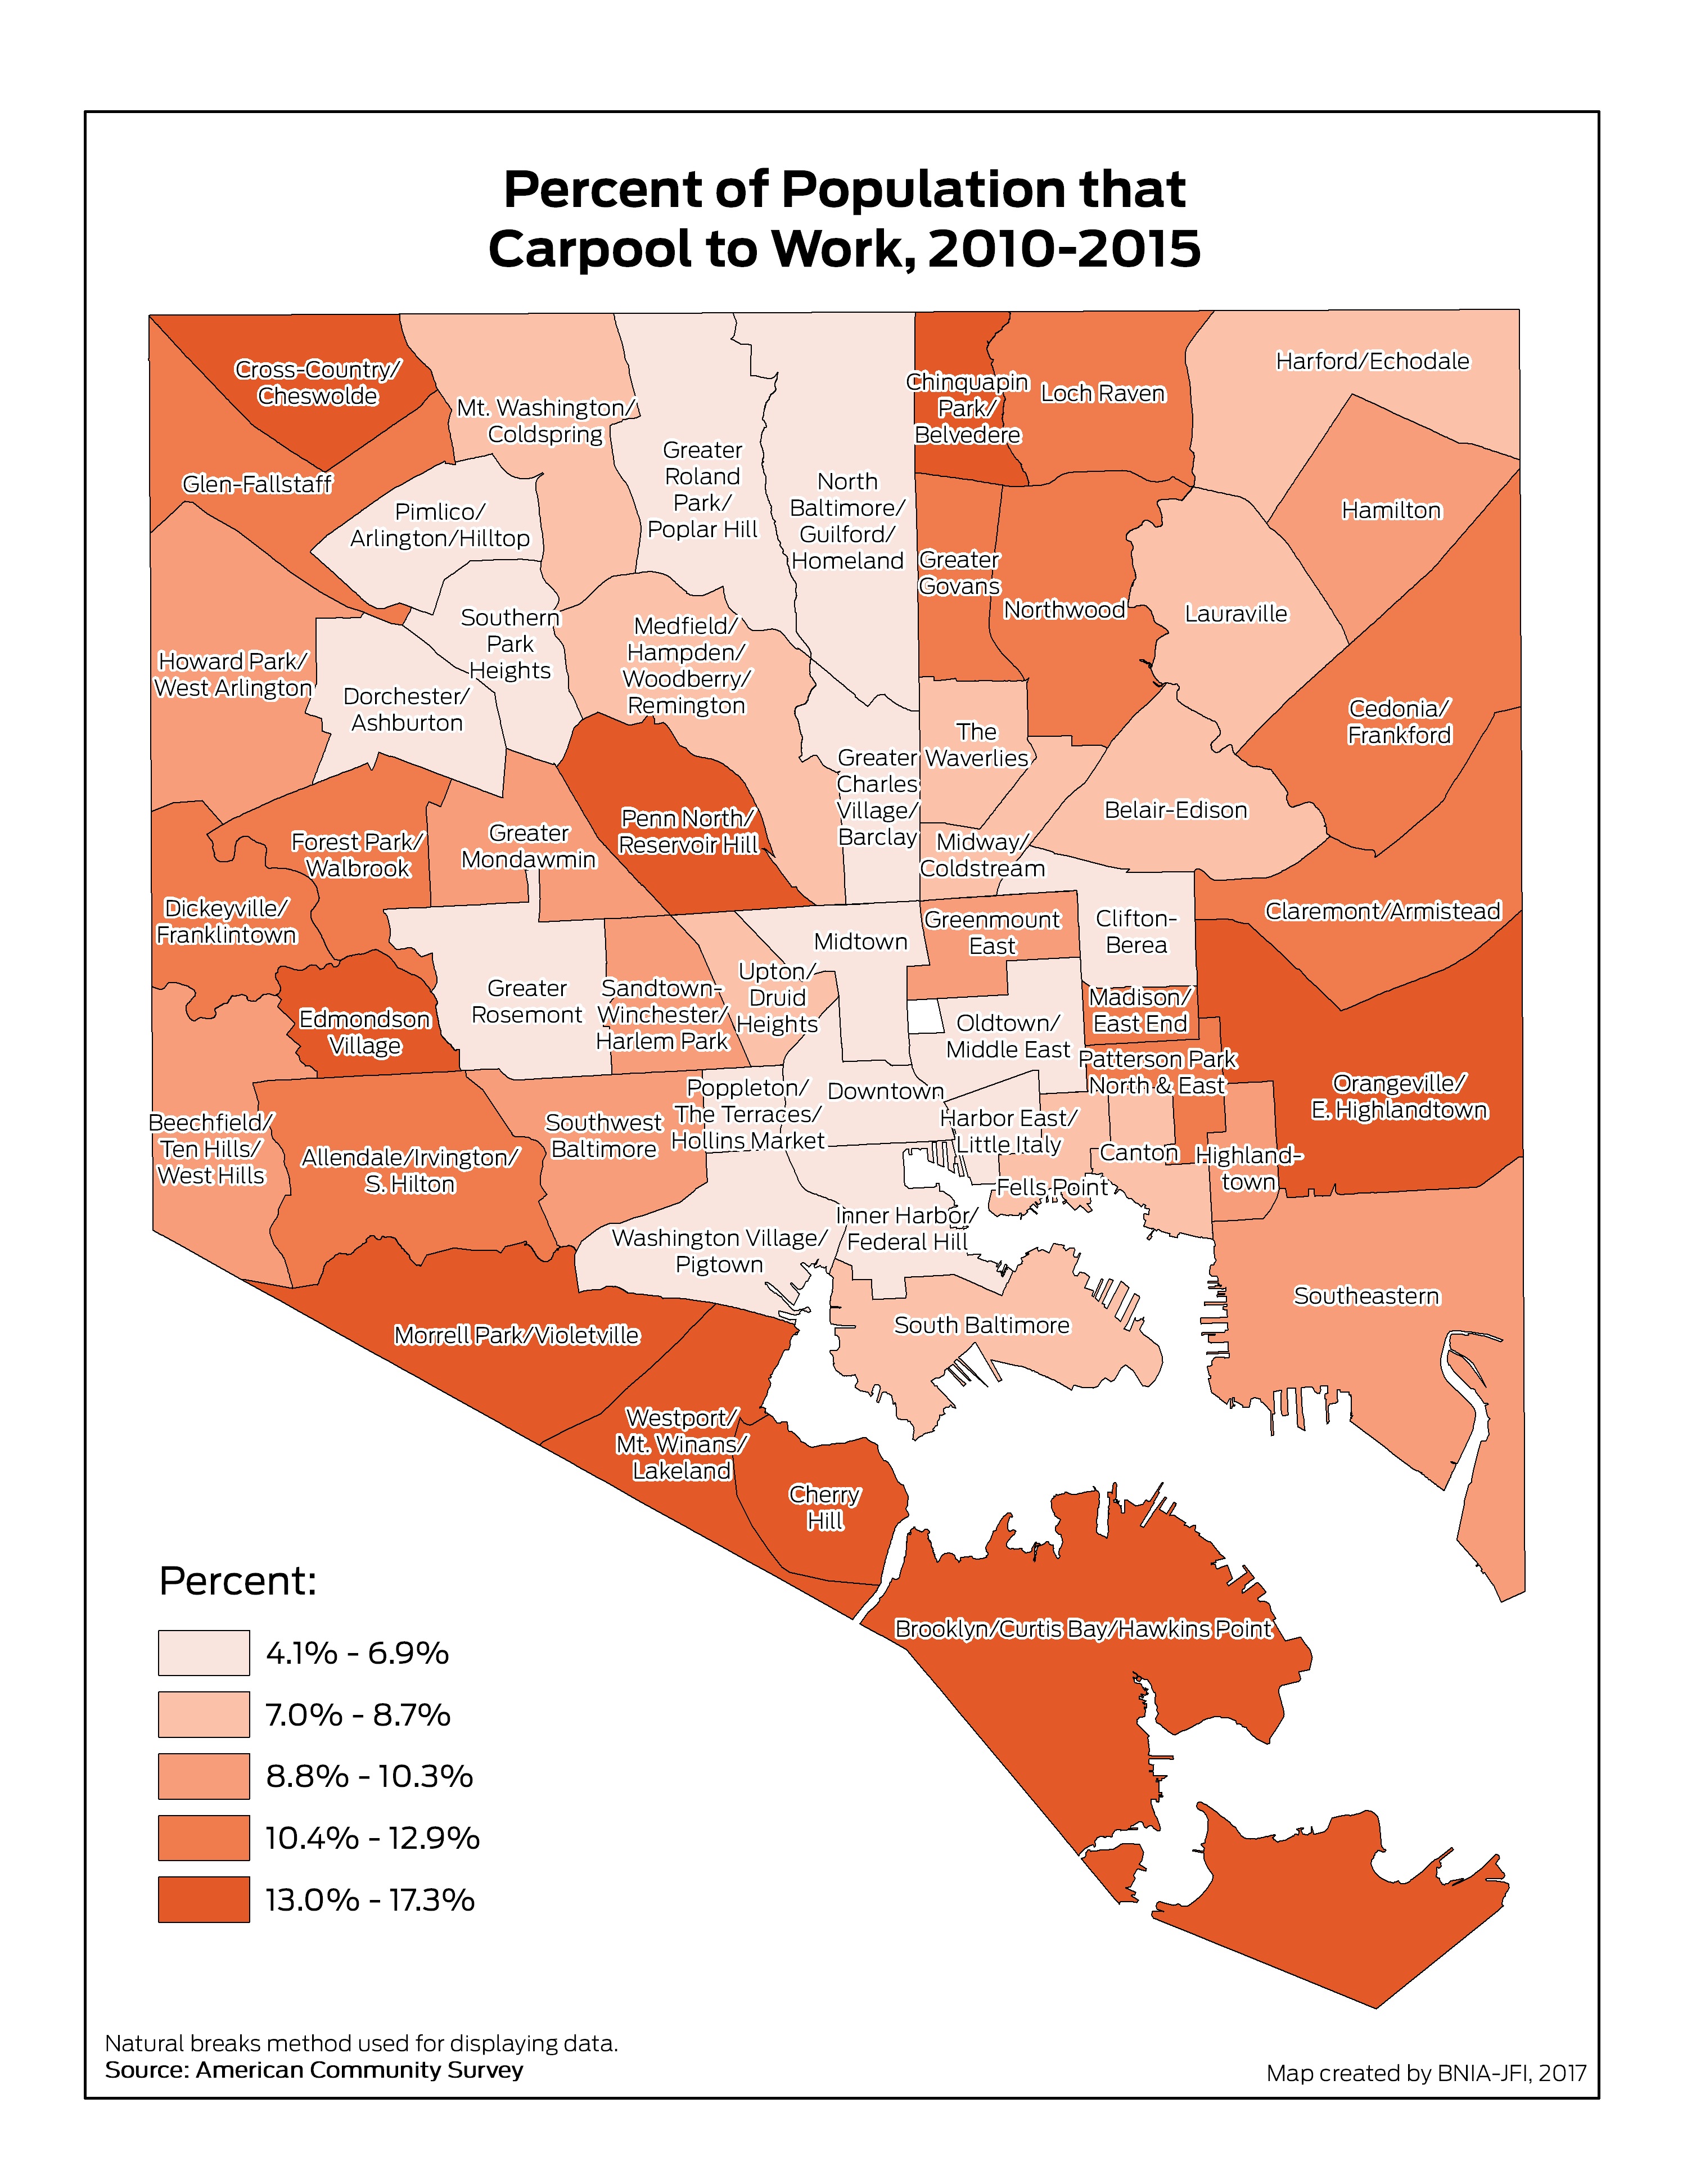
Percent of Population that Carpool to Work
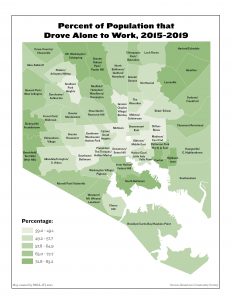
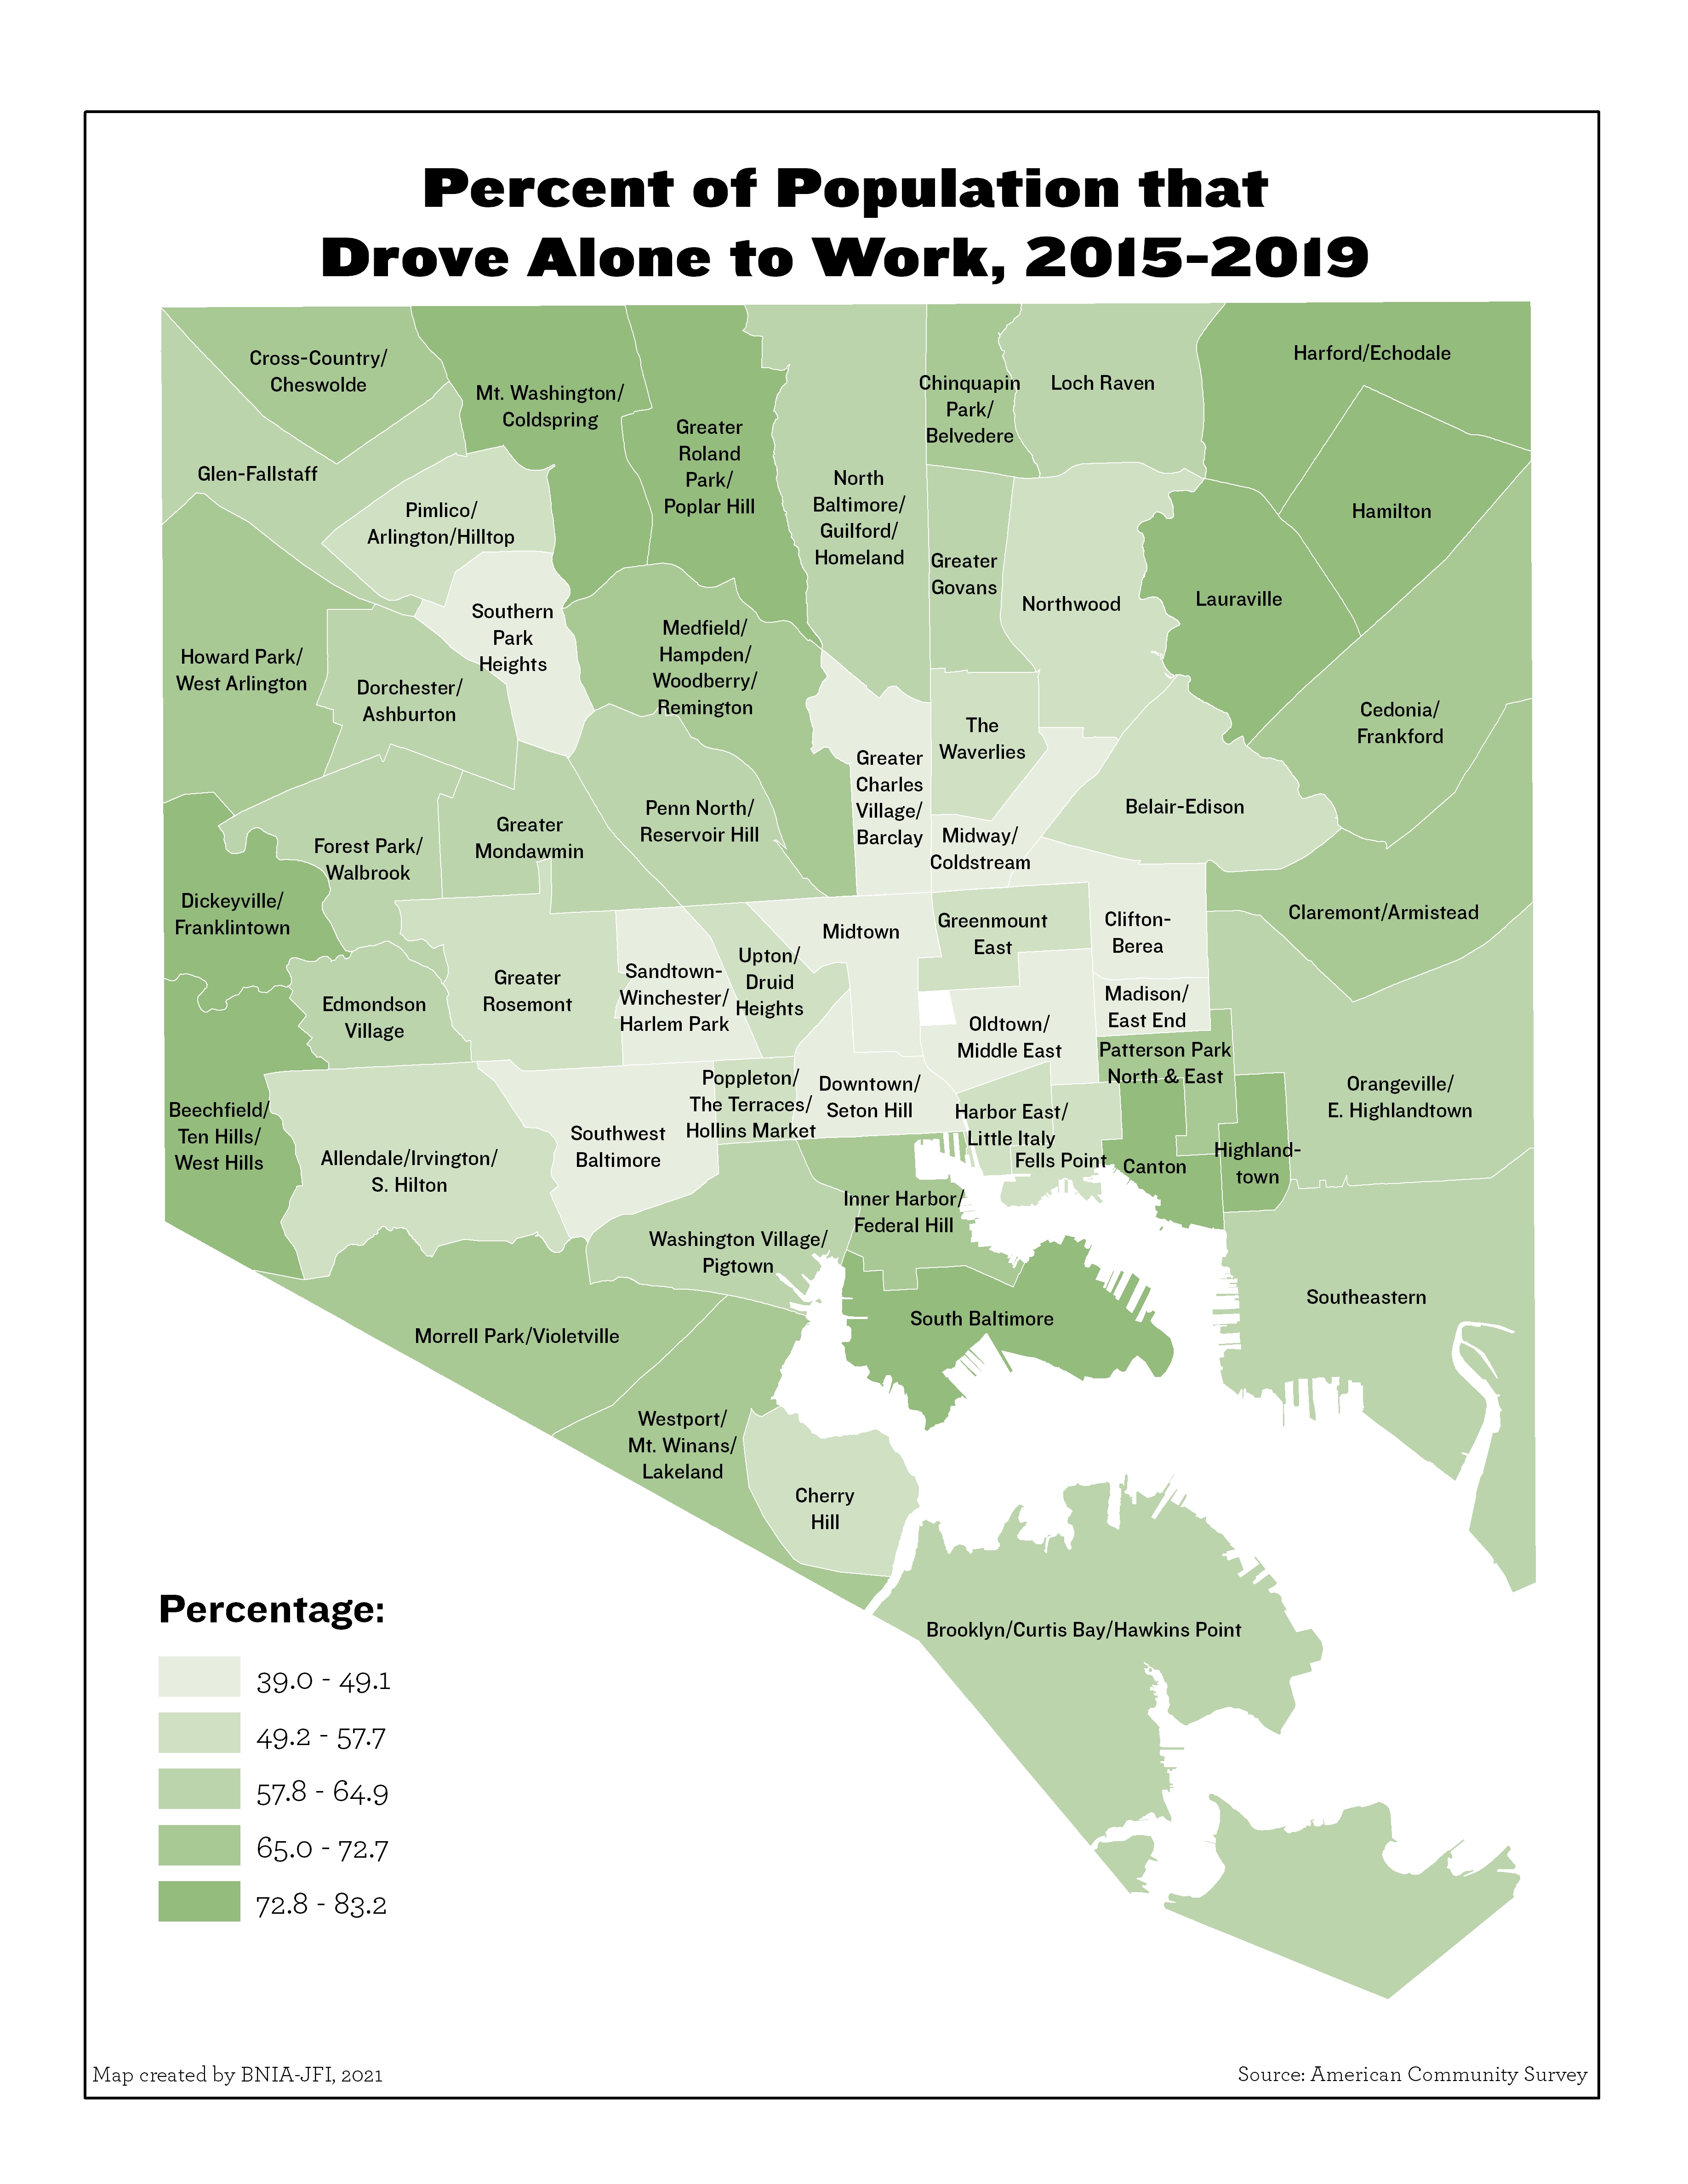
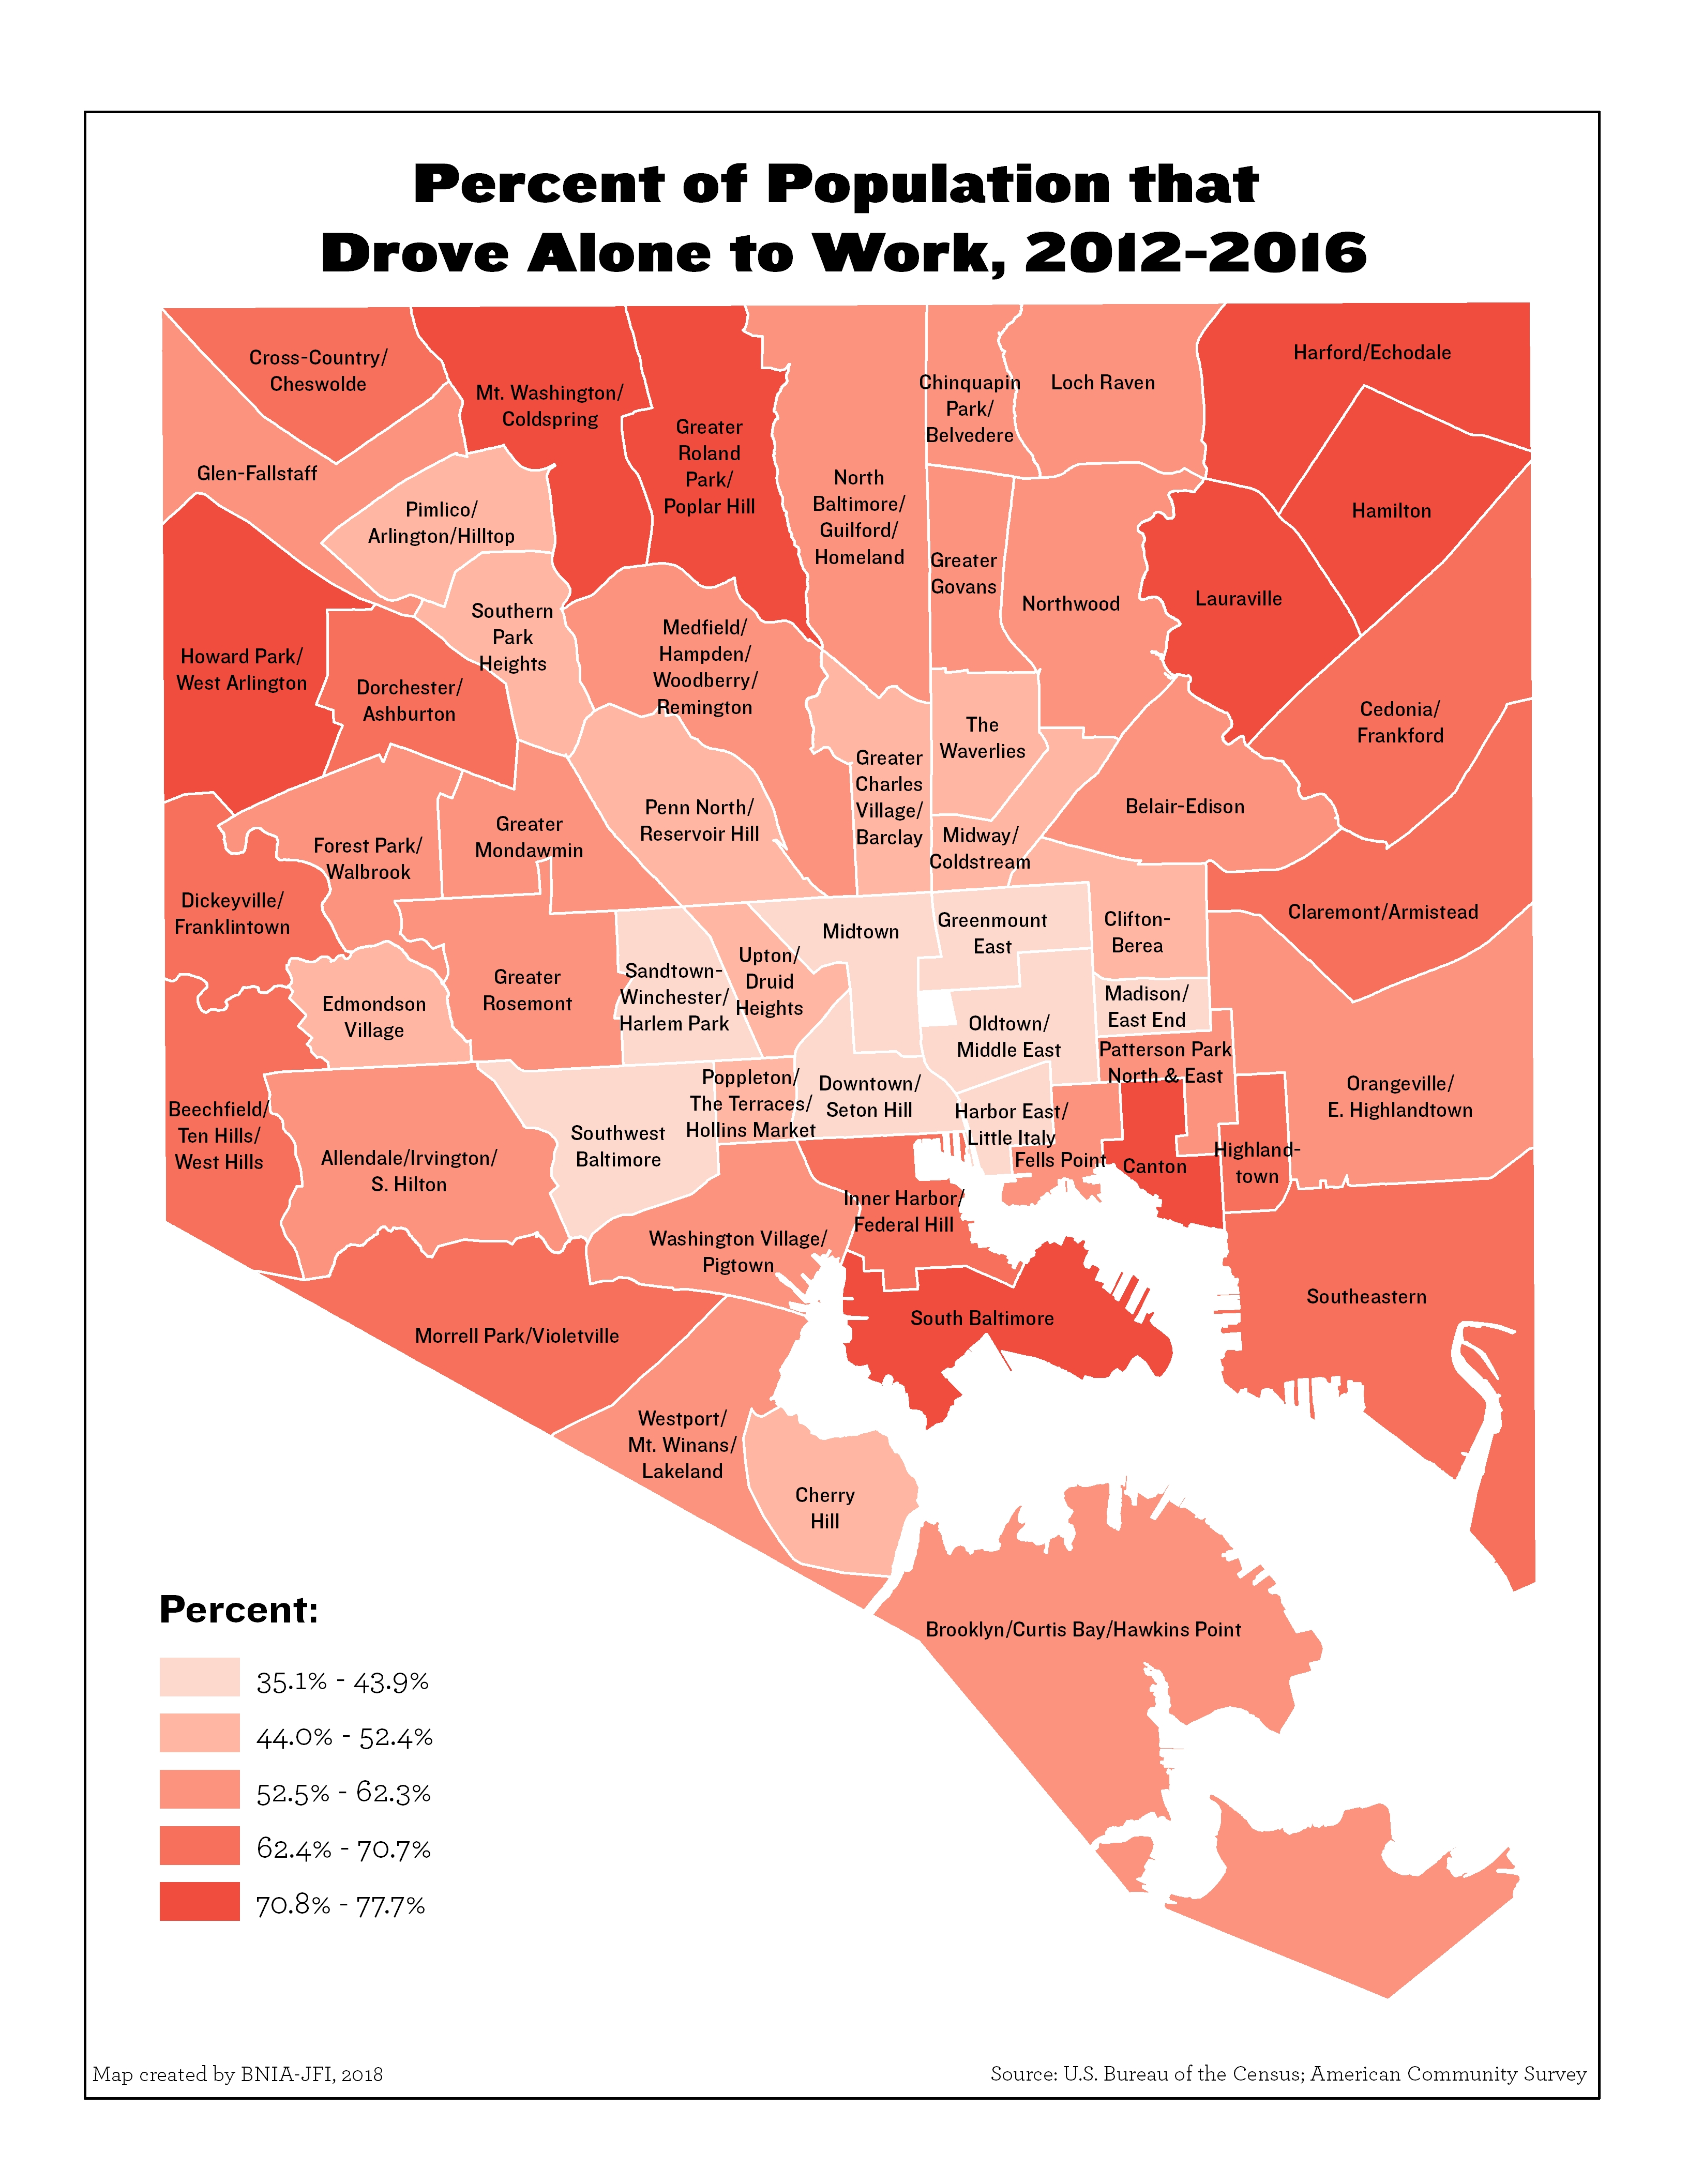
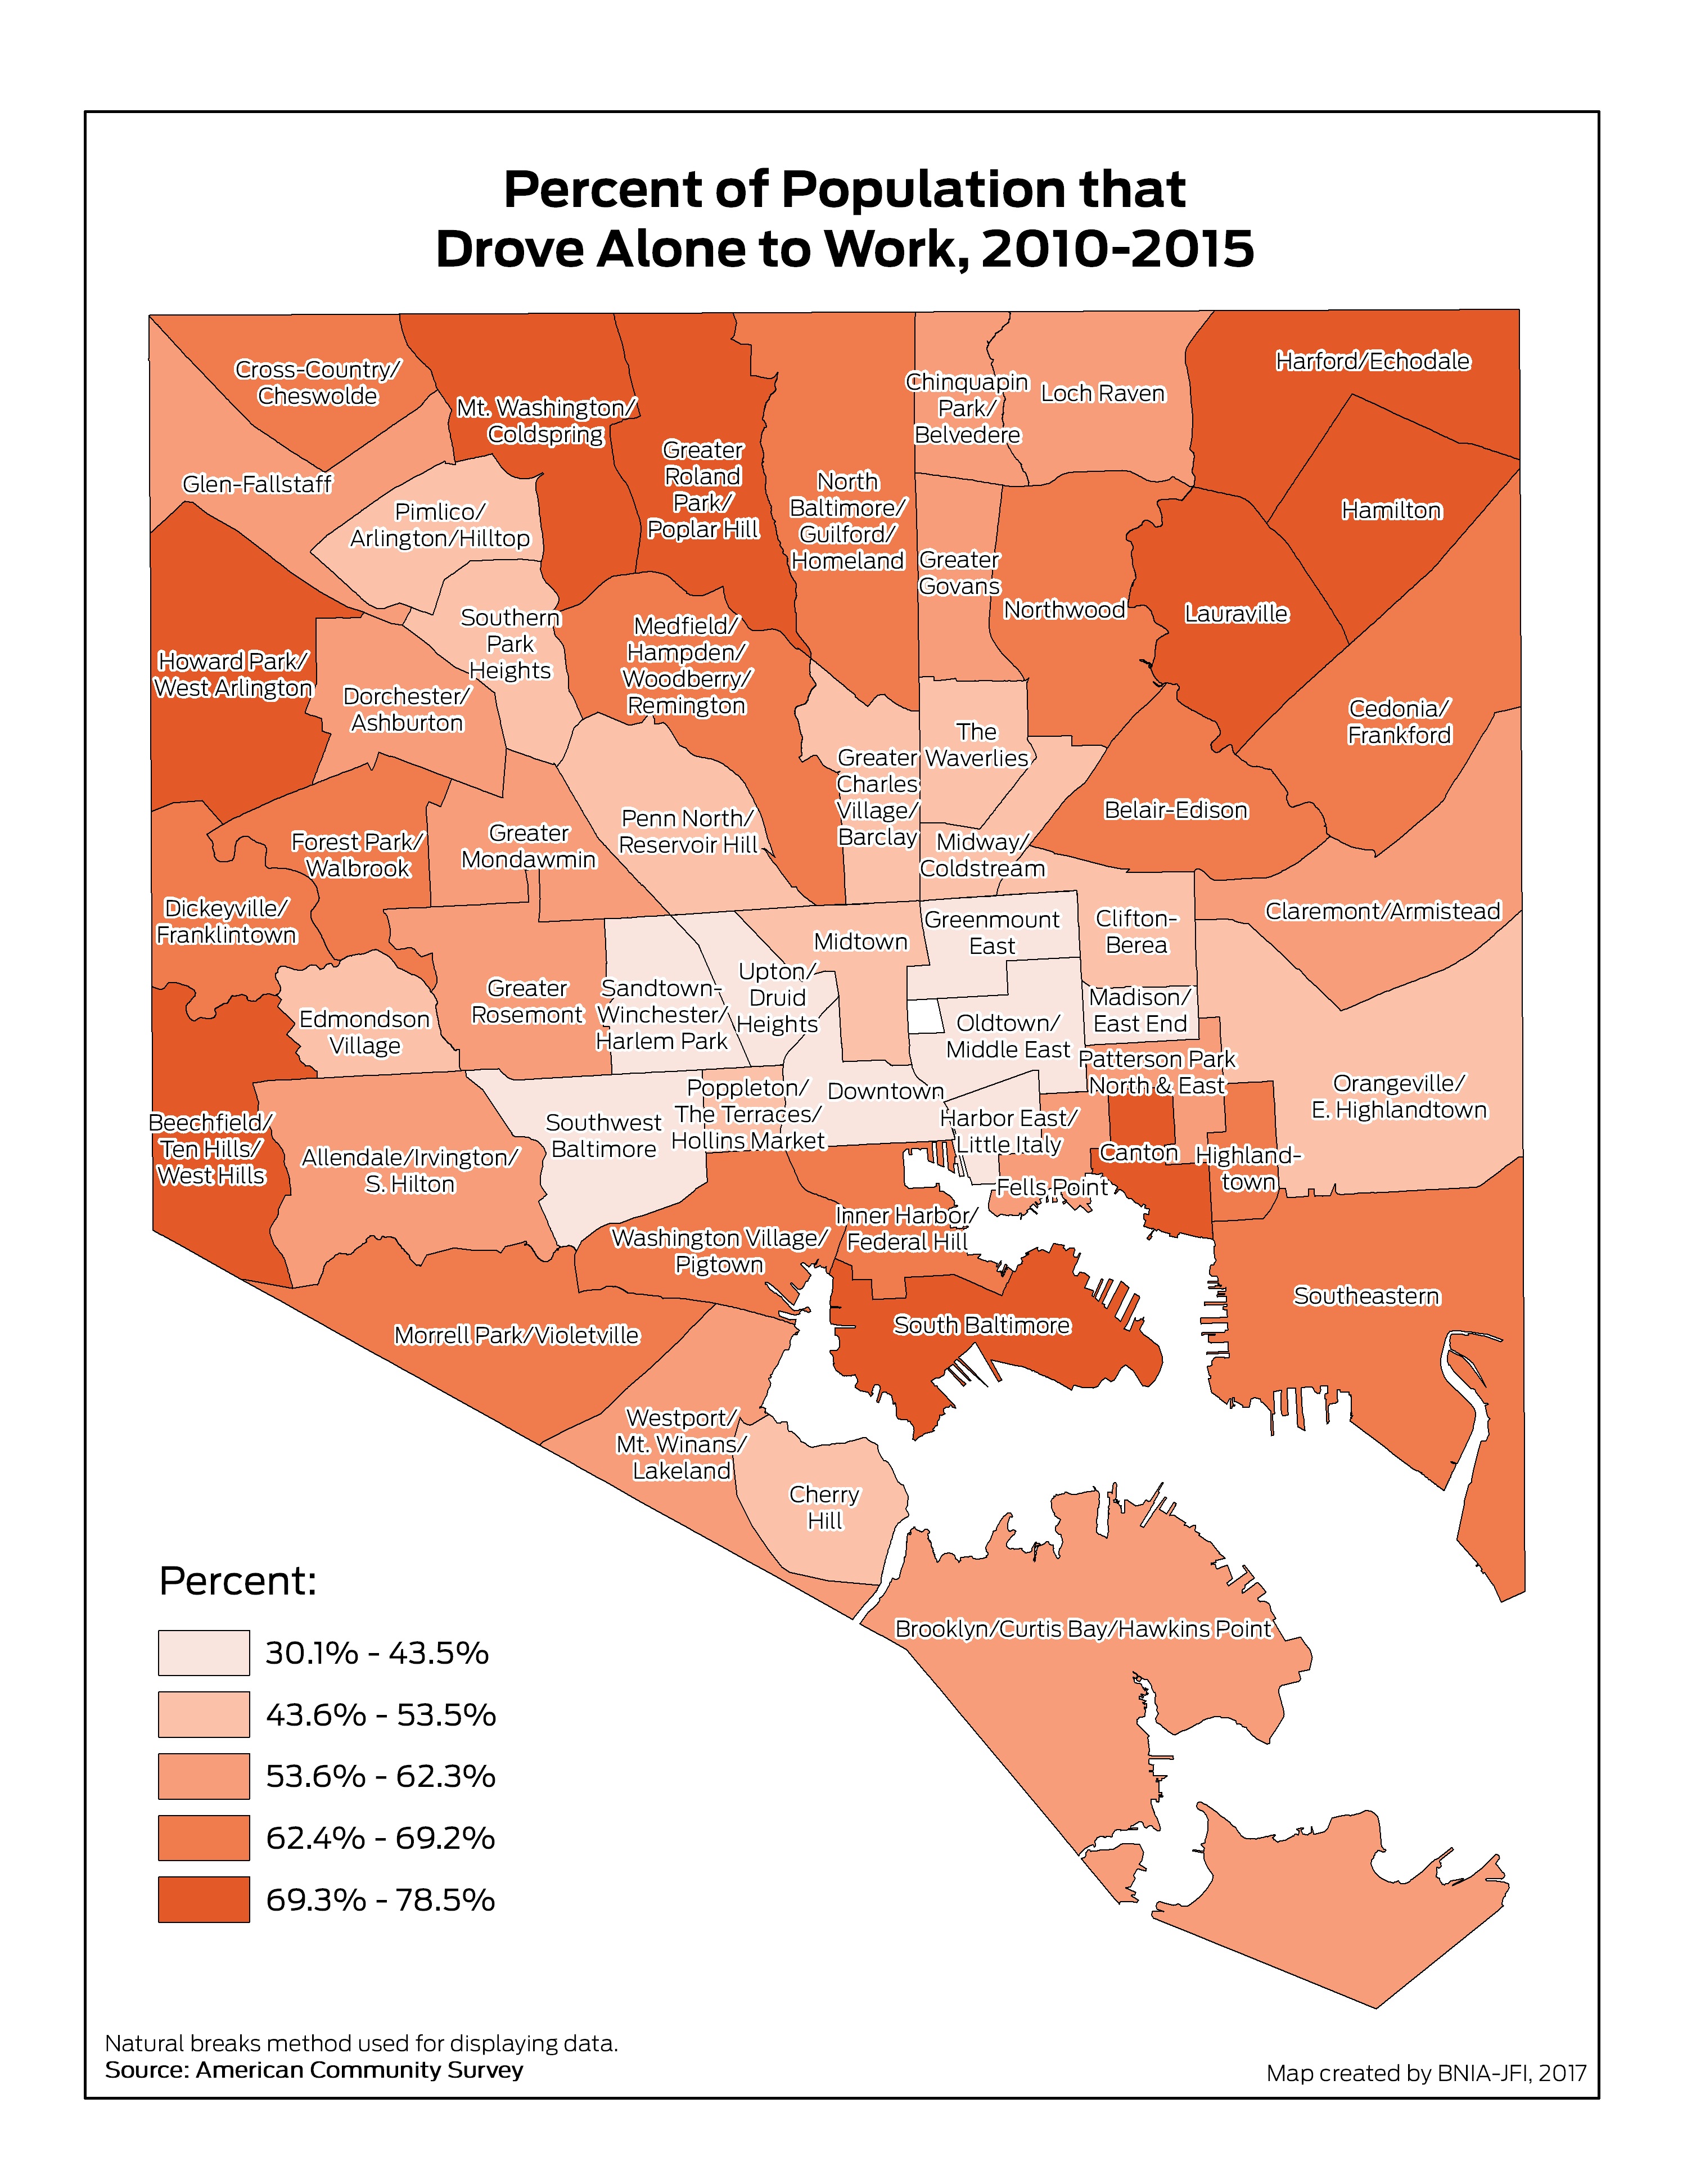
Percent of Population that Drove Alone to Work
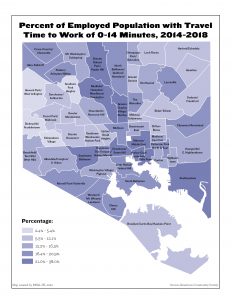
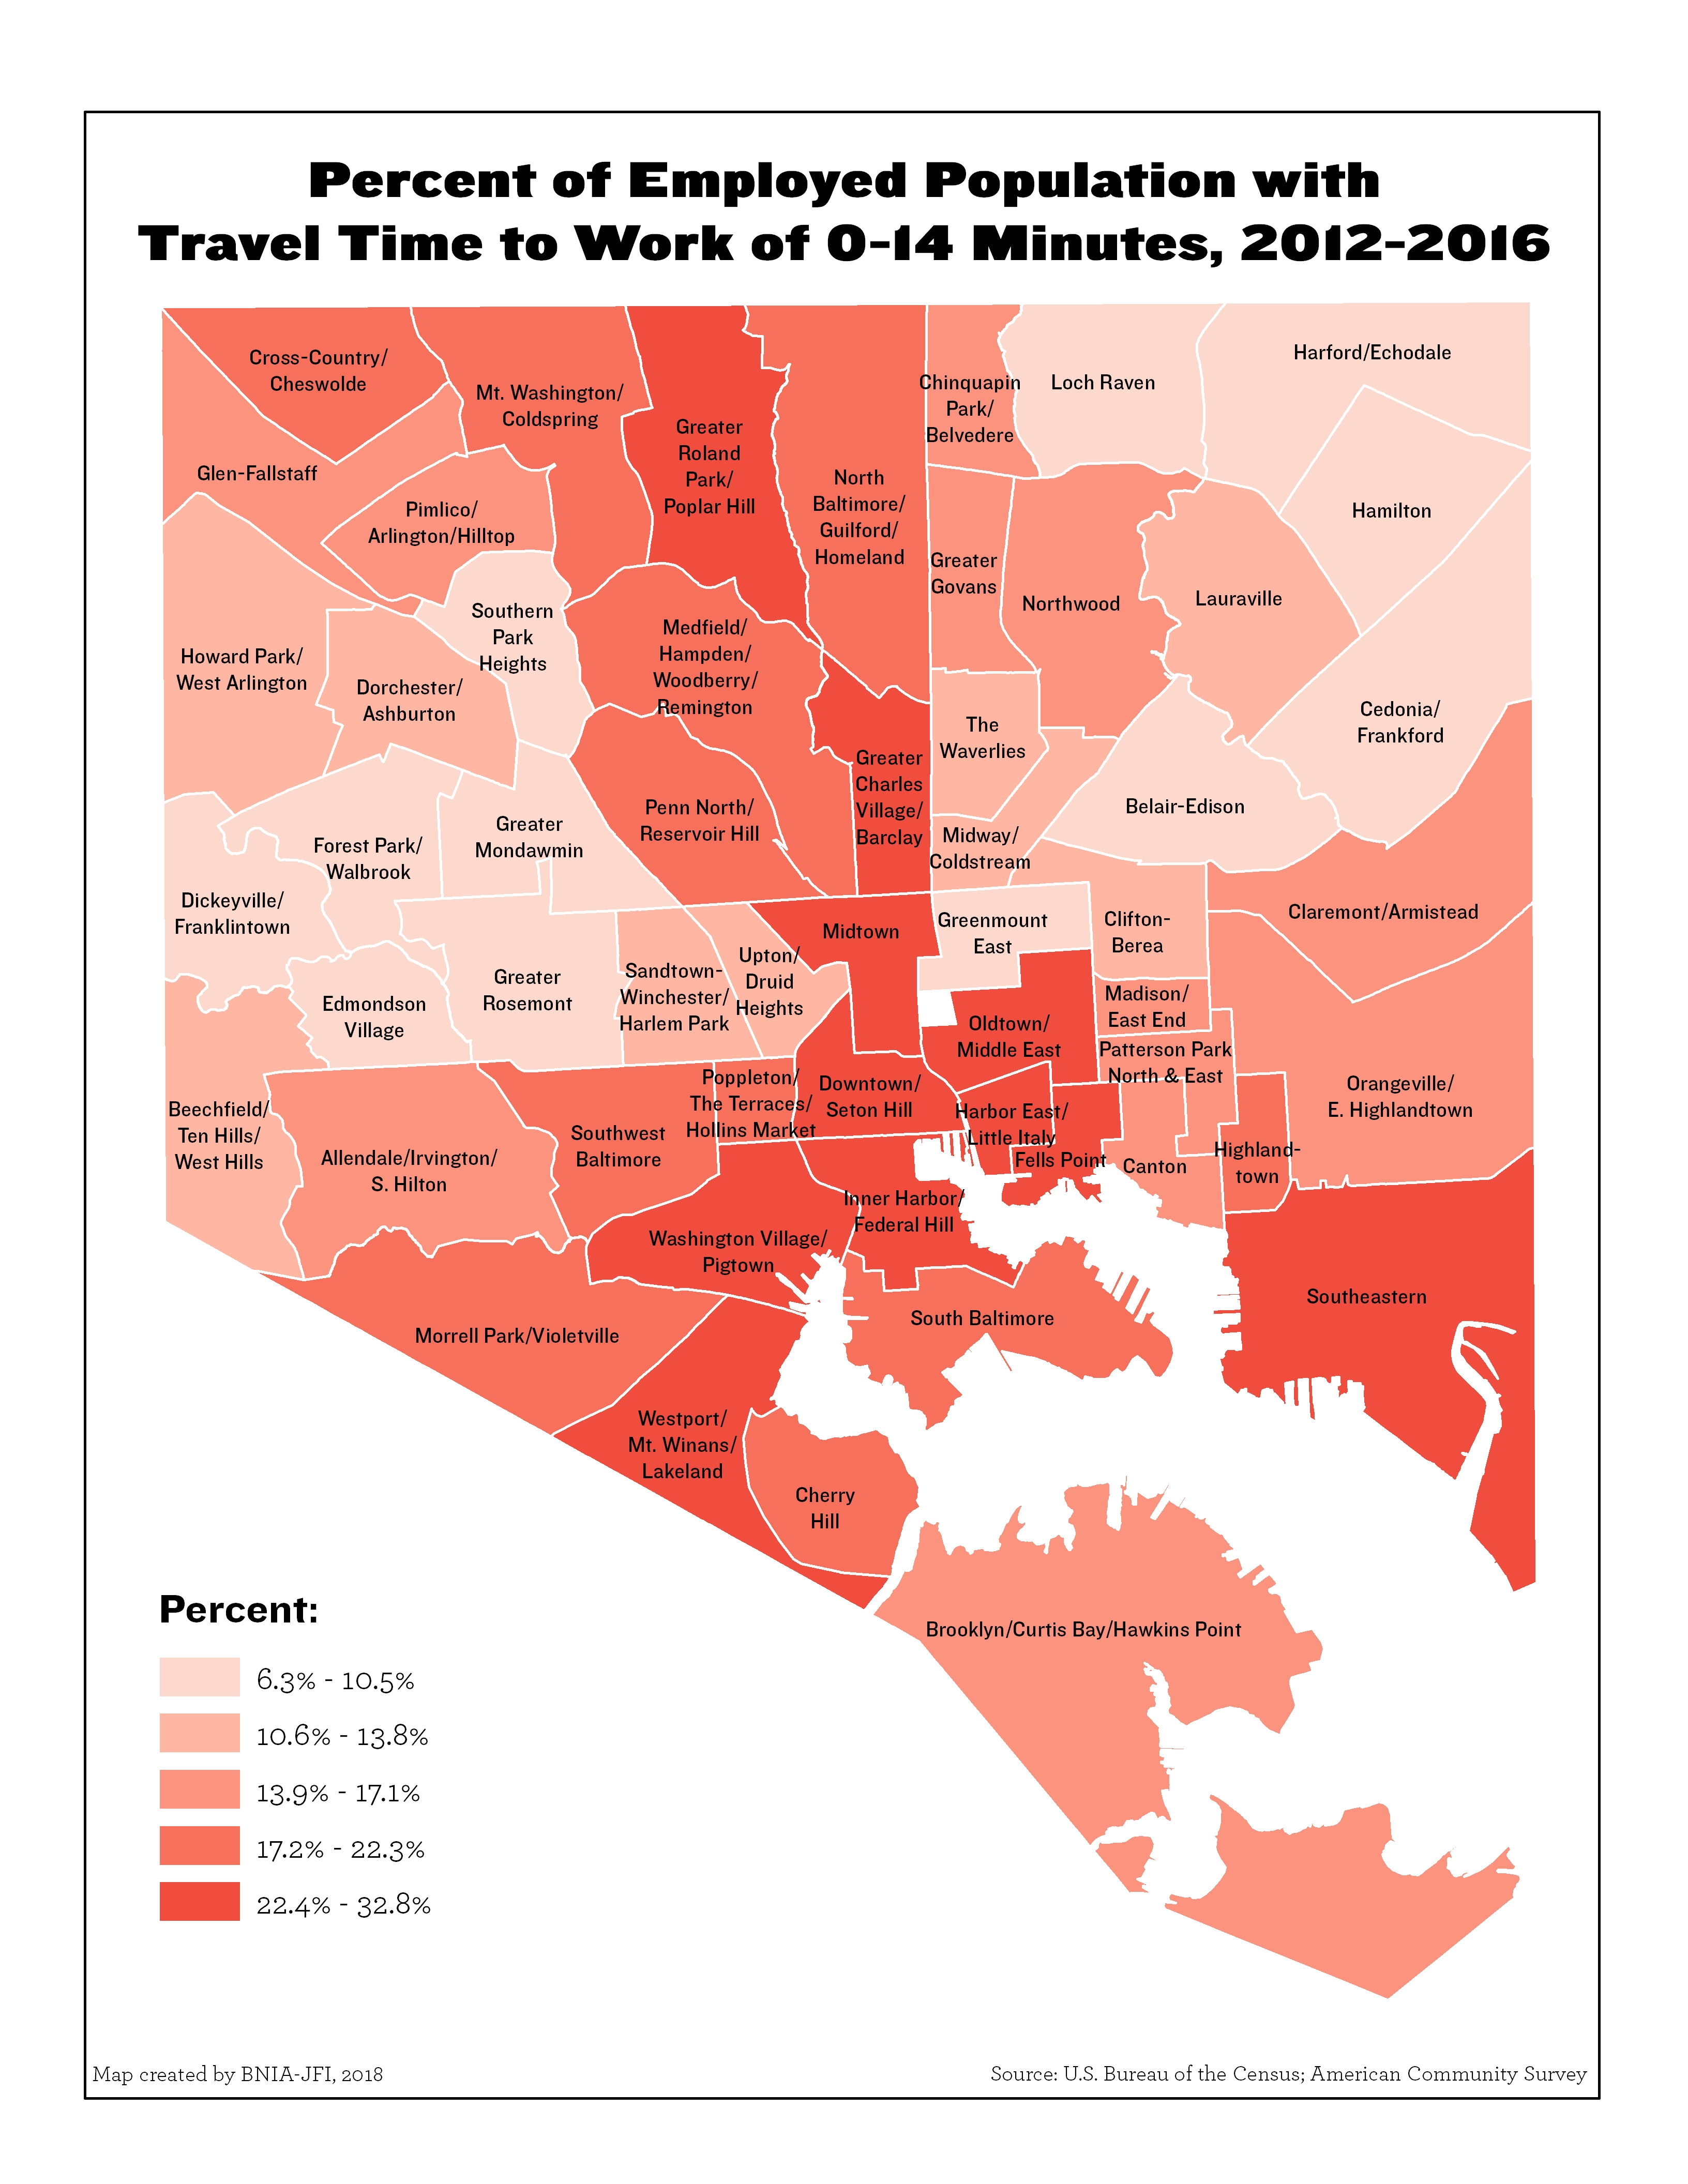
Percent of Employed Population with Travel Time to Work of 0-14 Minutes
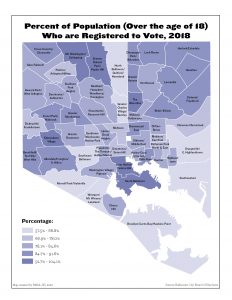
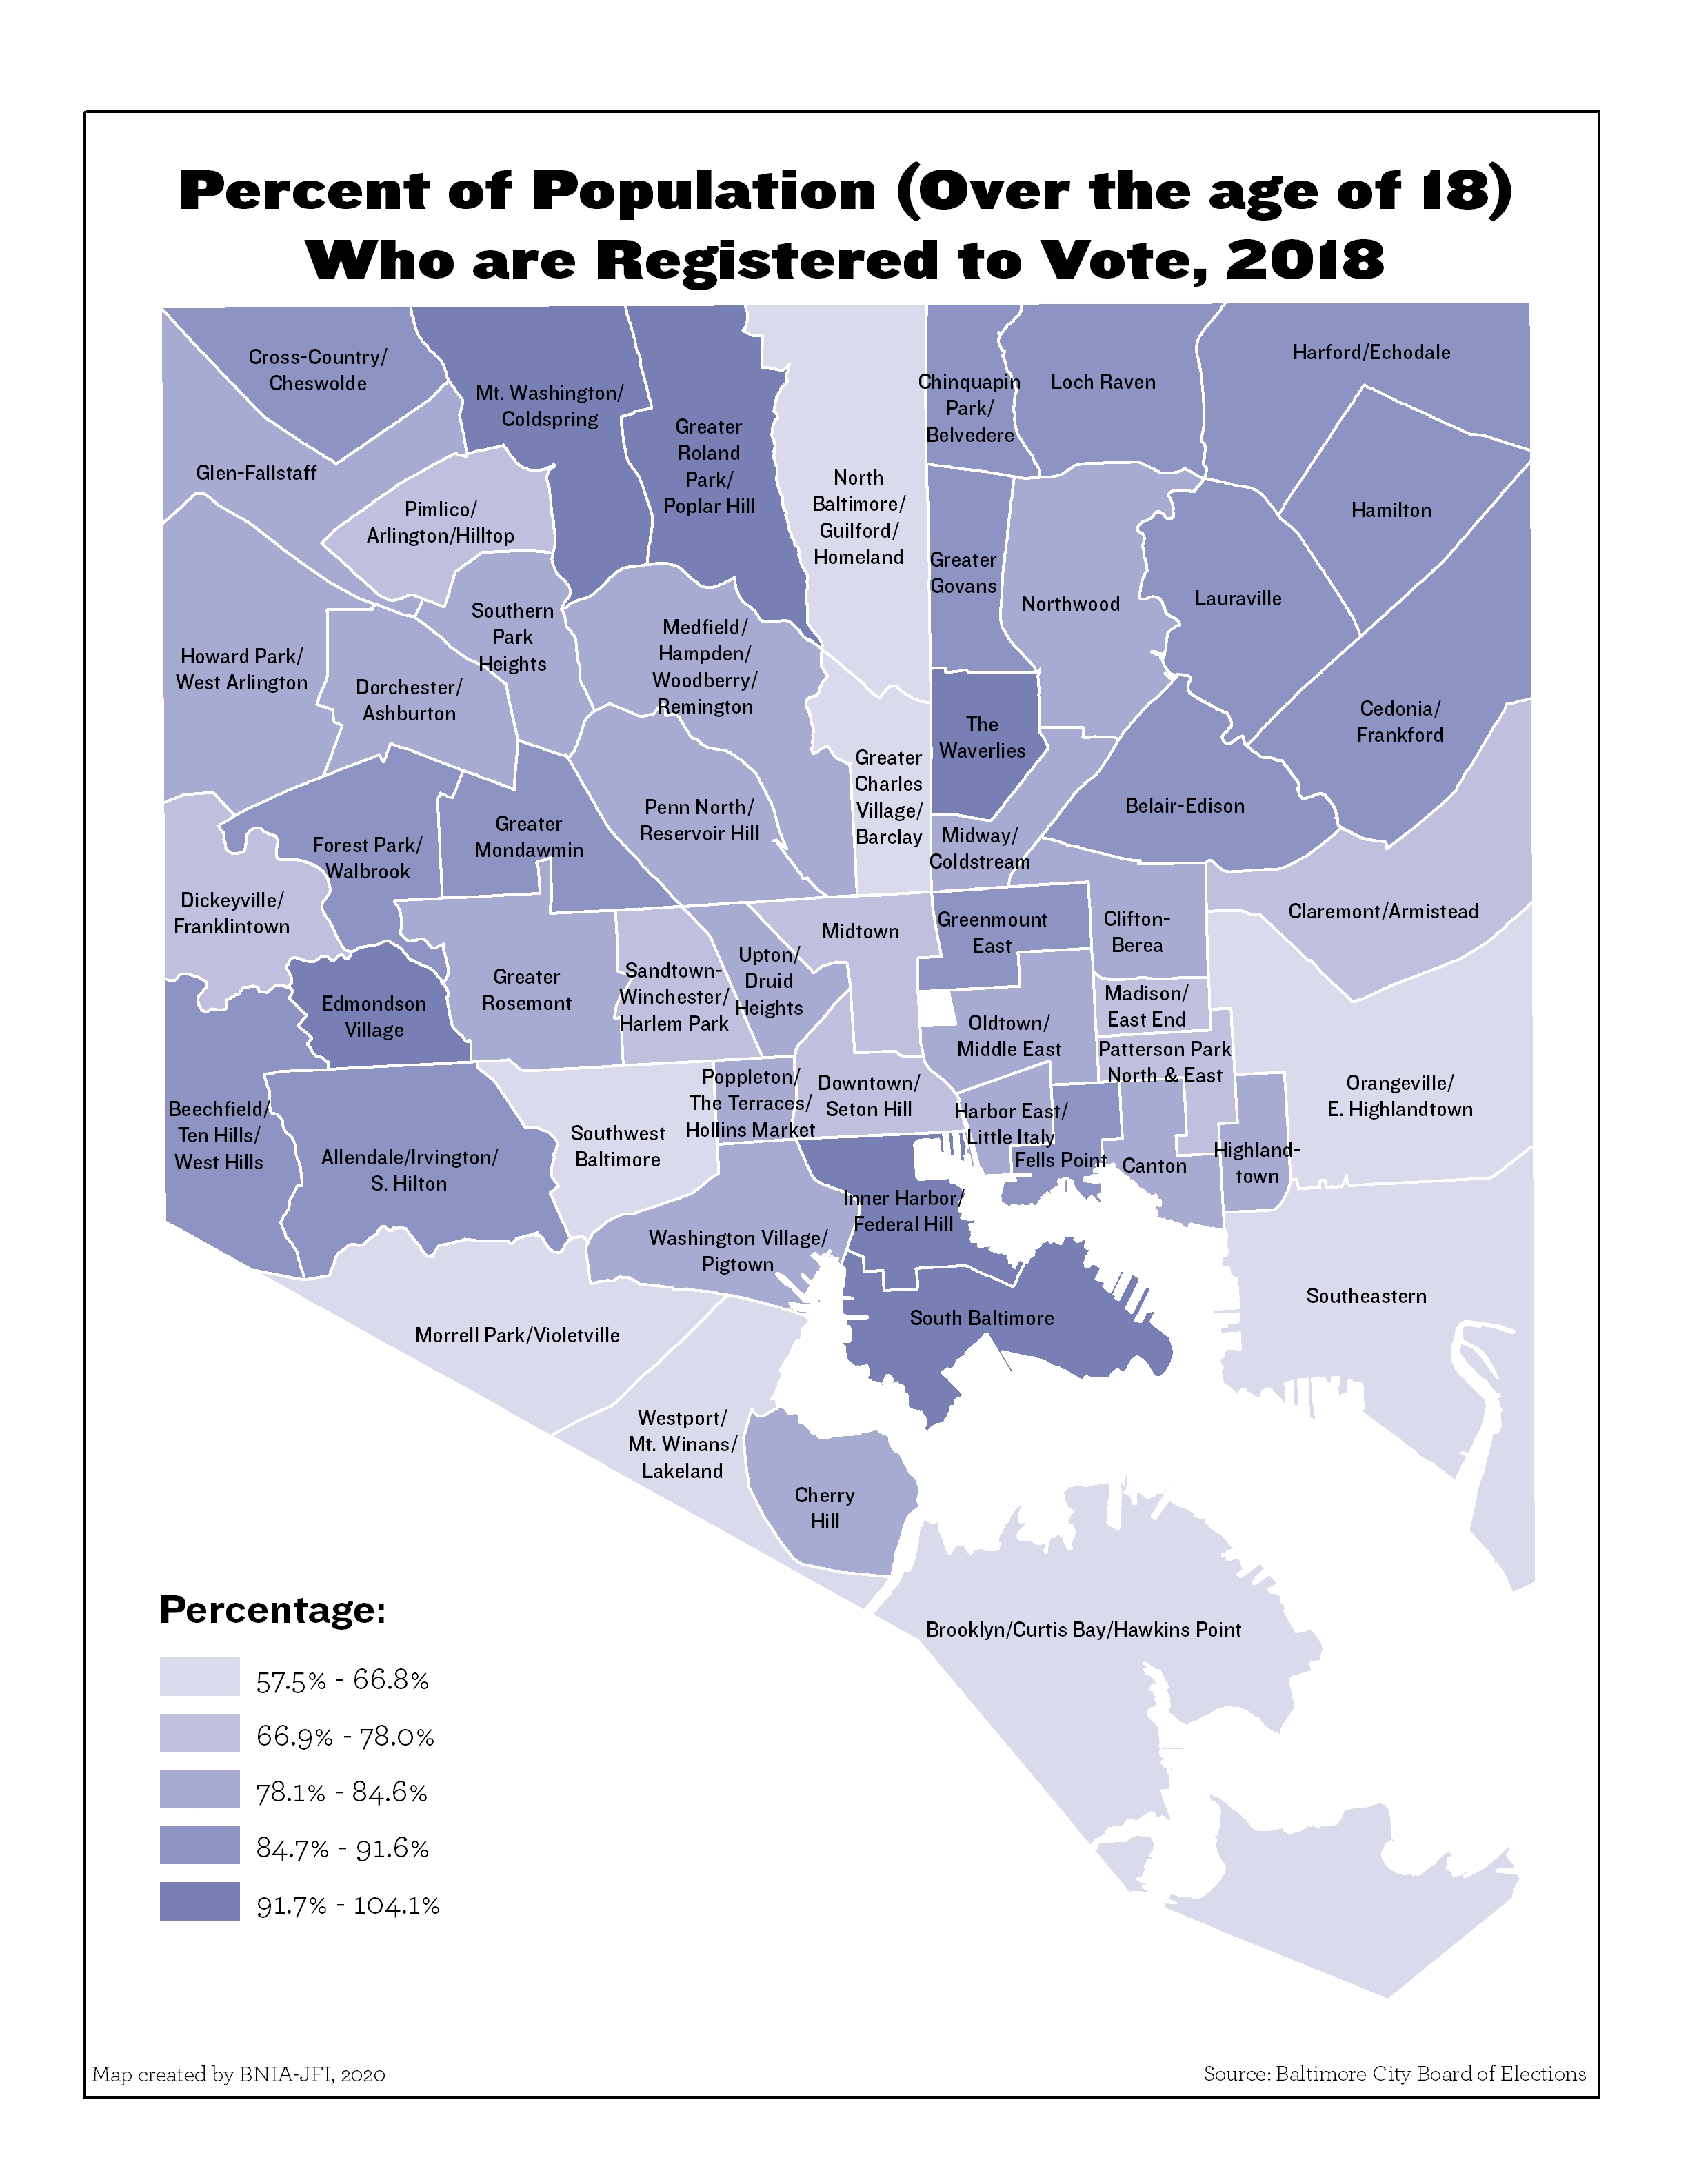
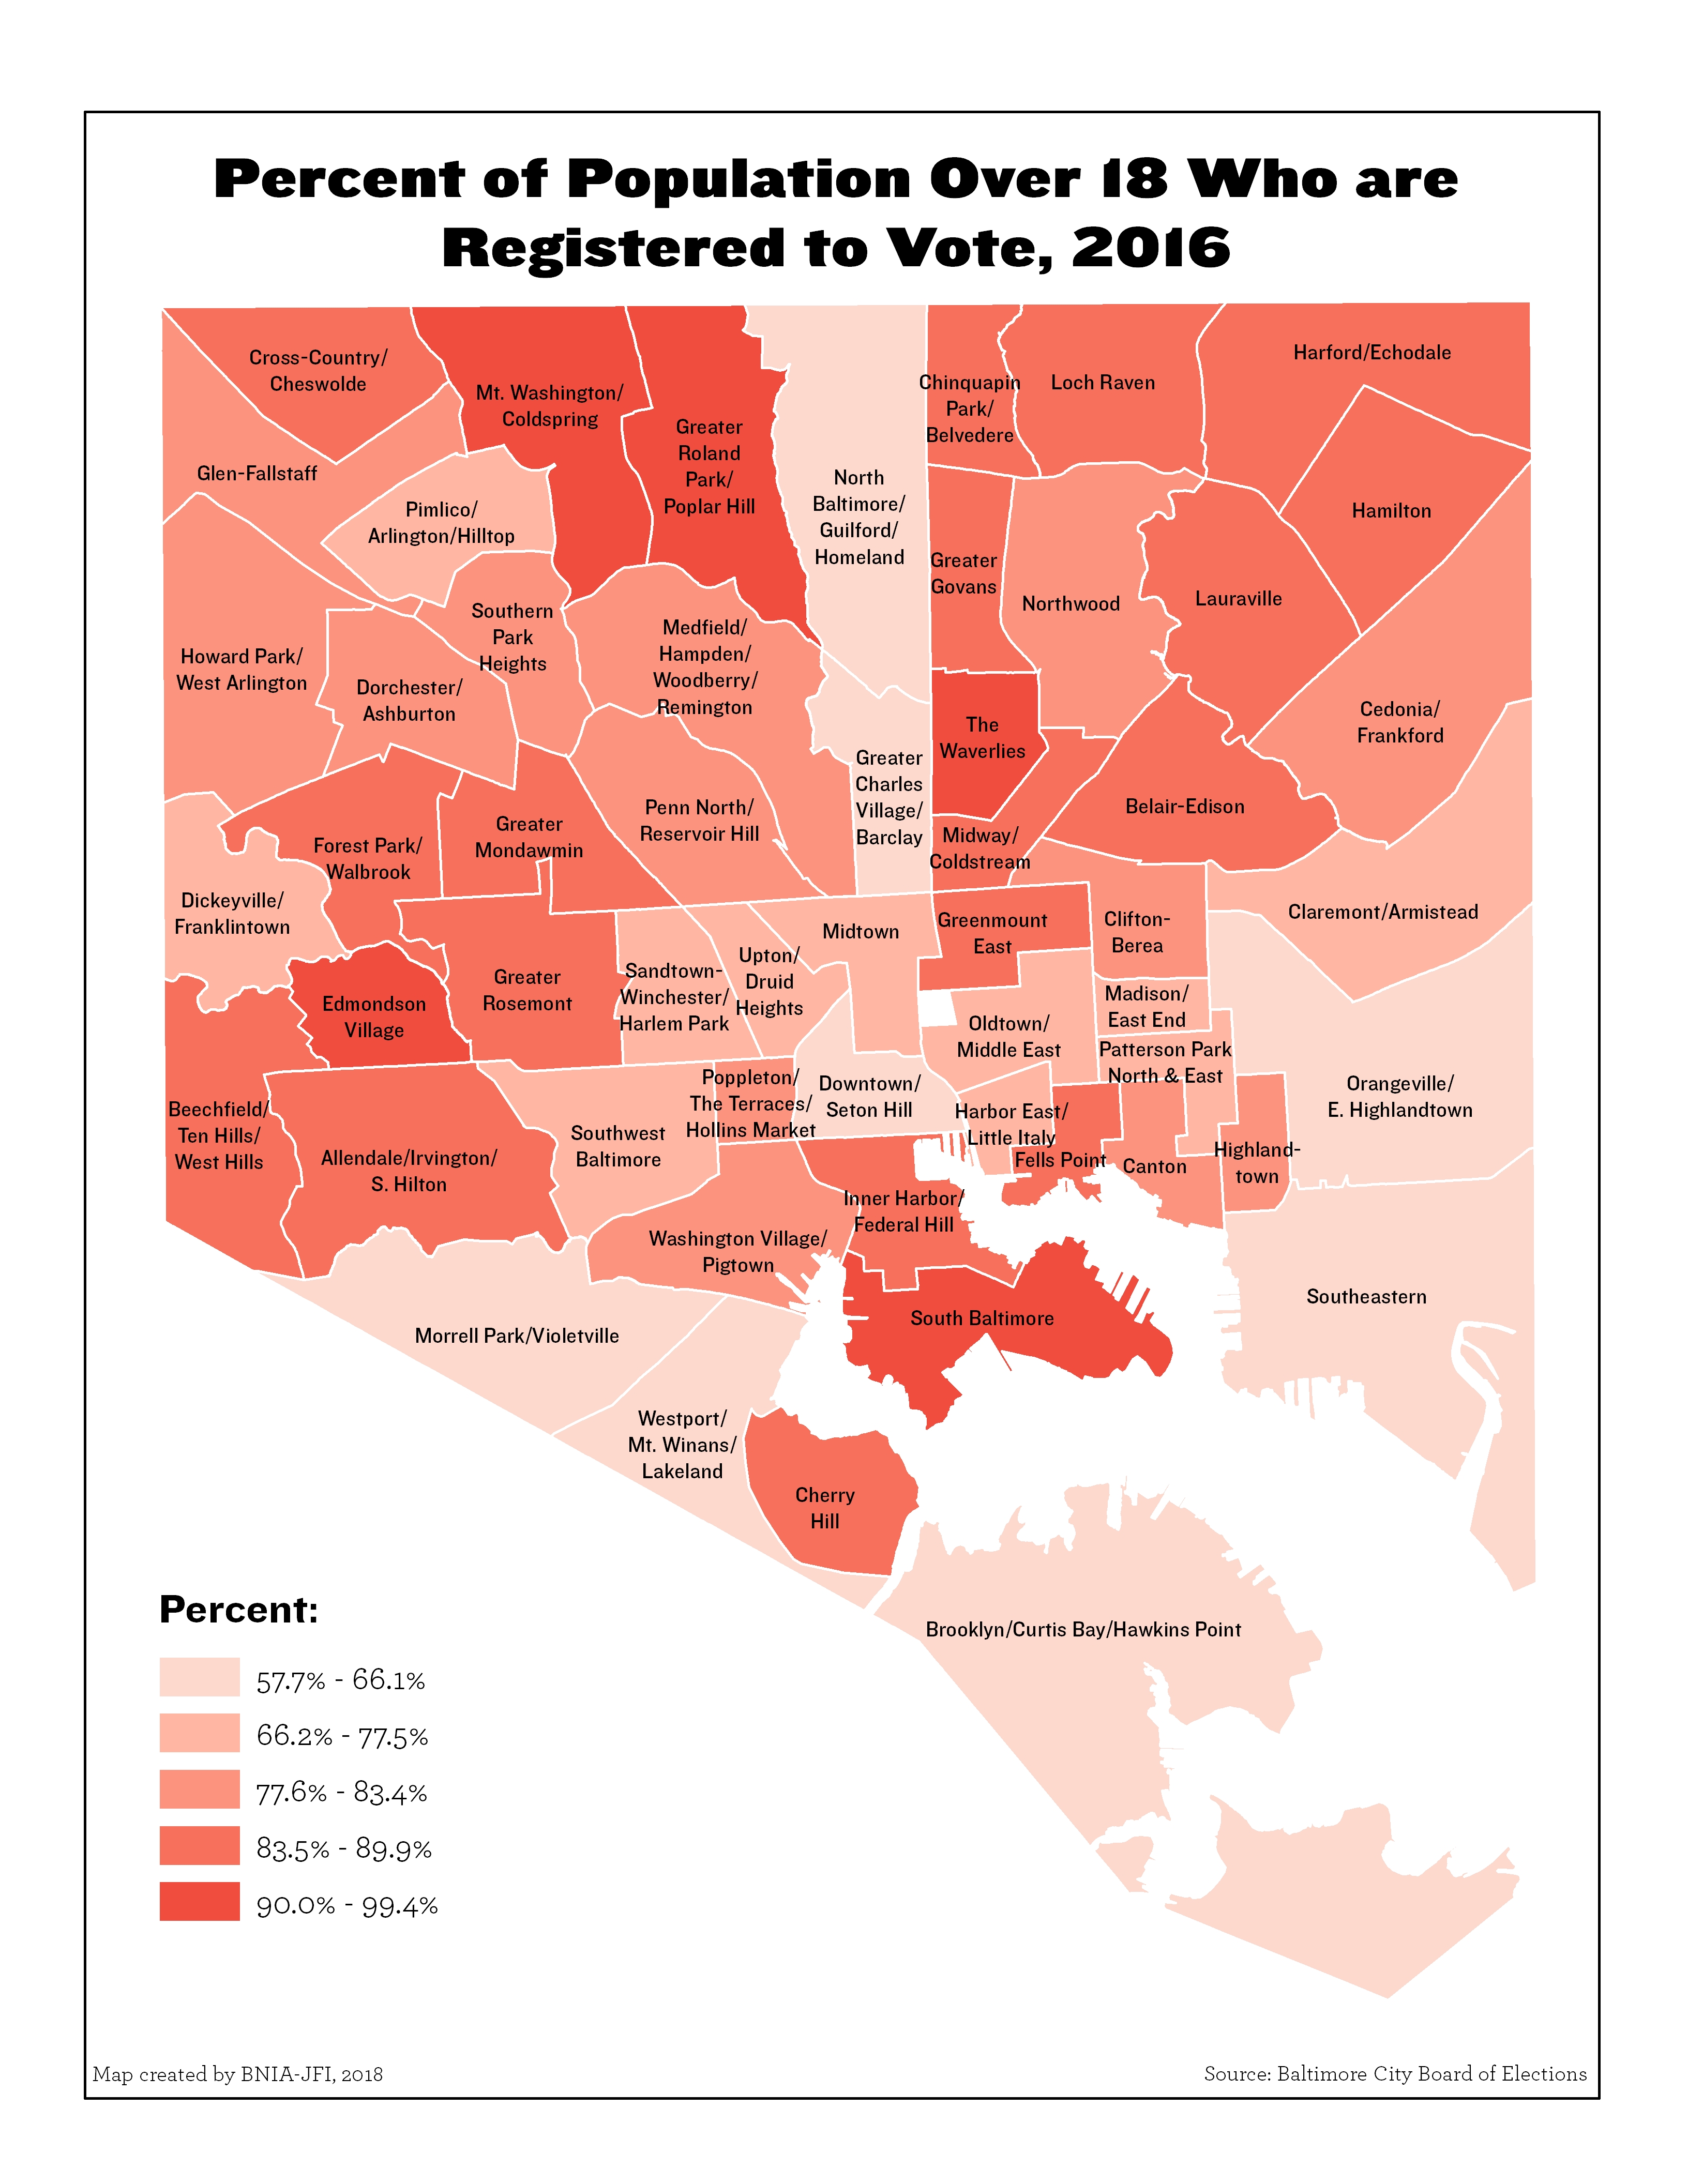
Percent of Population (Over the Age of 18) Who are Registered to Vote
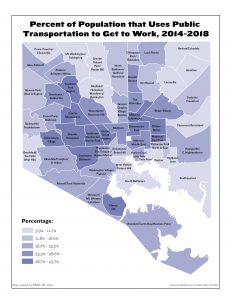
Percent of Population that Uses Public Transportation to Get to Work
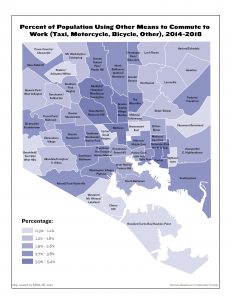
Percent of Population Using Other Means to Commute to Work (Taxi, Motorcycle, Bicycle, Other)
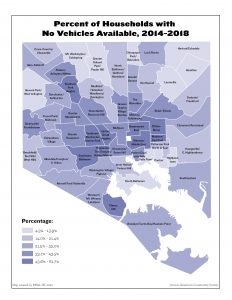
Percent of Households with No Vehicles Available
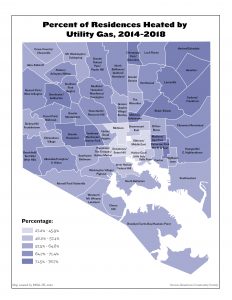
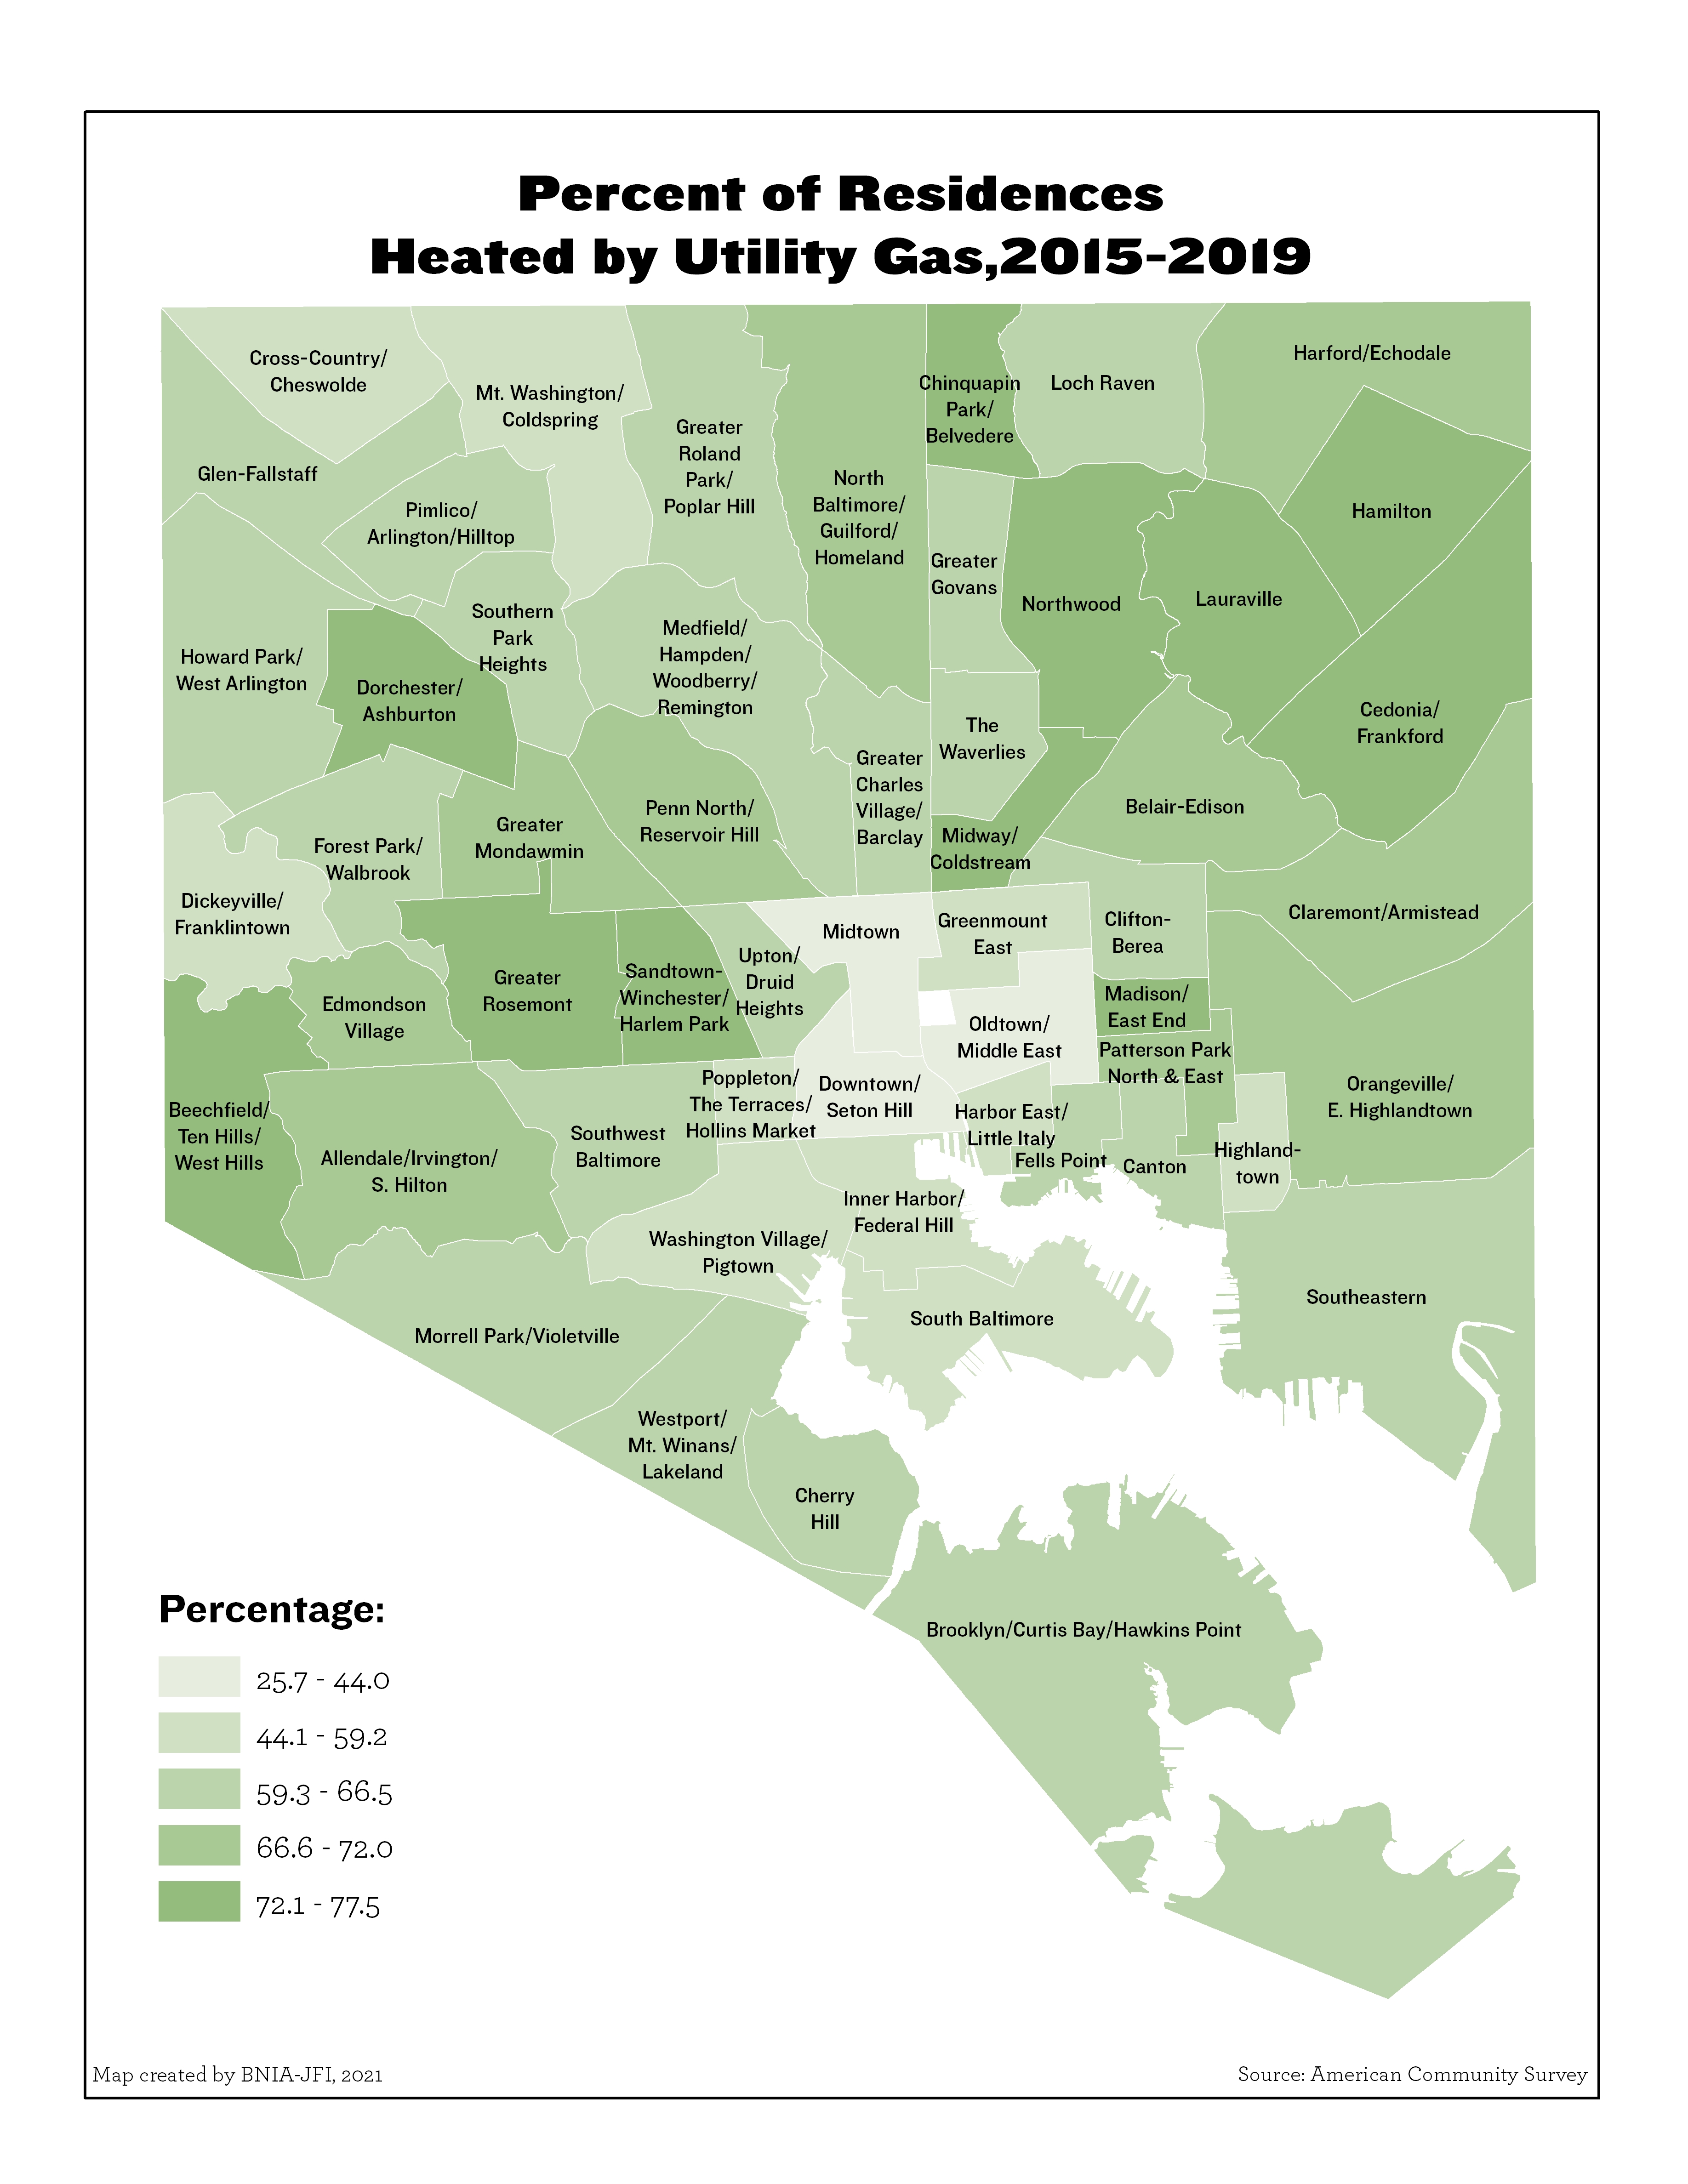
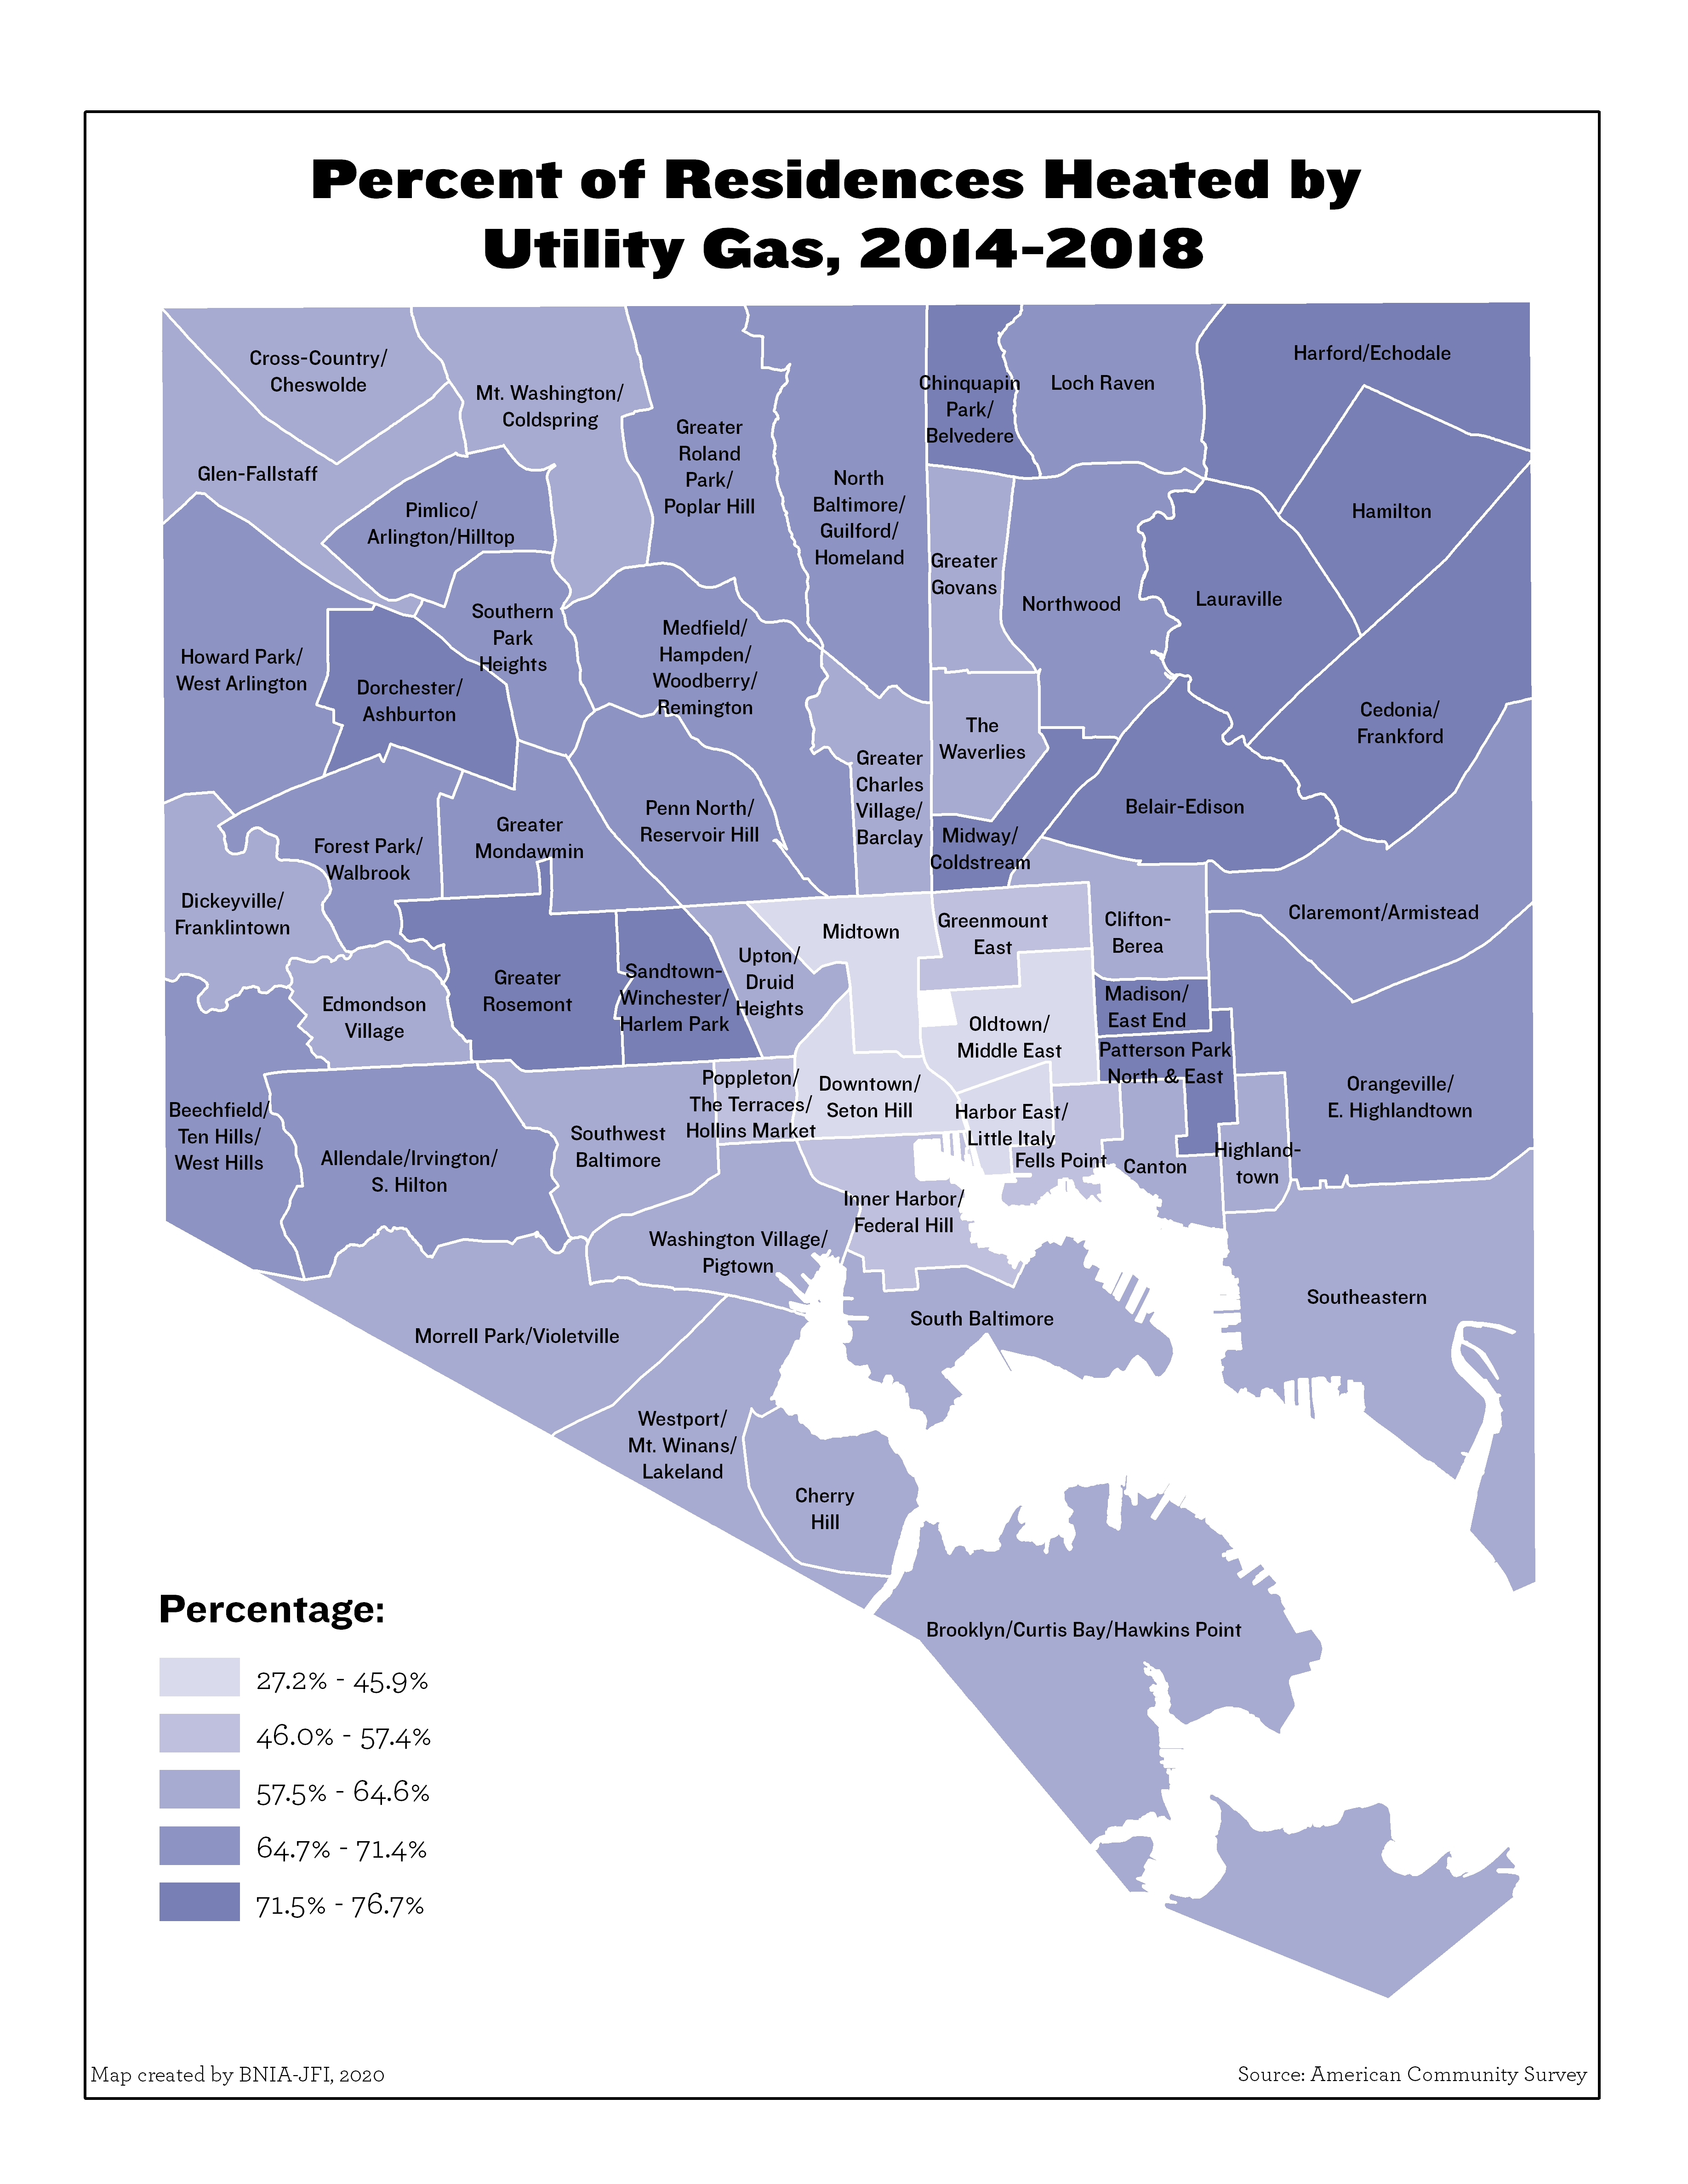
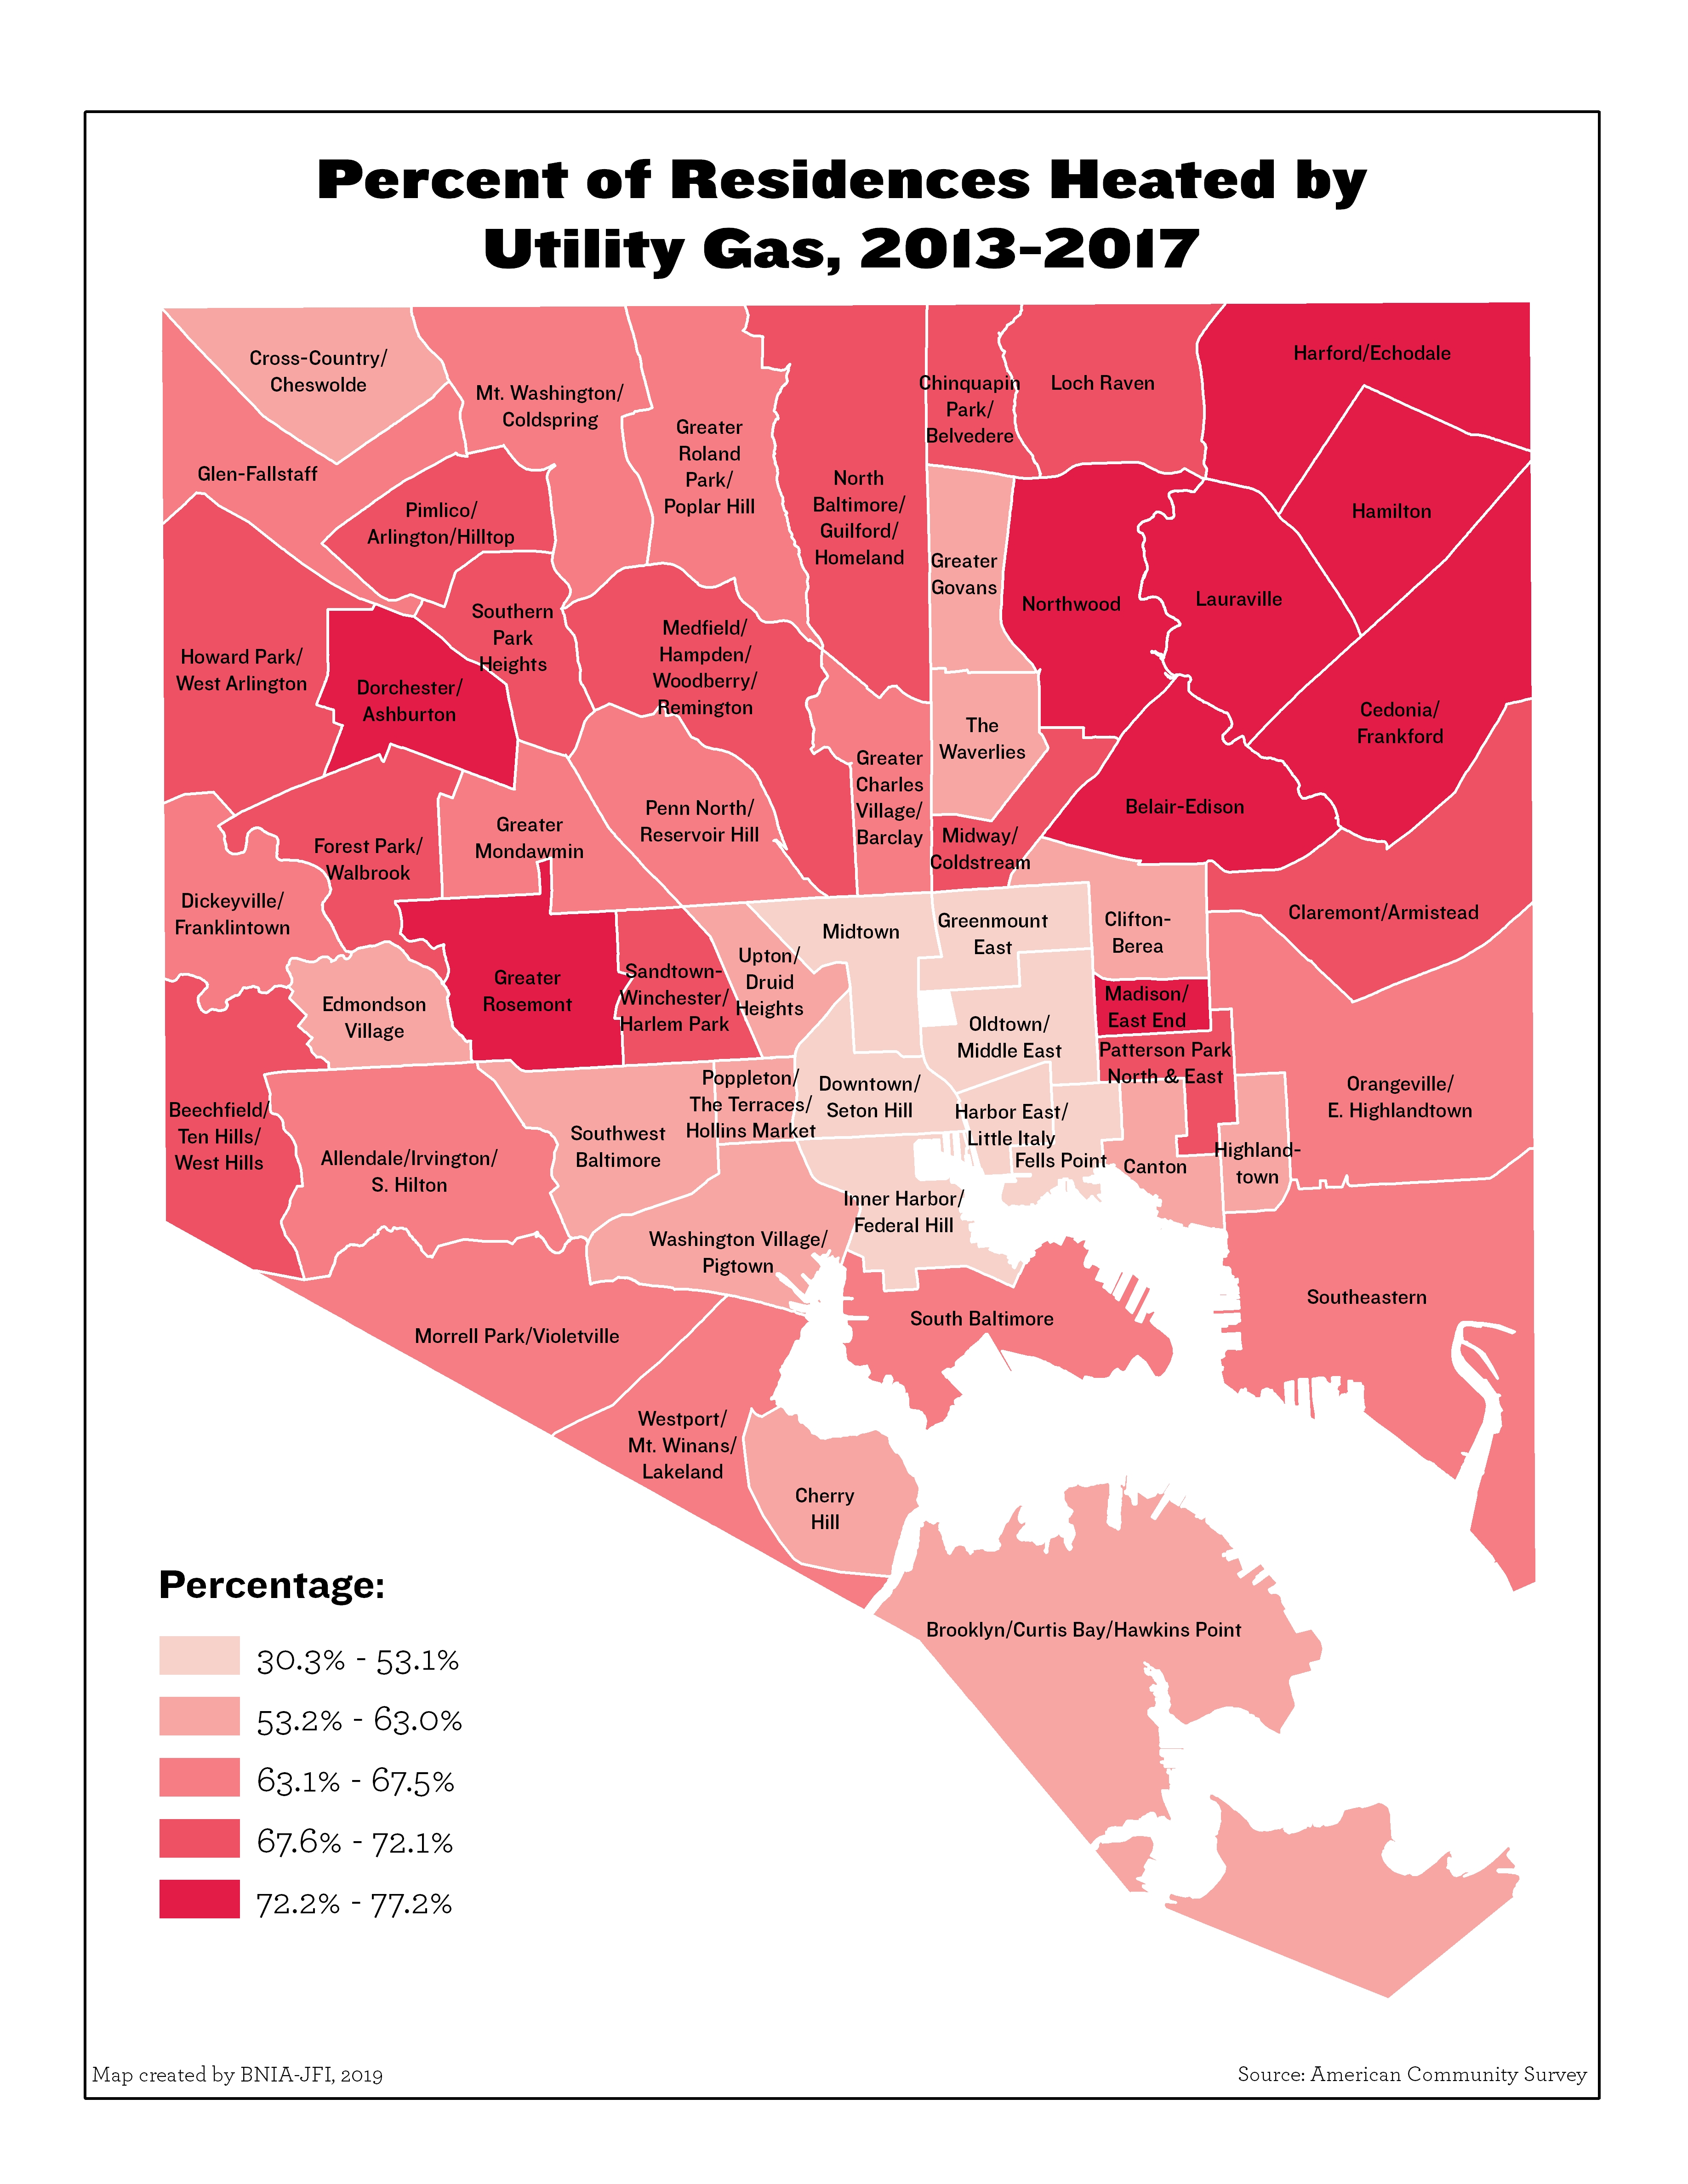
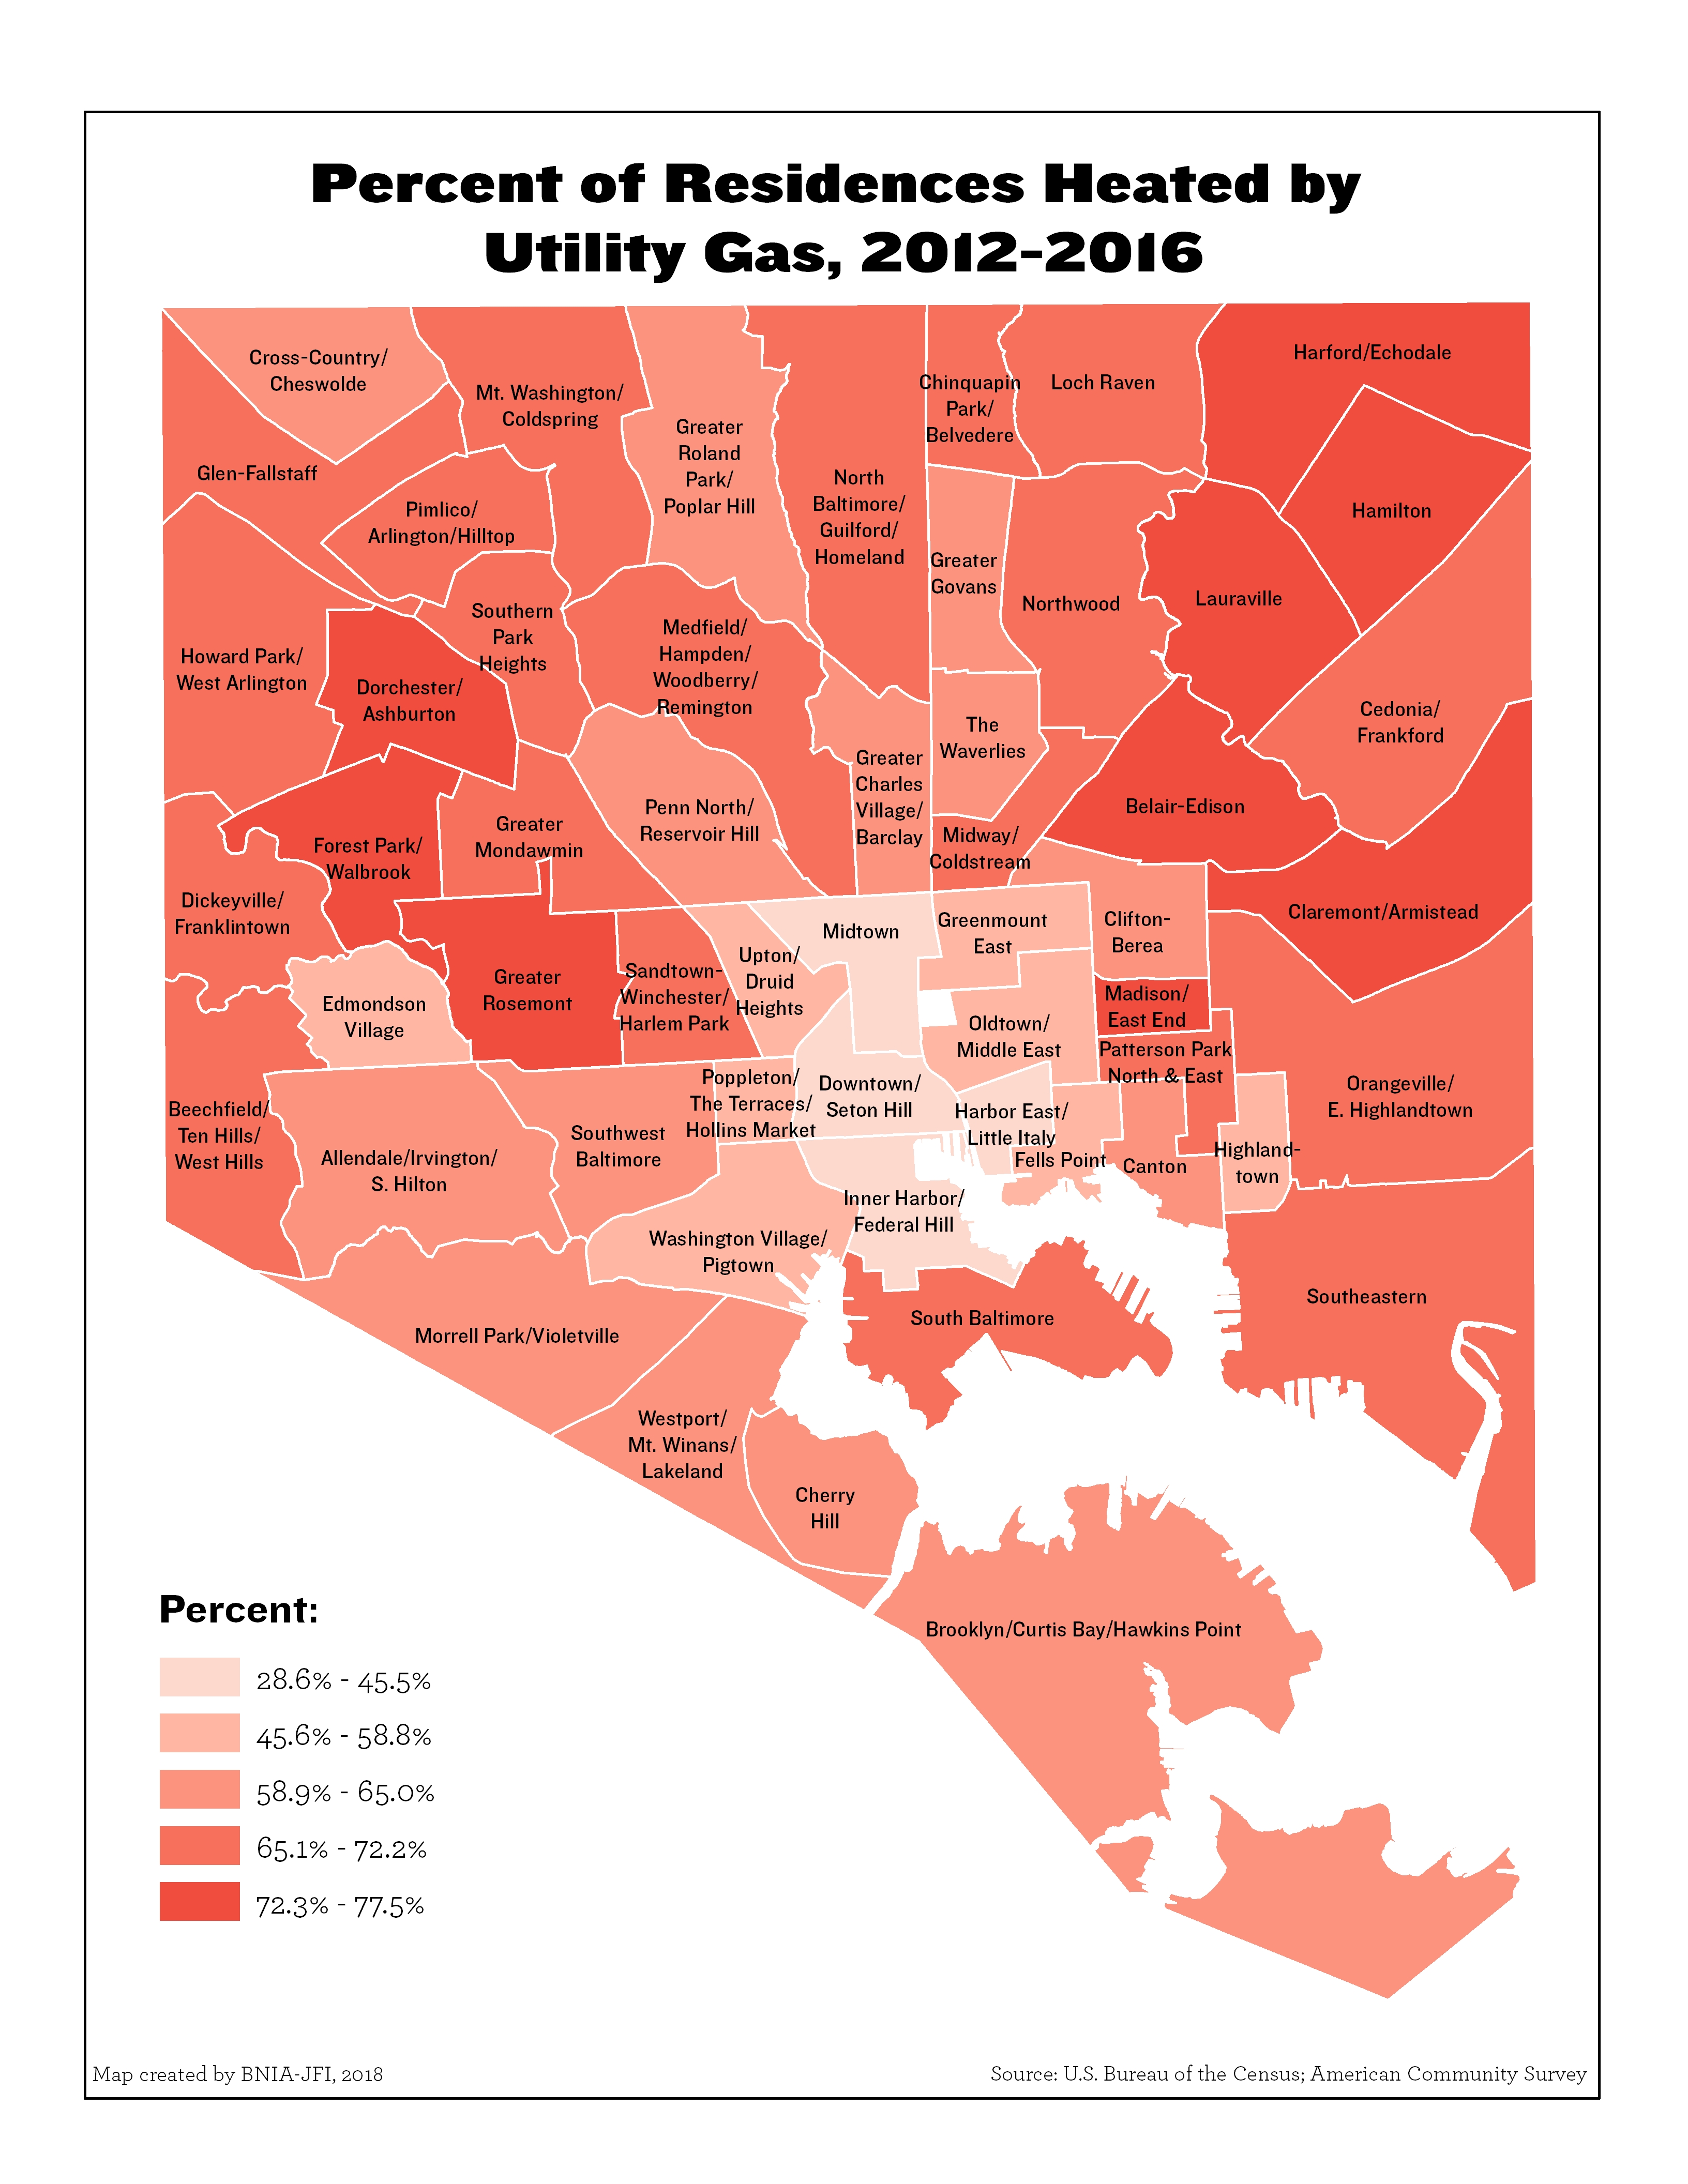
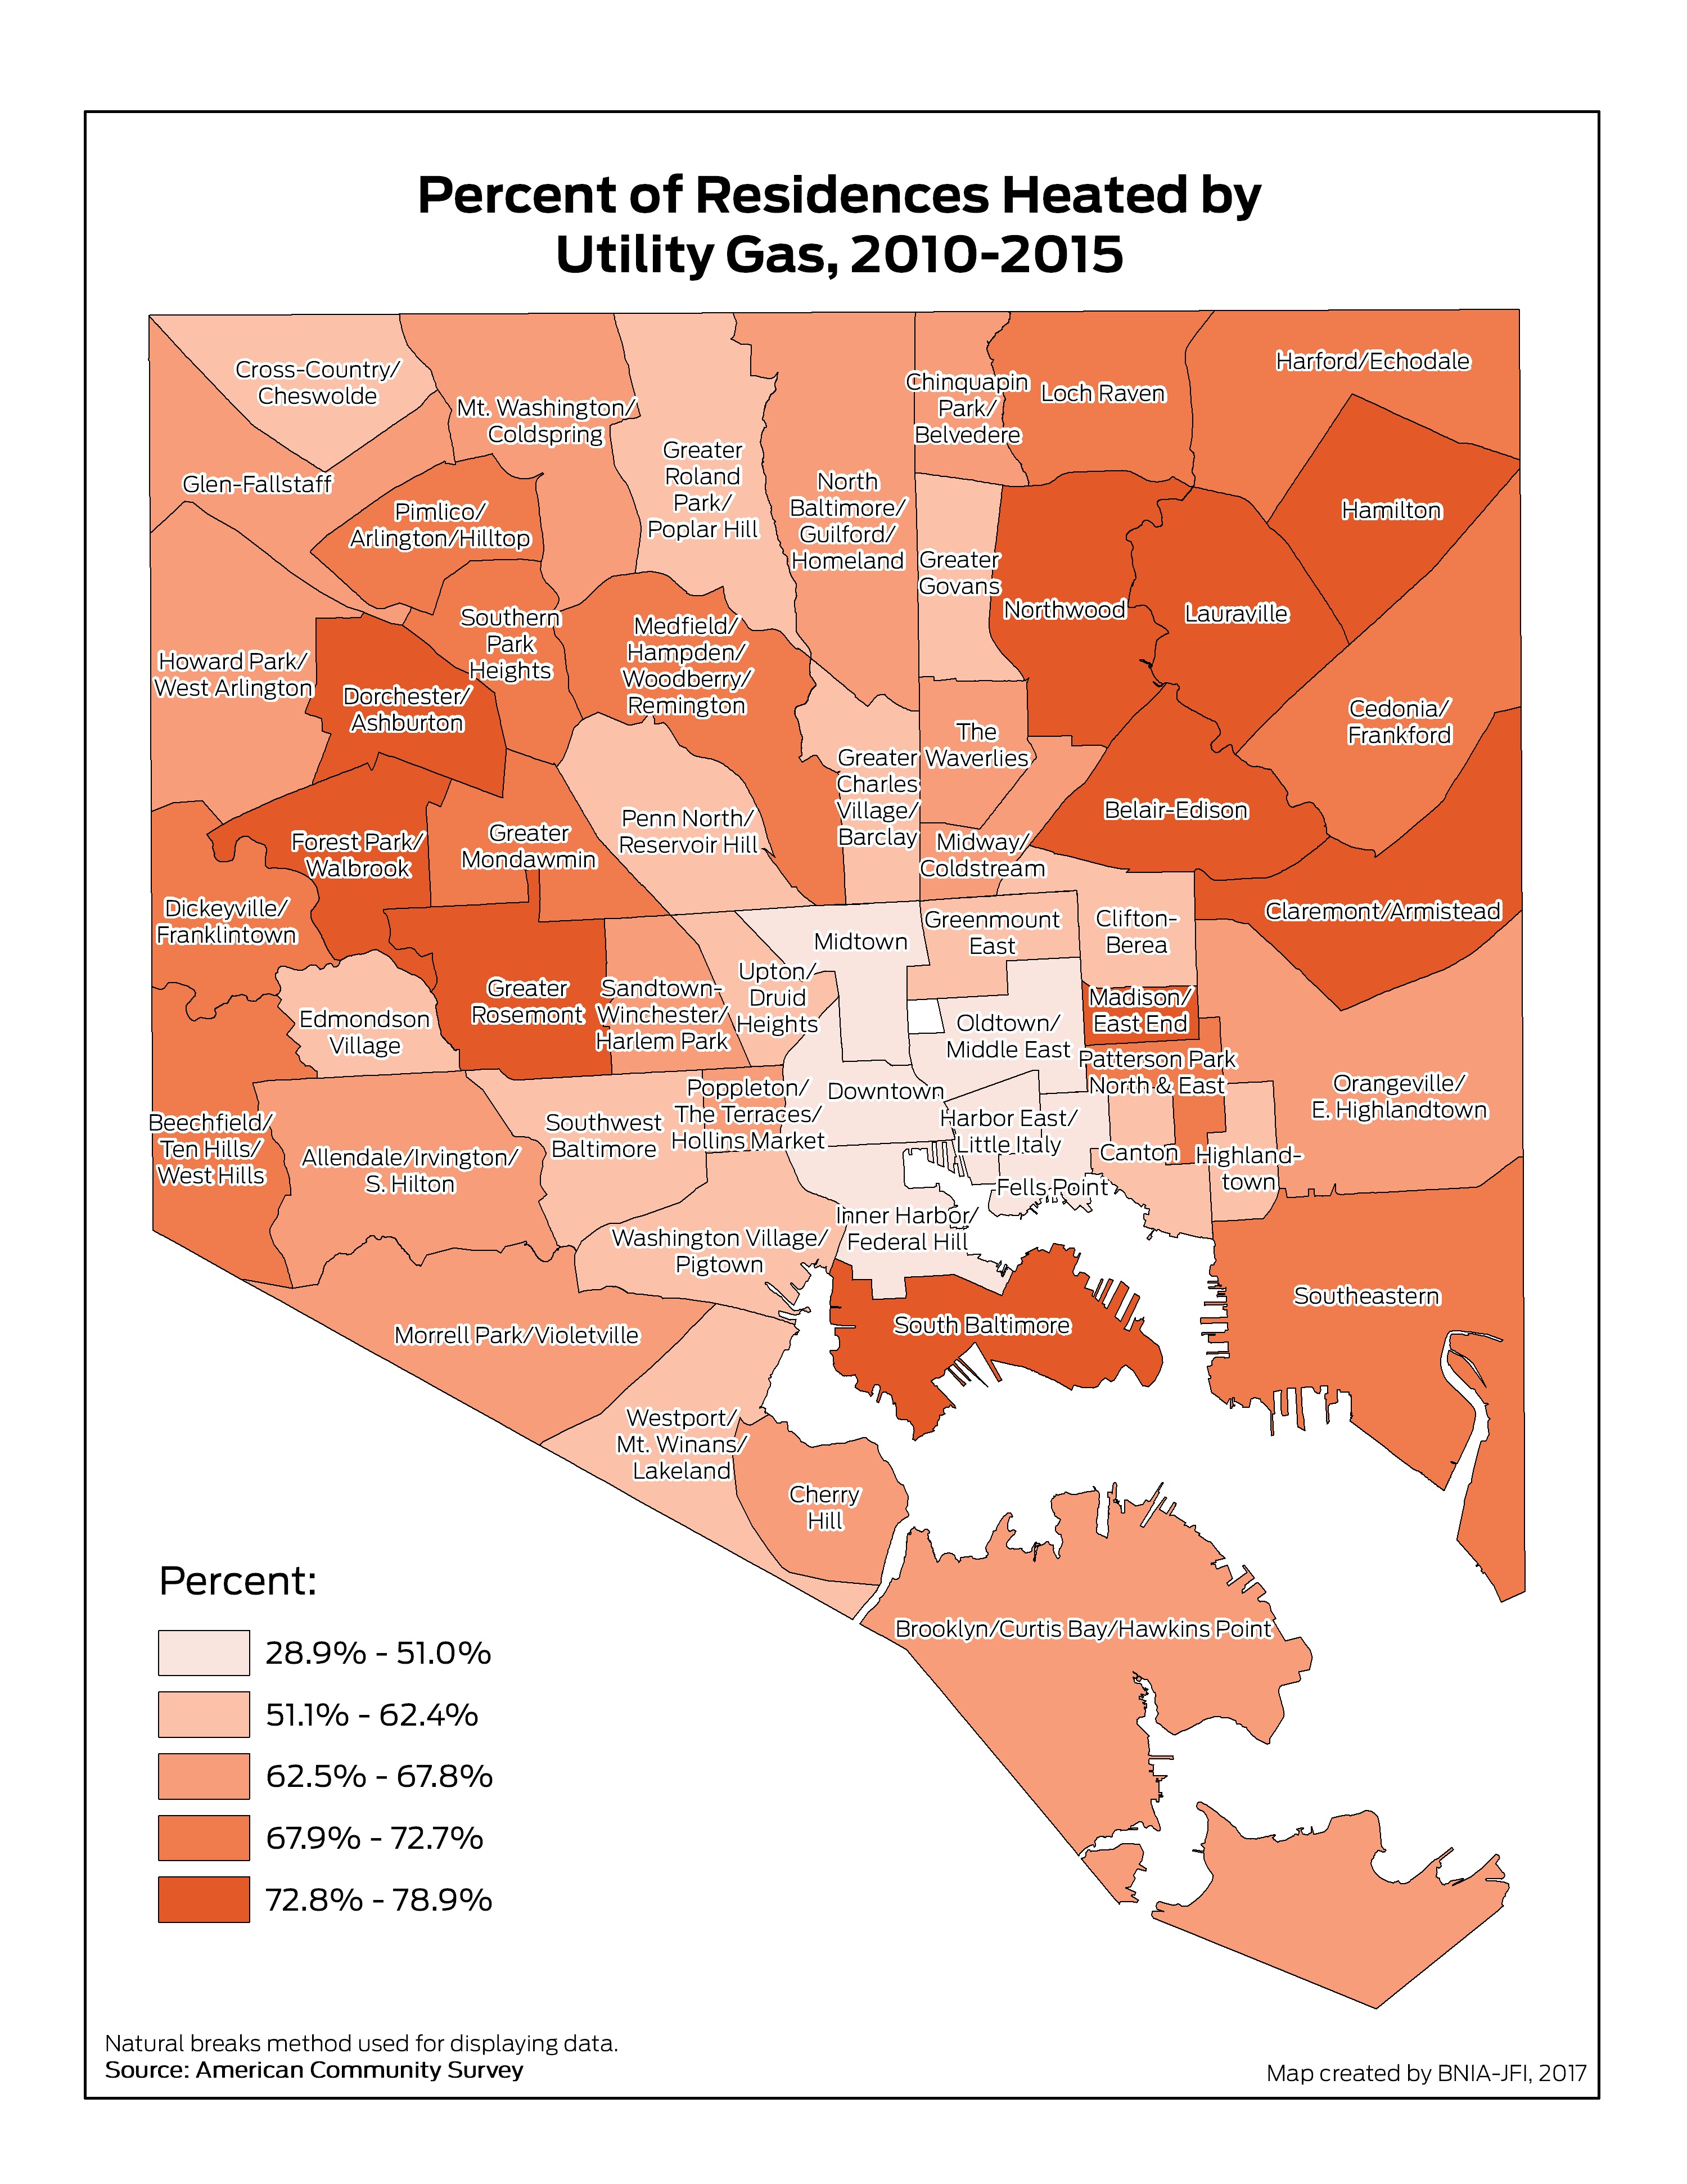
Percent of Residences Heated by Utility Gas
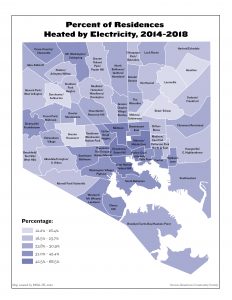
Percent of Residences Heated by Electricity
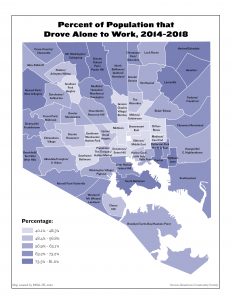
Percent of Population that Drove Alone to Work
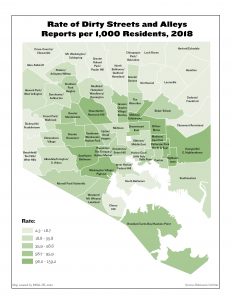
Rate of Dirty Streets and Alleys Reports per 1,000 Residents
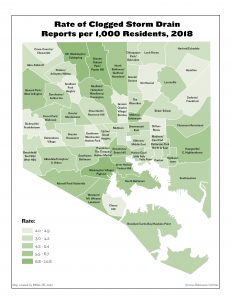
Rate of Clogged Storm Drain Reports per 1,000 Residents
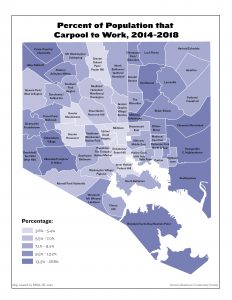
Percent of Population that Carpool to Work
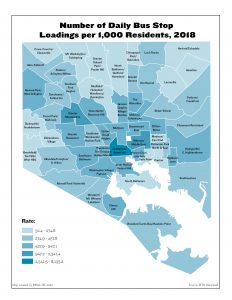
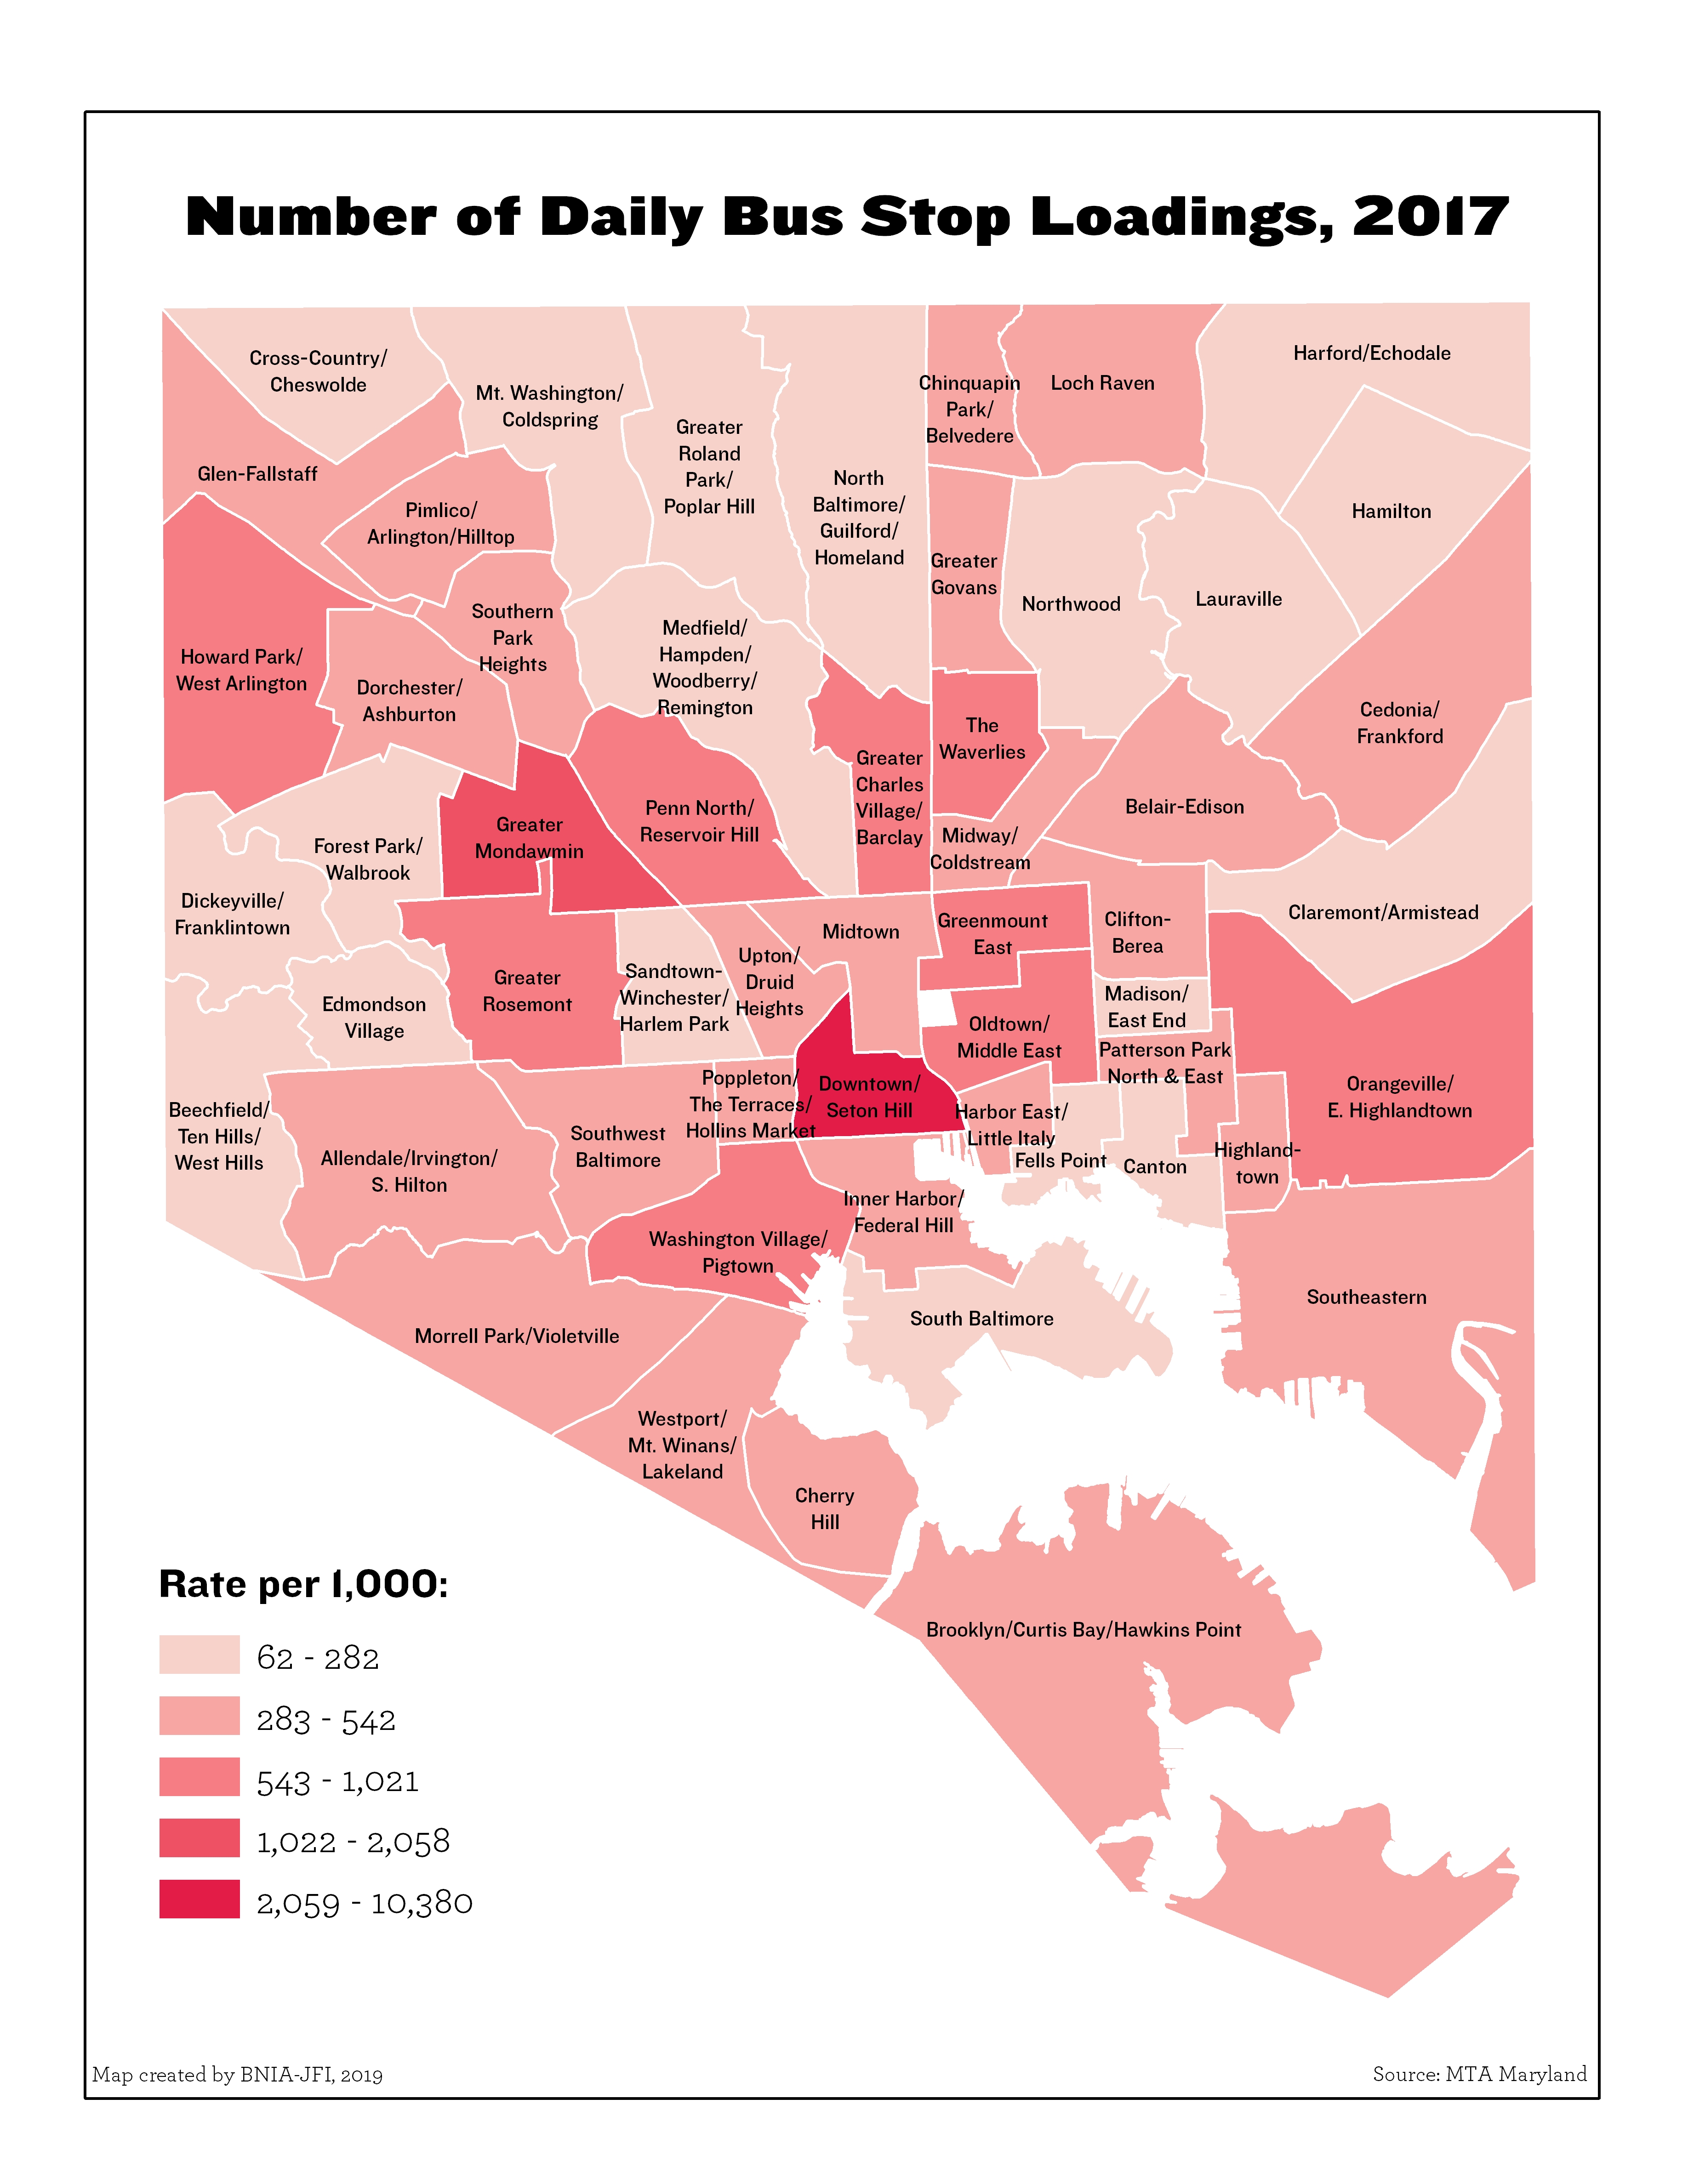
Number of Daily Bus Stop Loadings per 1,000 Residents
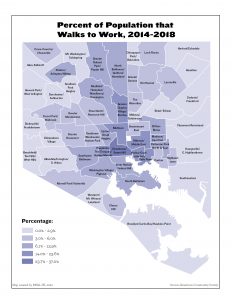
Percent of Population that Walks to Work
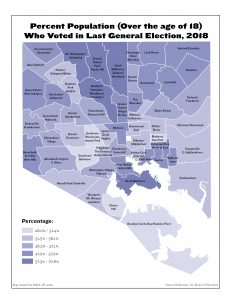
Percent Population (Over the Age of 18) Who Voted in Last General Election
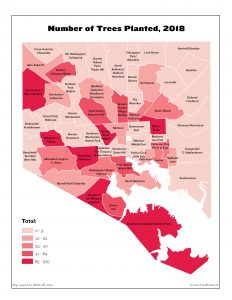
Number of Trees Planted
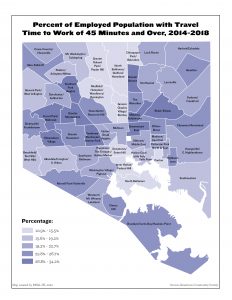
Percent of Employed Population with Travel Time to Work of 45 Minutes and Over
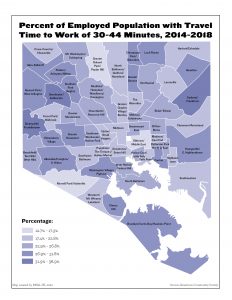
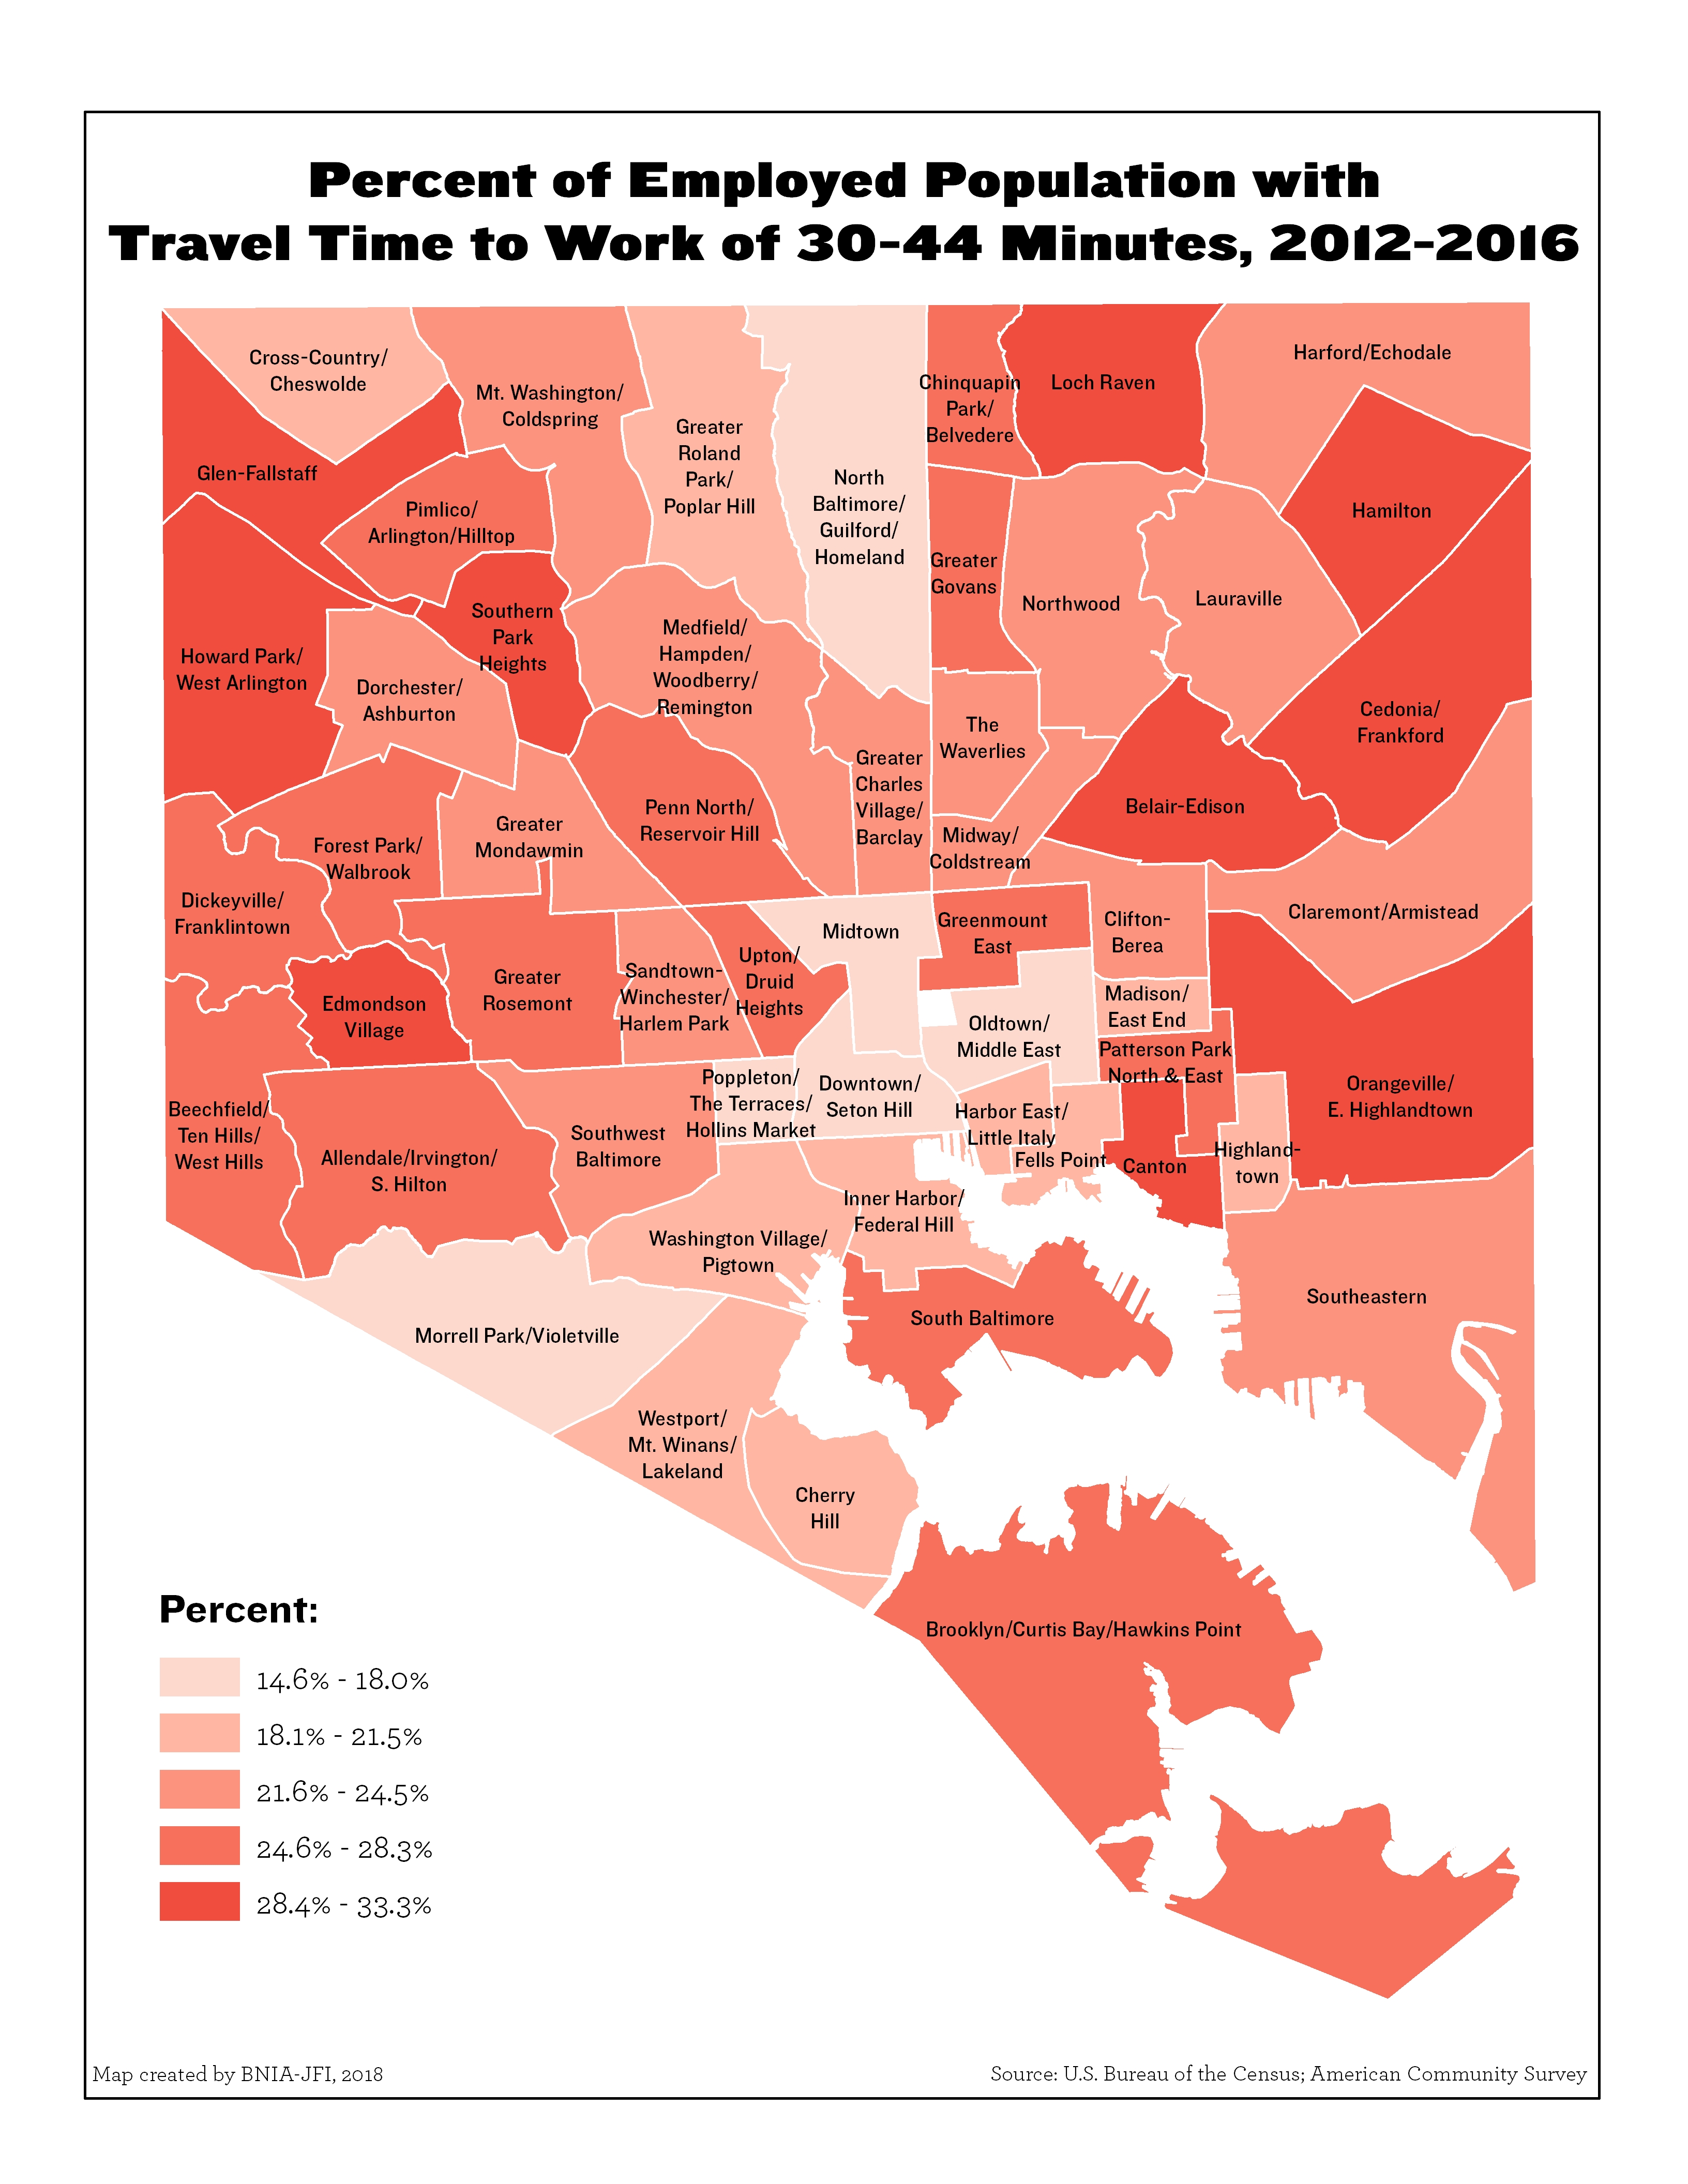
Percent of Employed Population with Travel Time to Work of 30-44 Minutes
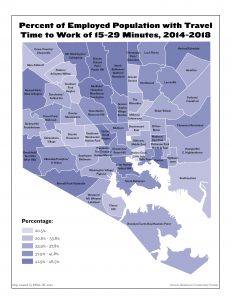
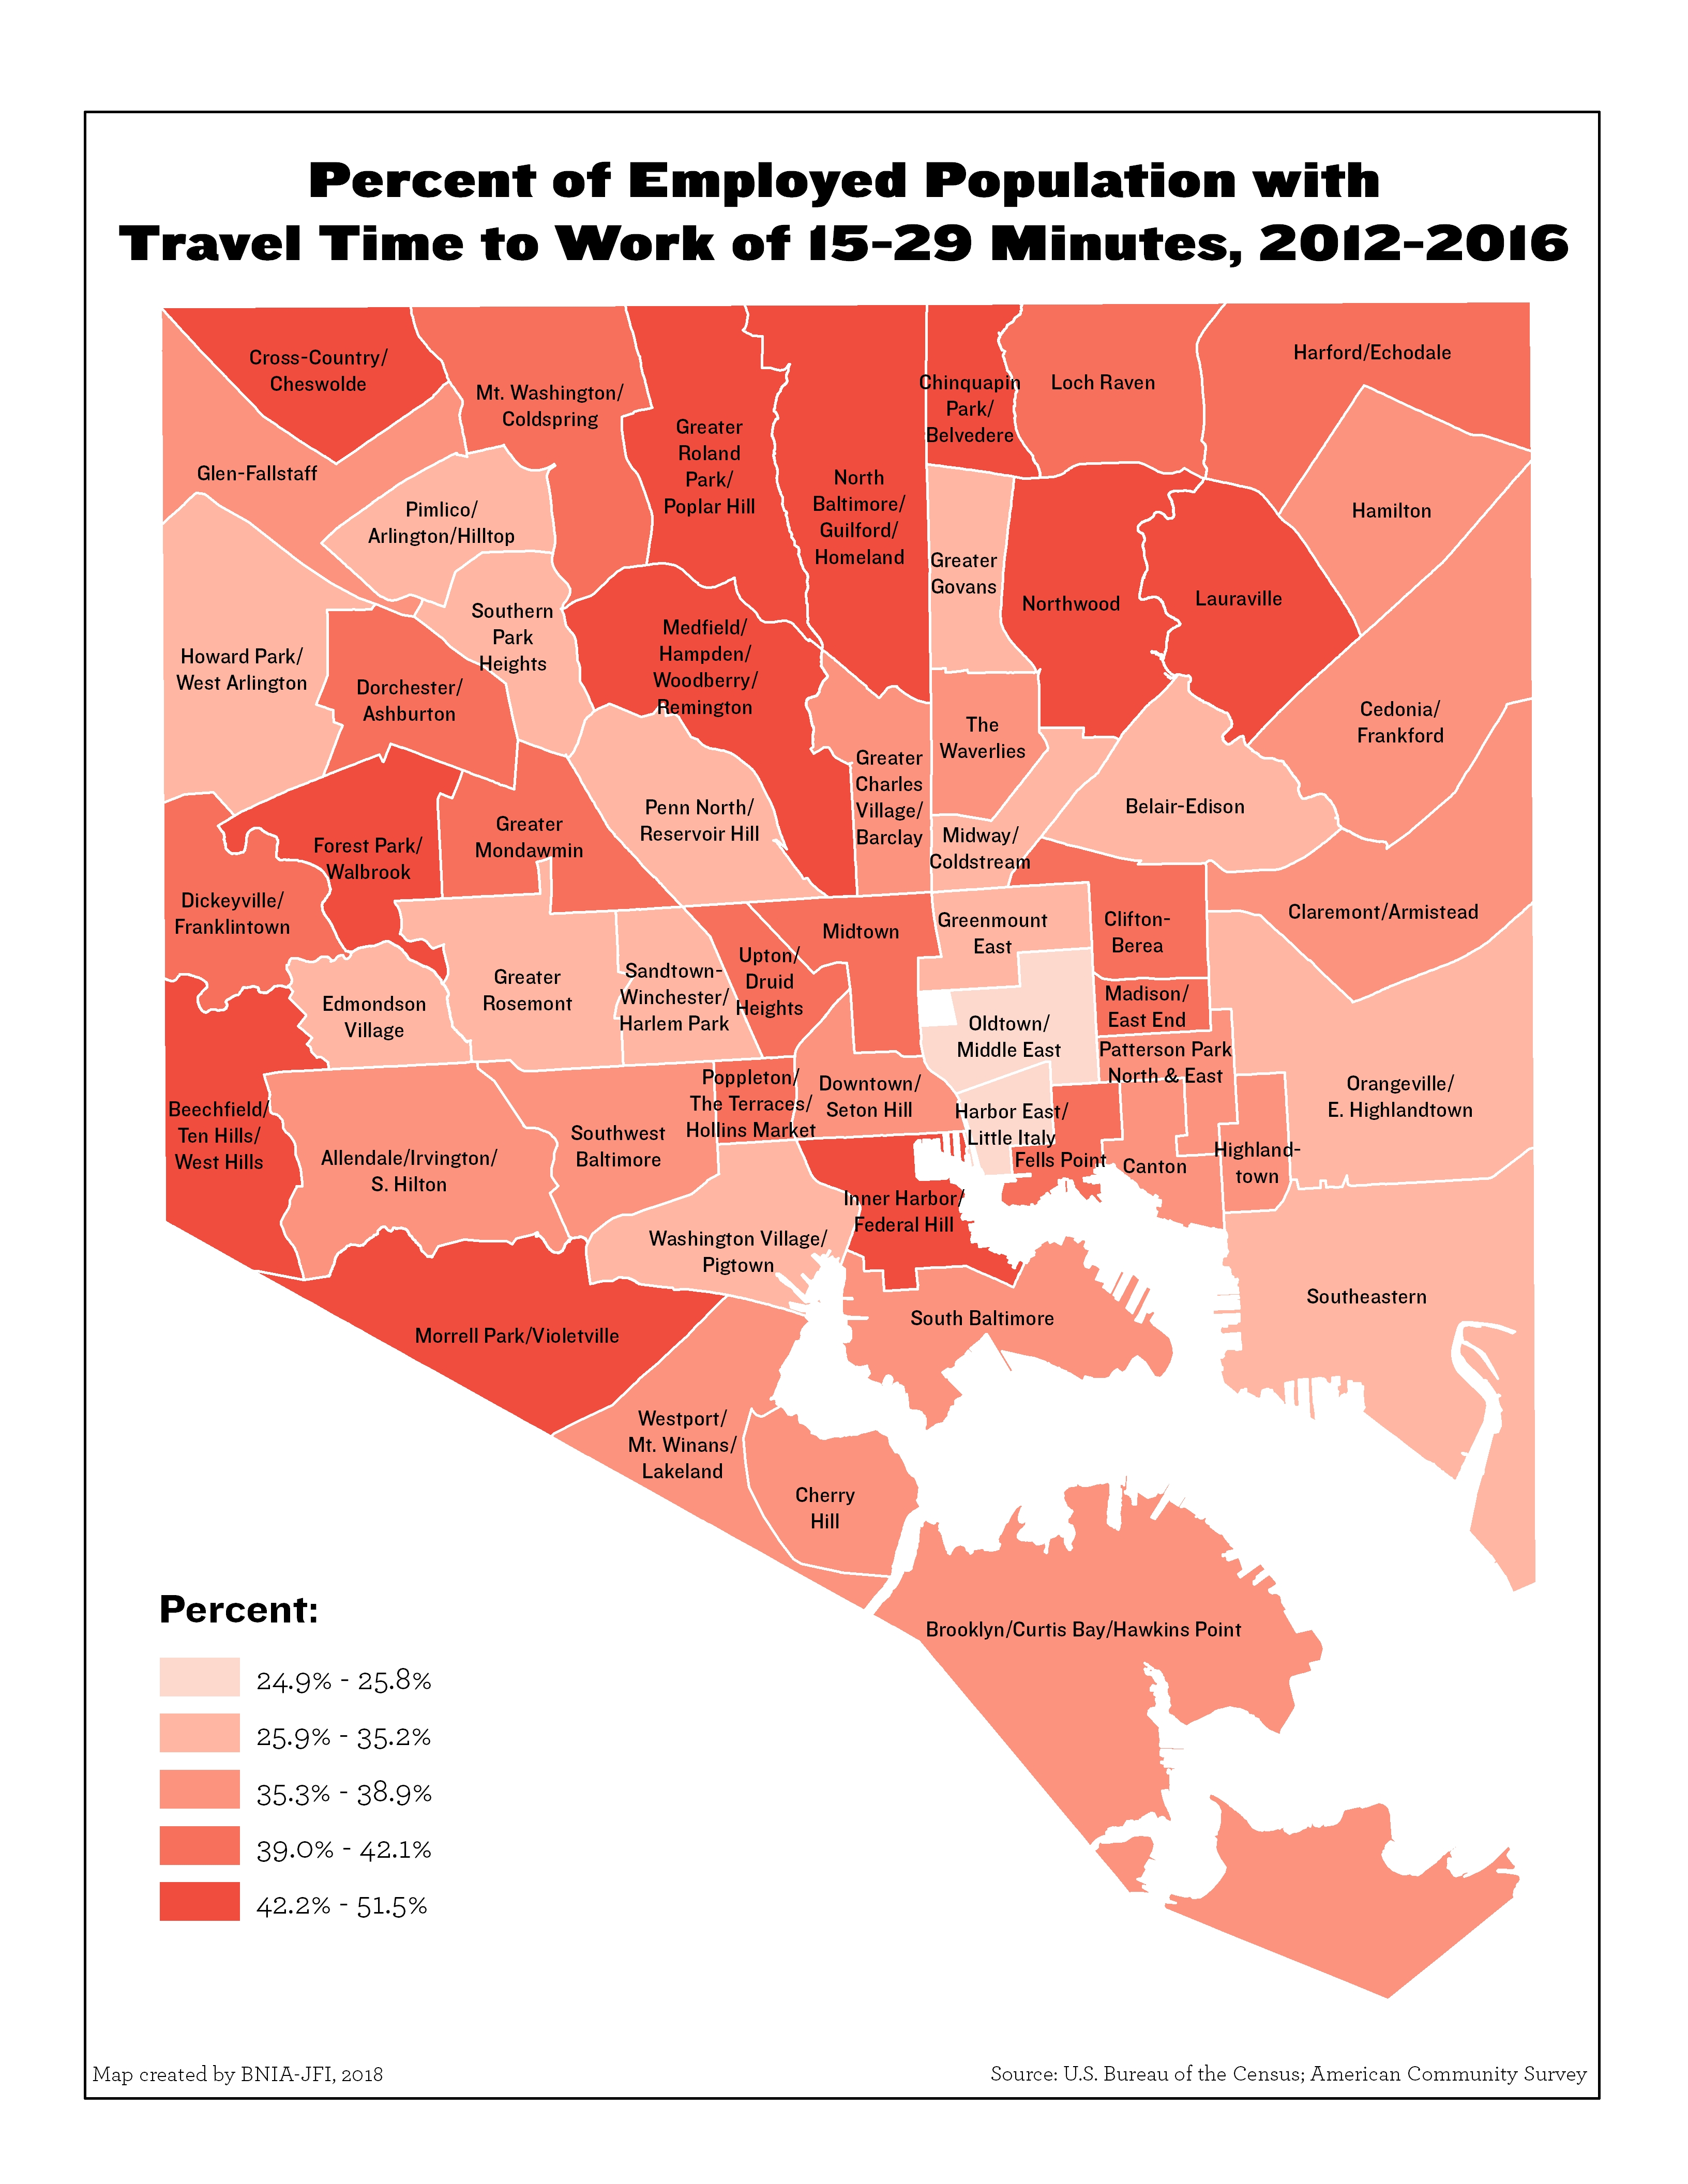
Percent of Employed Population with Travel Time to Work of 15-29 Minutes