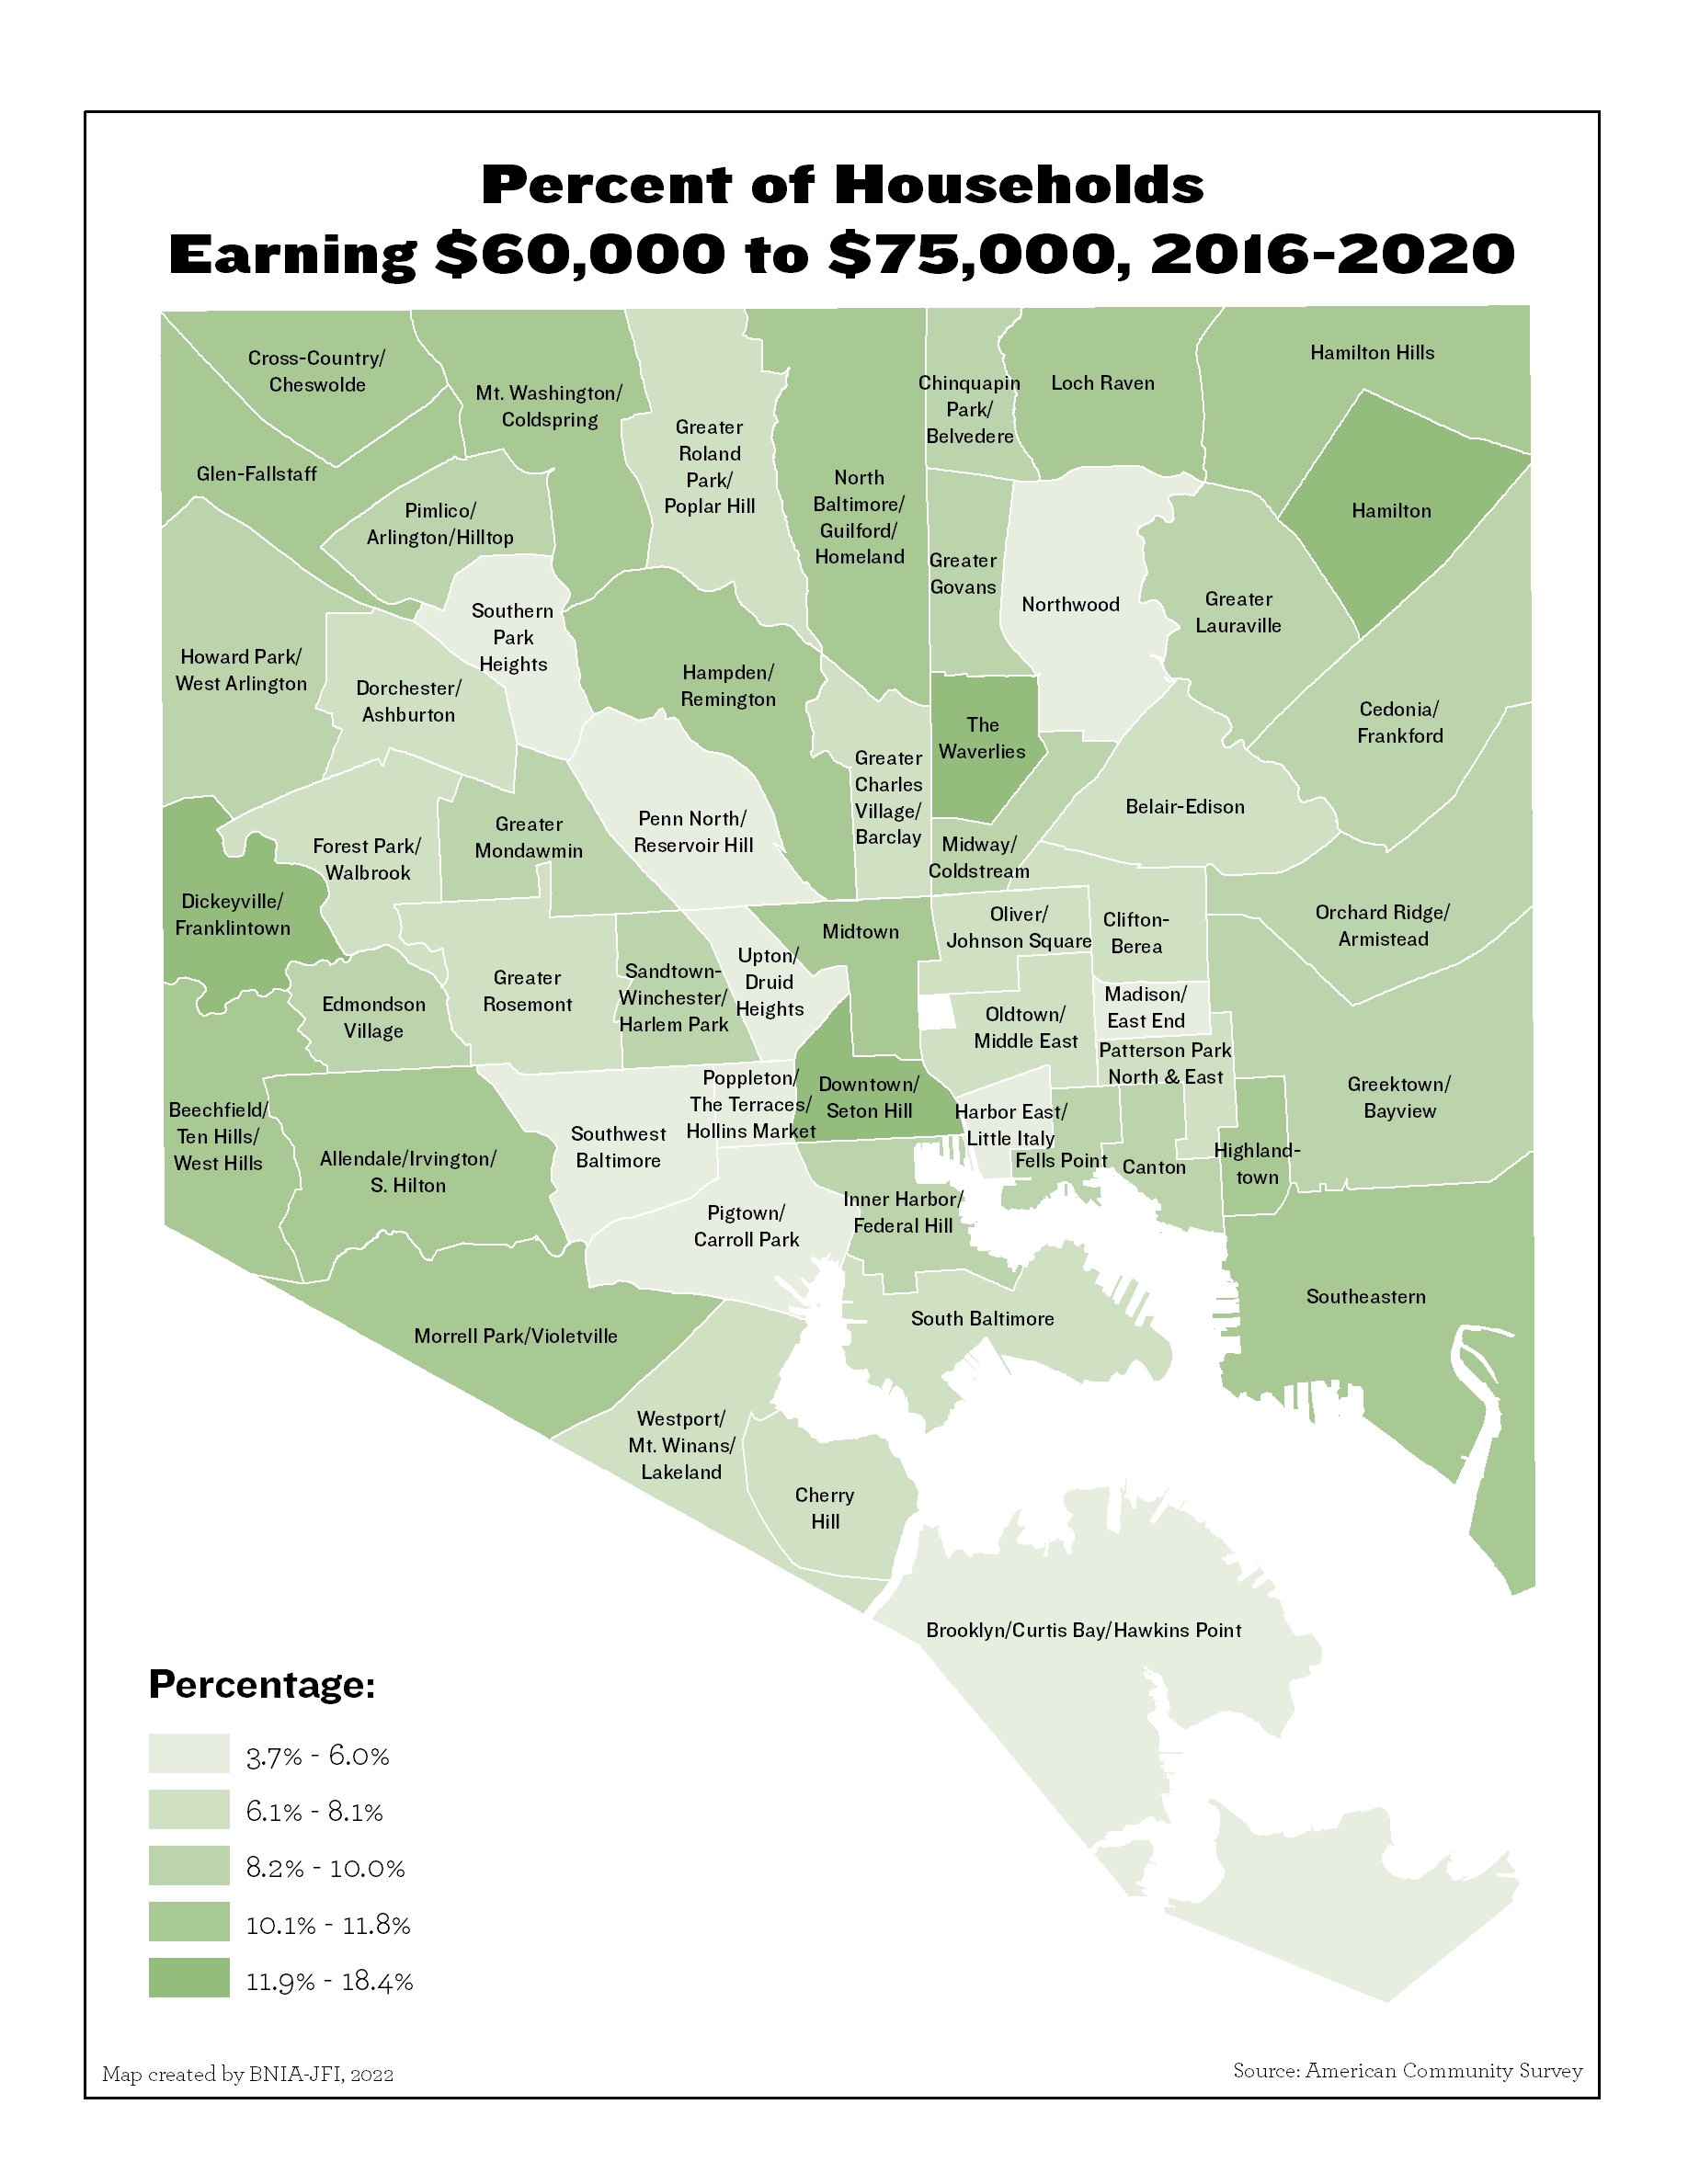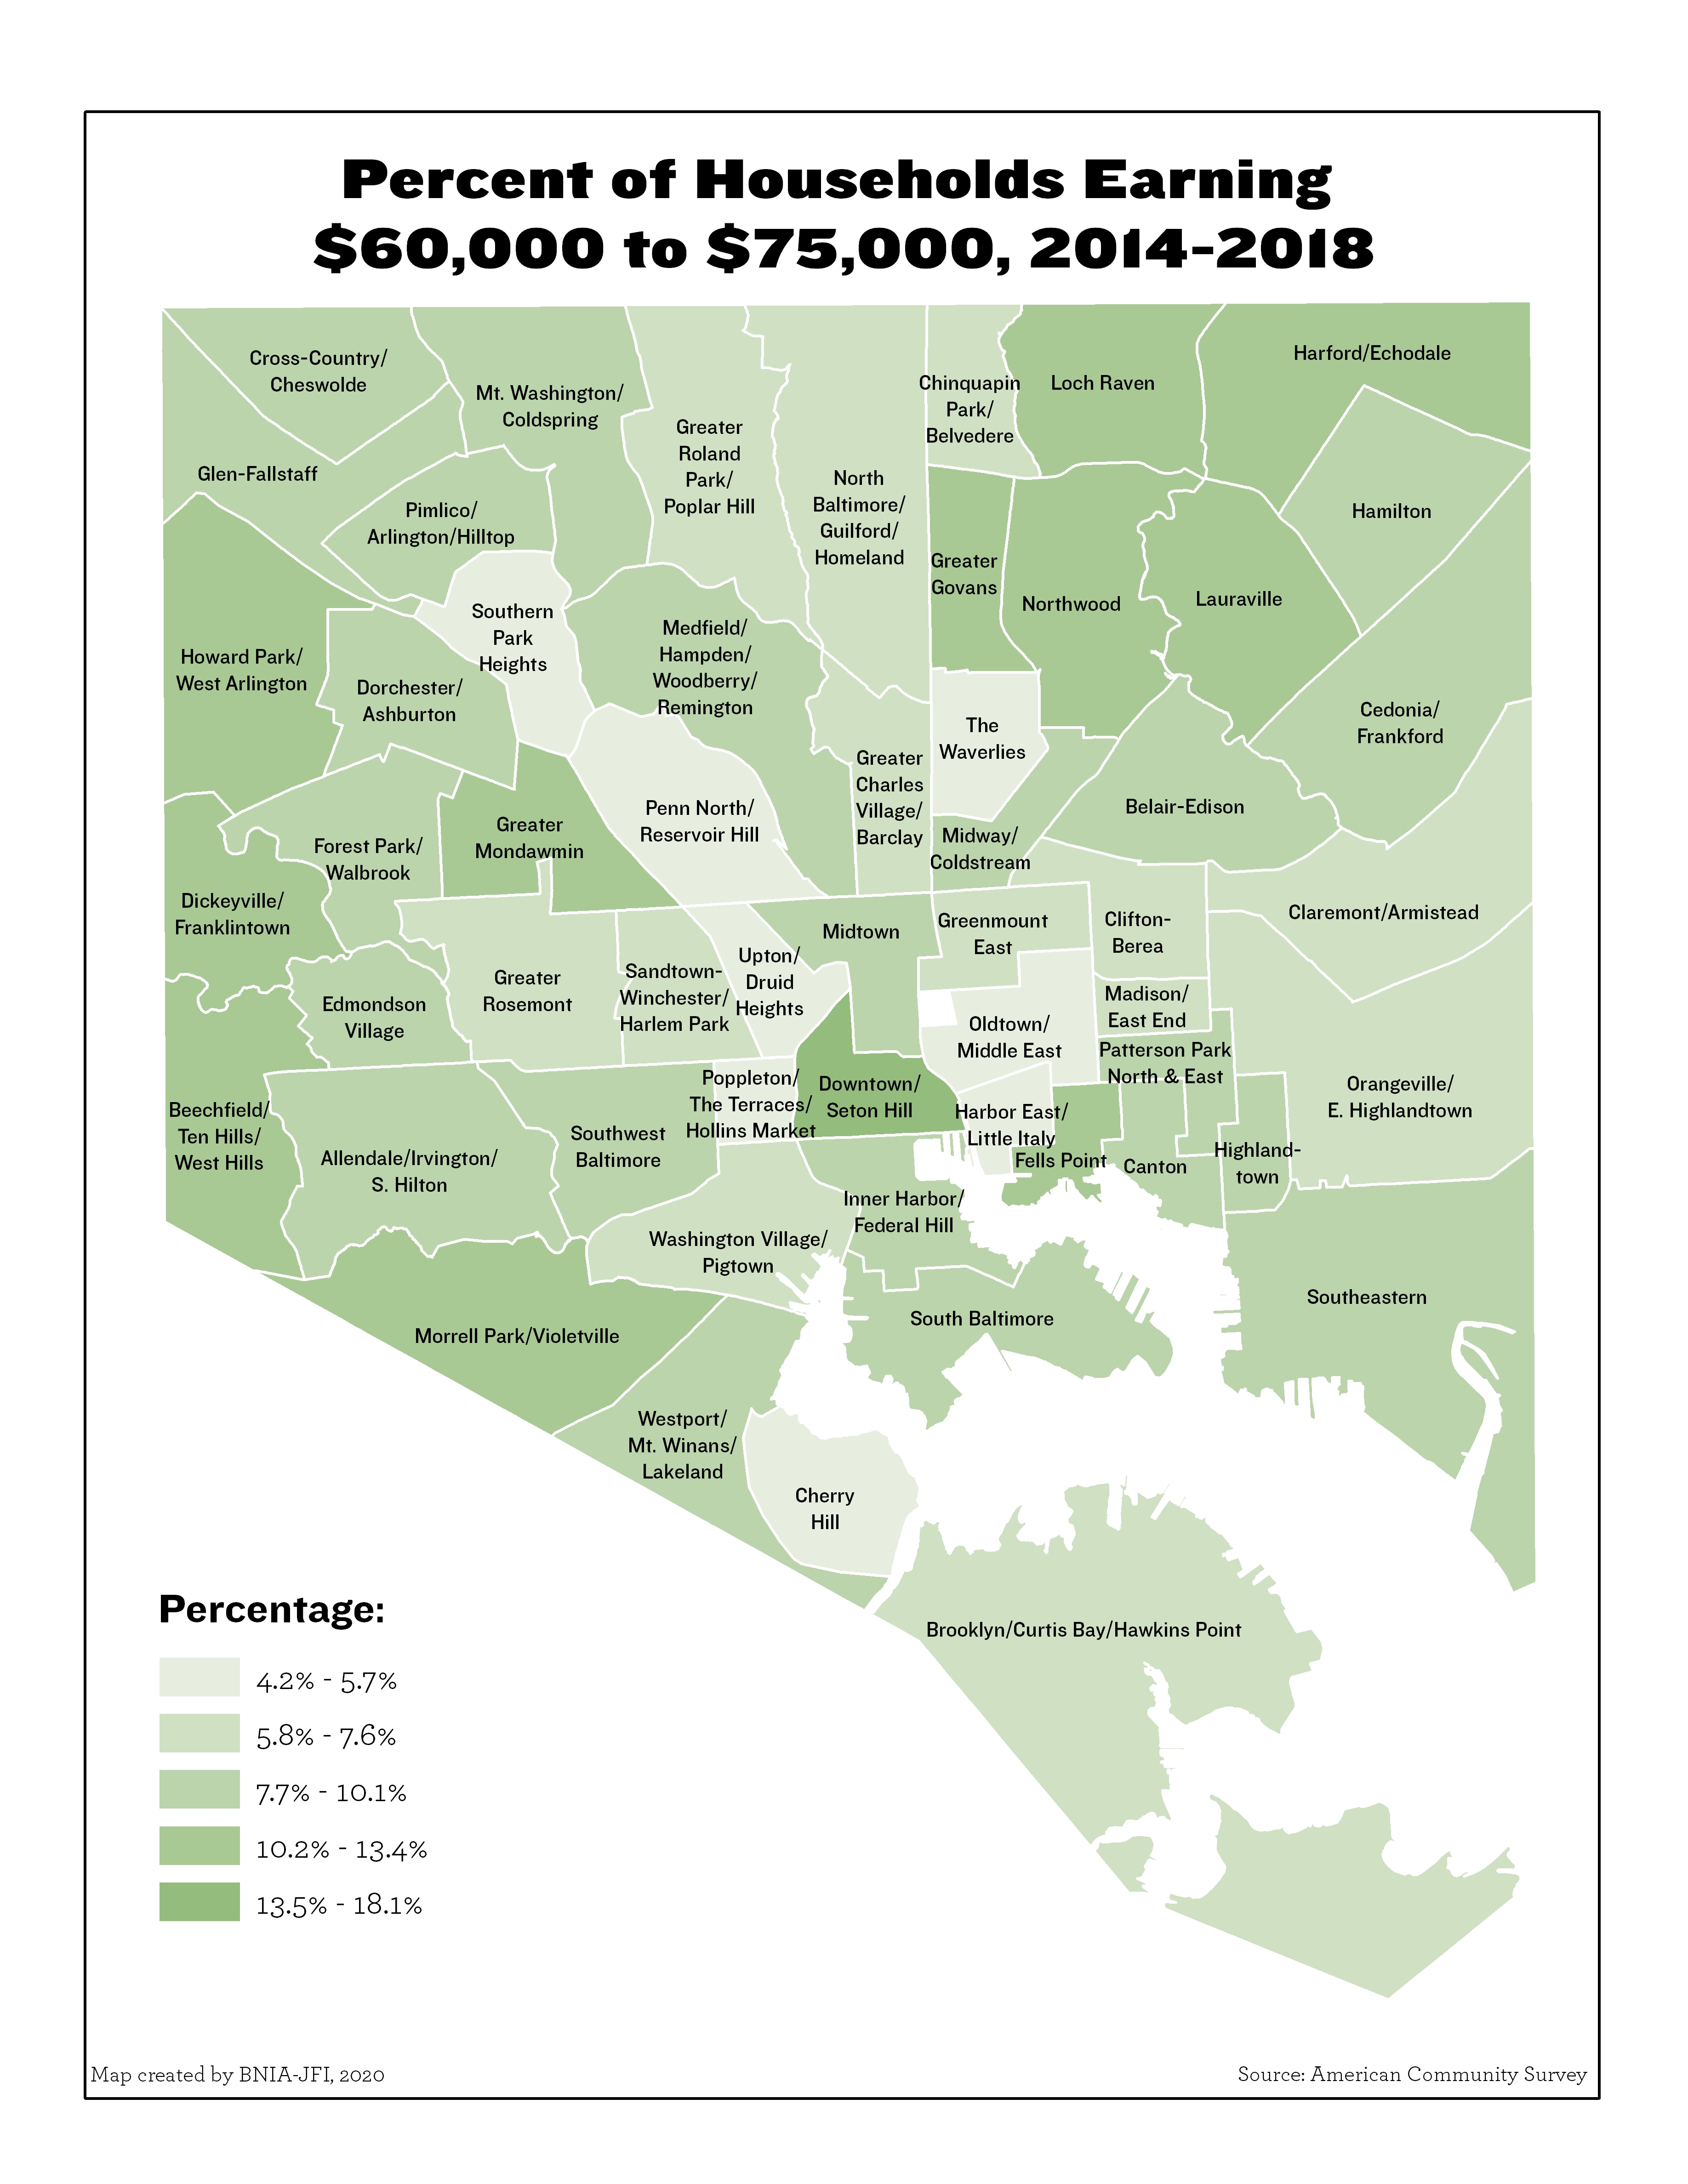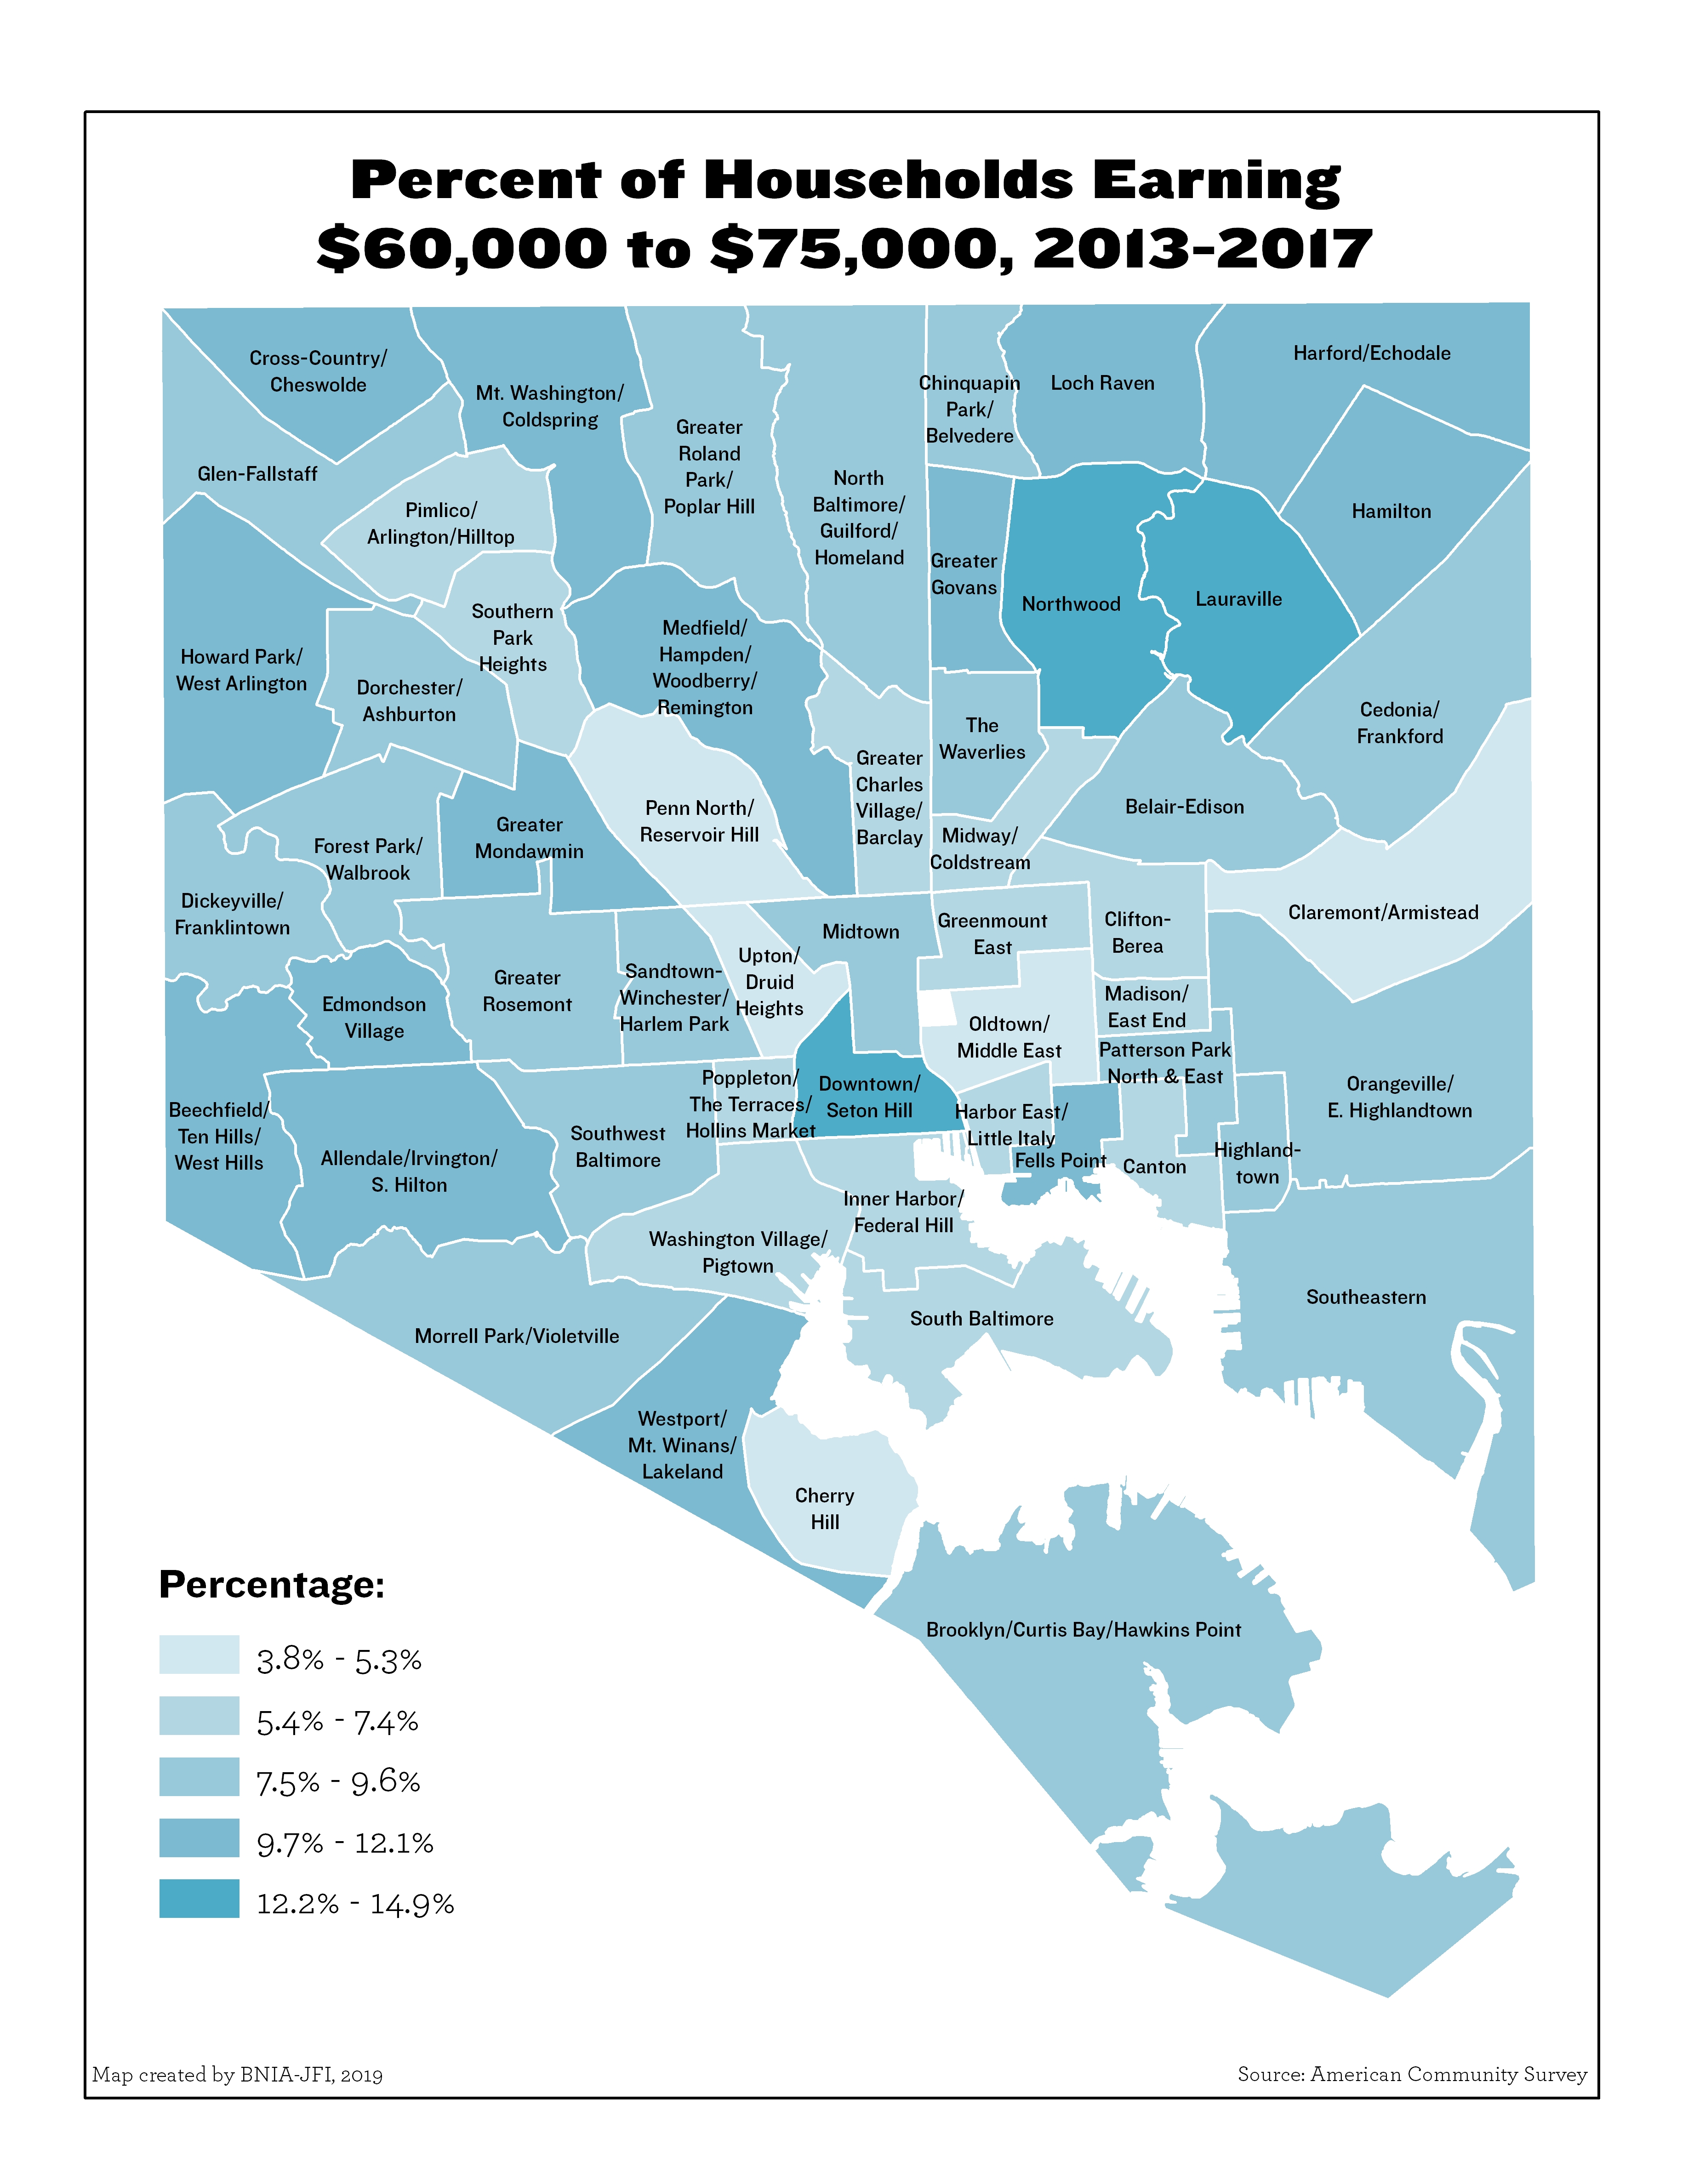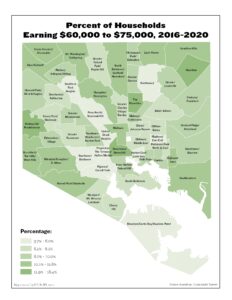
Percent of Households Earning $60,000 to $75,000 (2020)
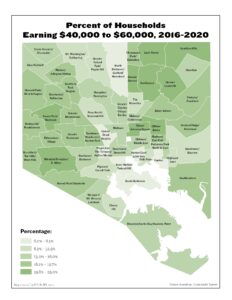
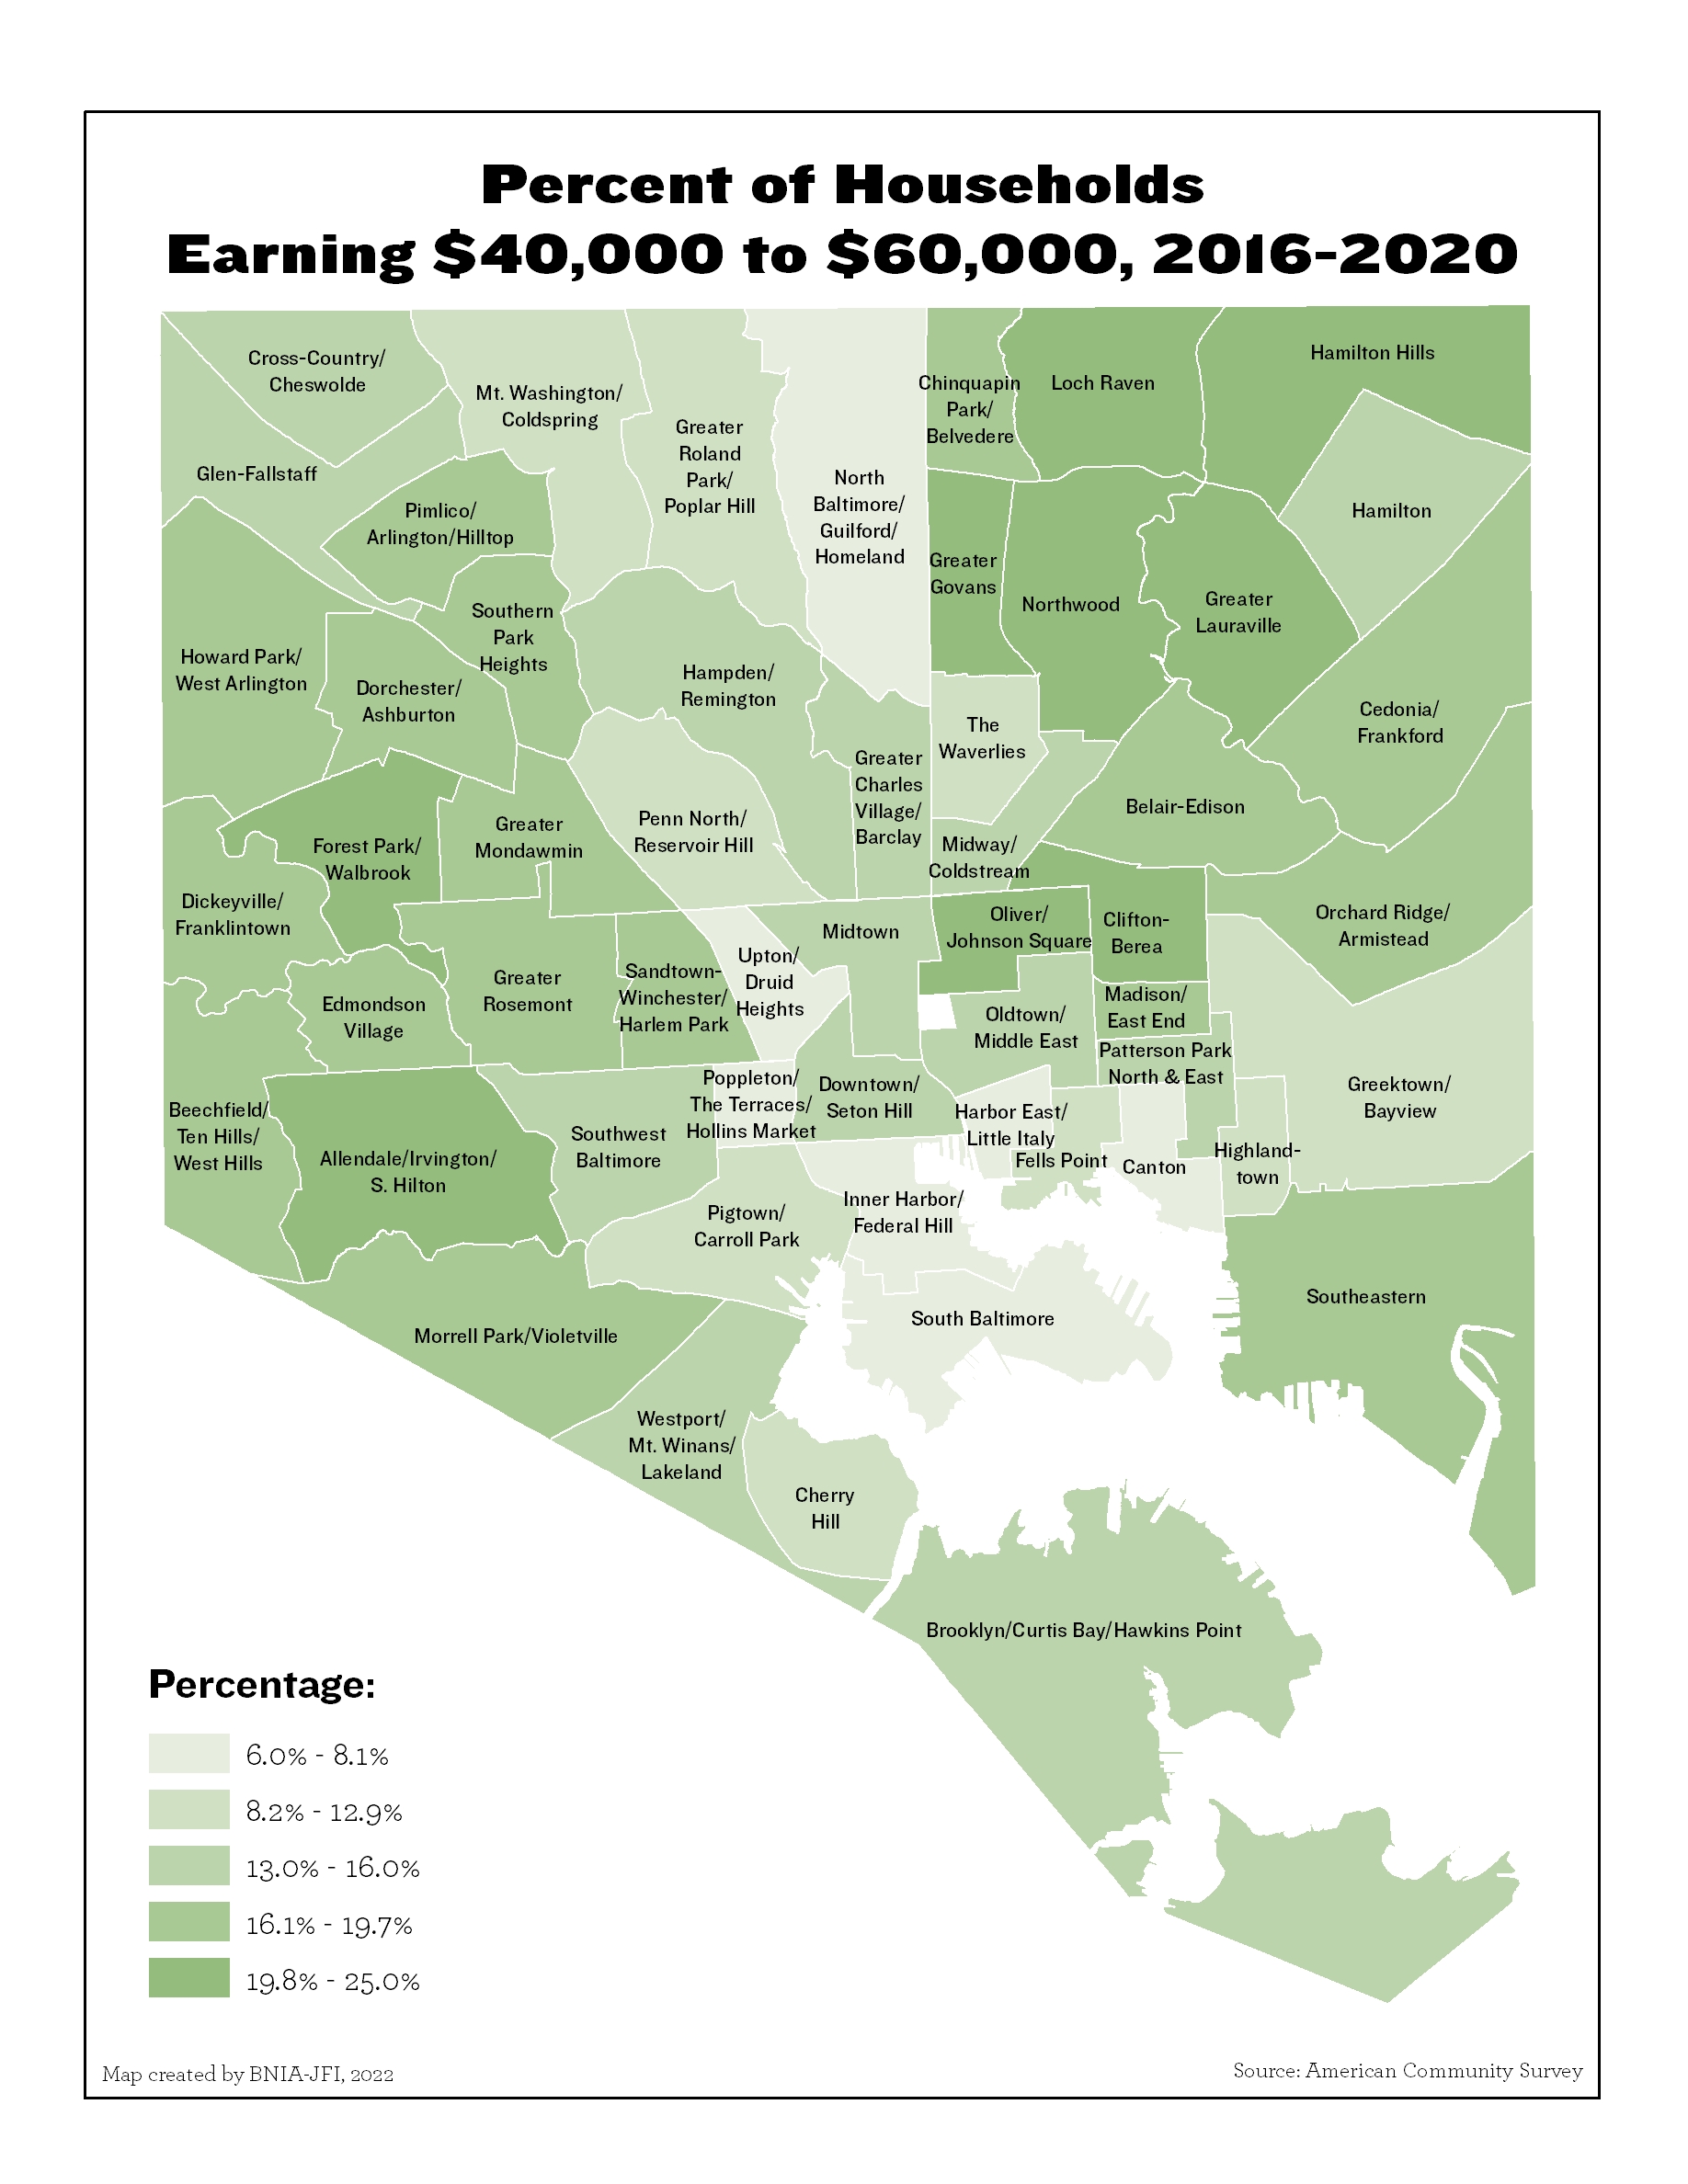
Percent of Households Earning $40,000 to $60,000 (2020)
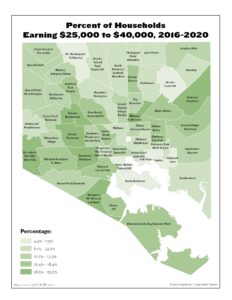
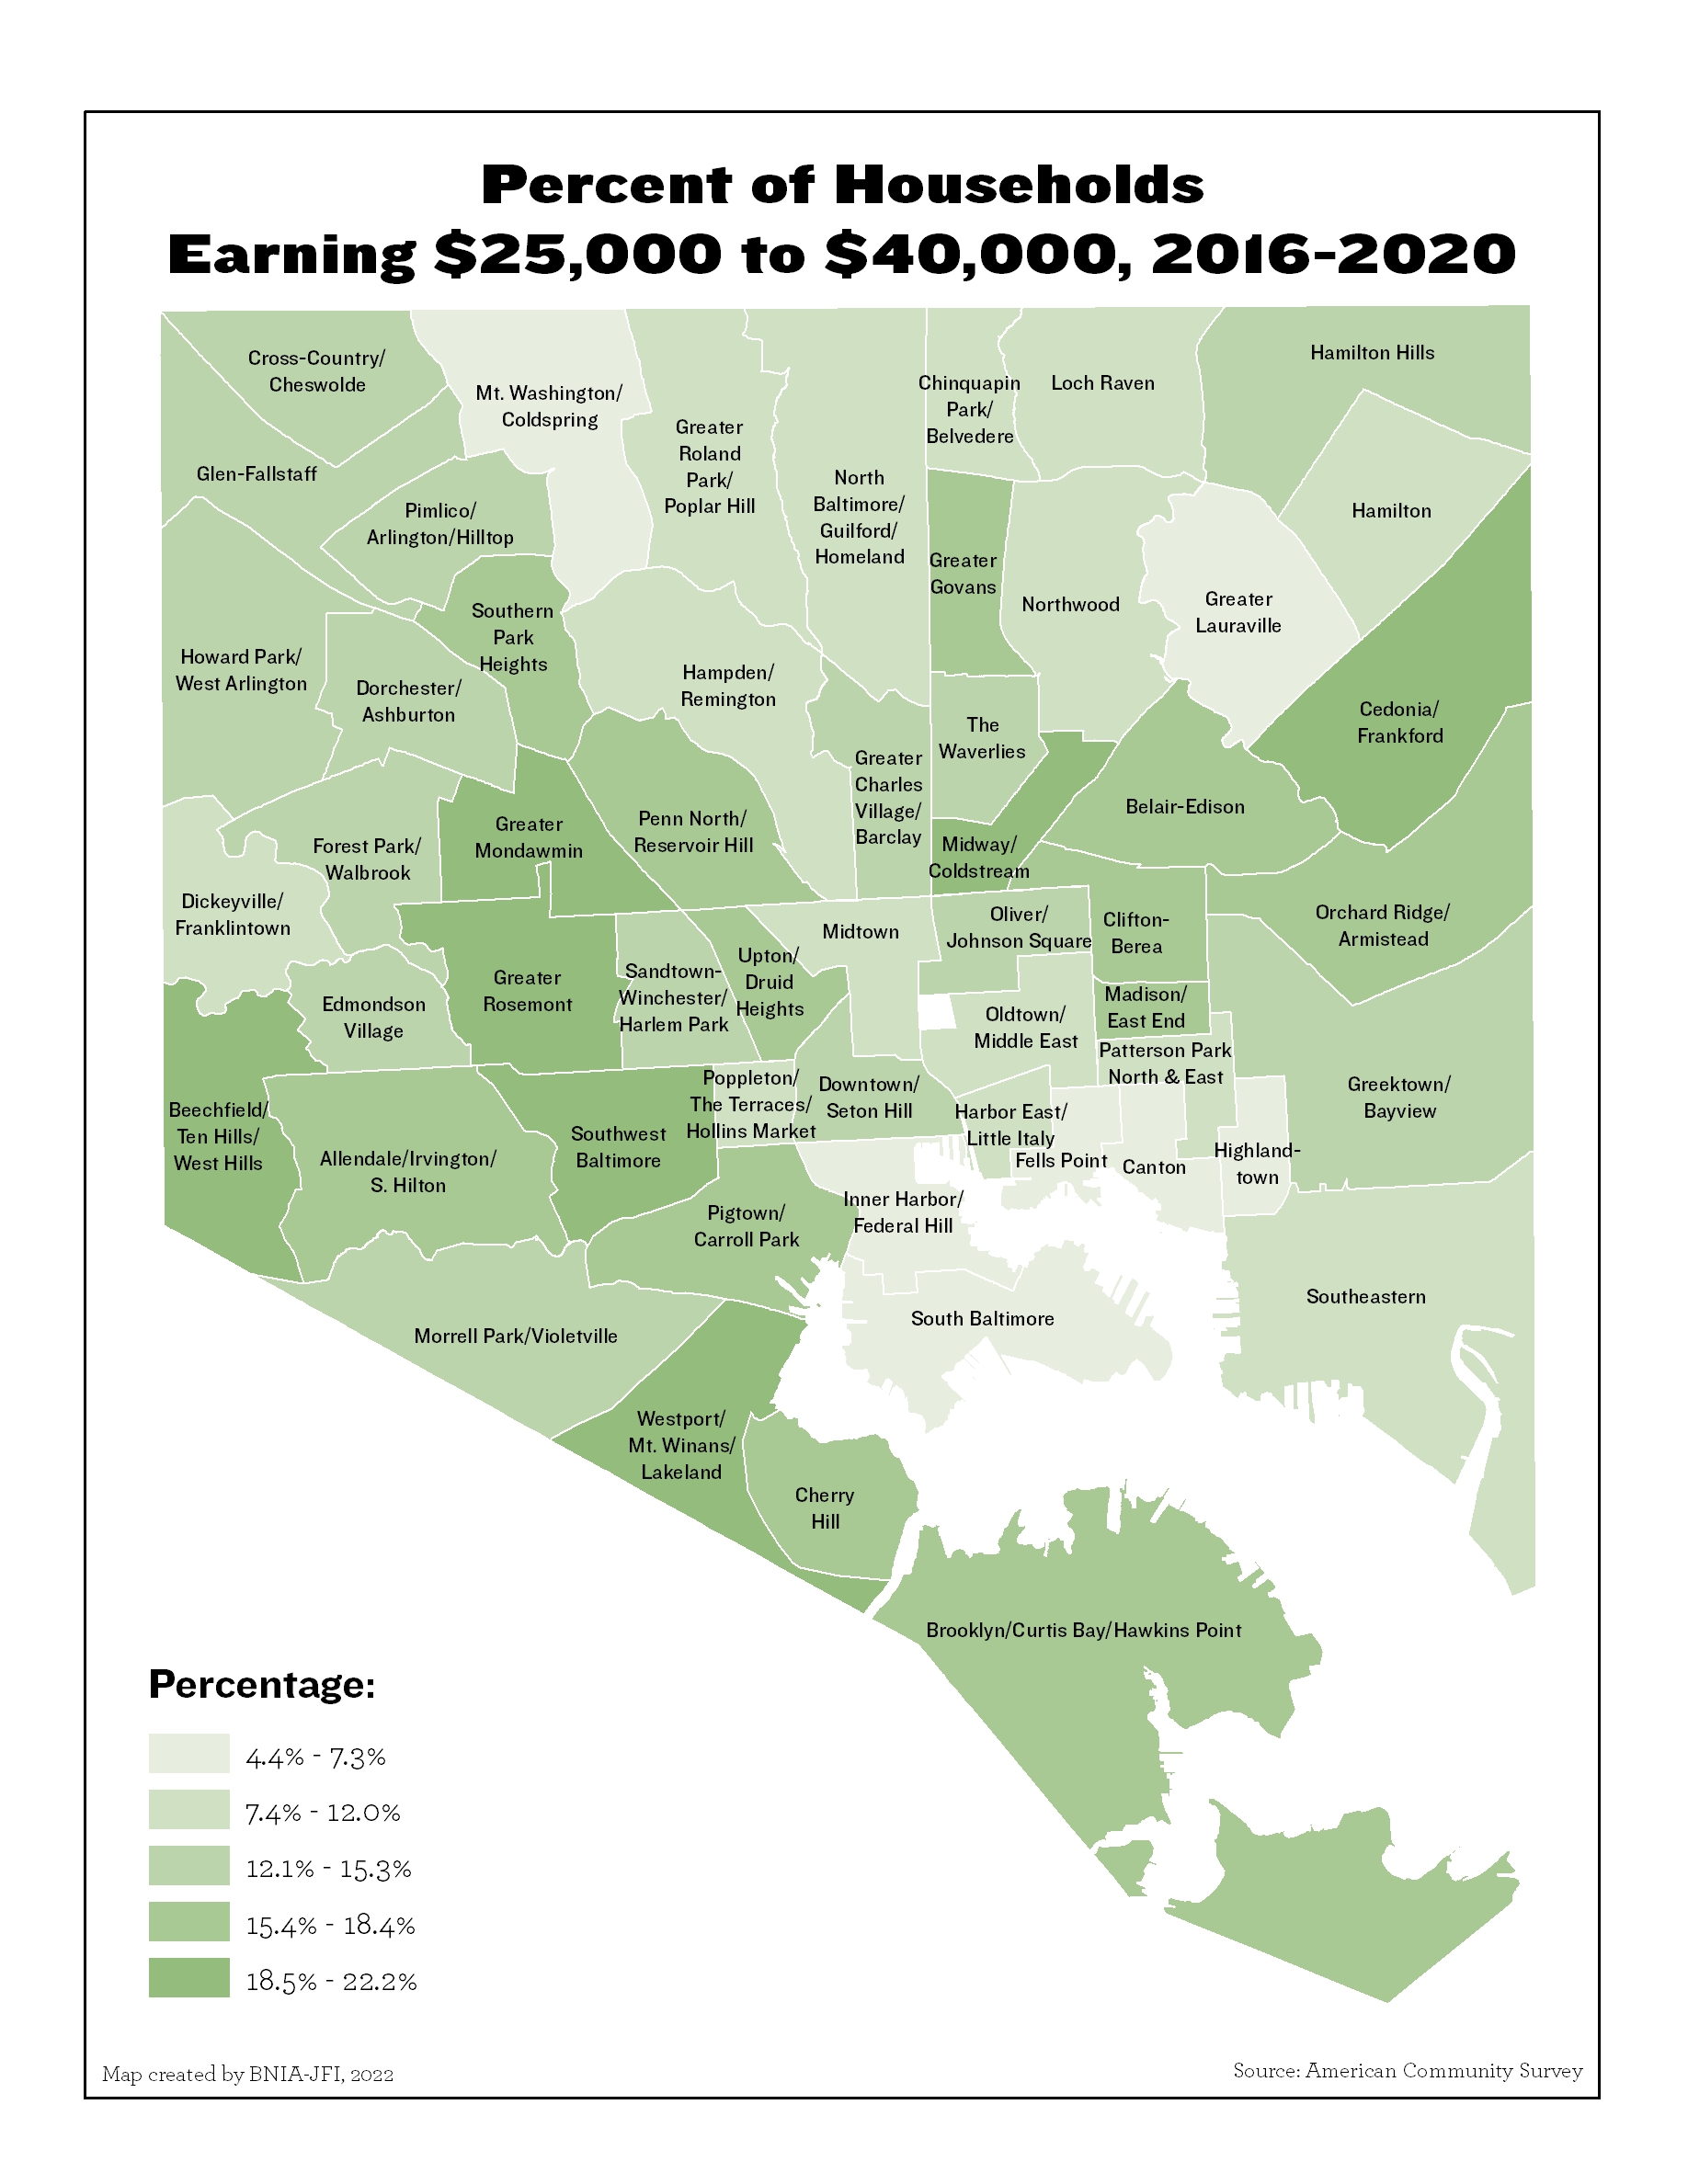
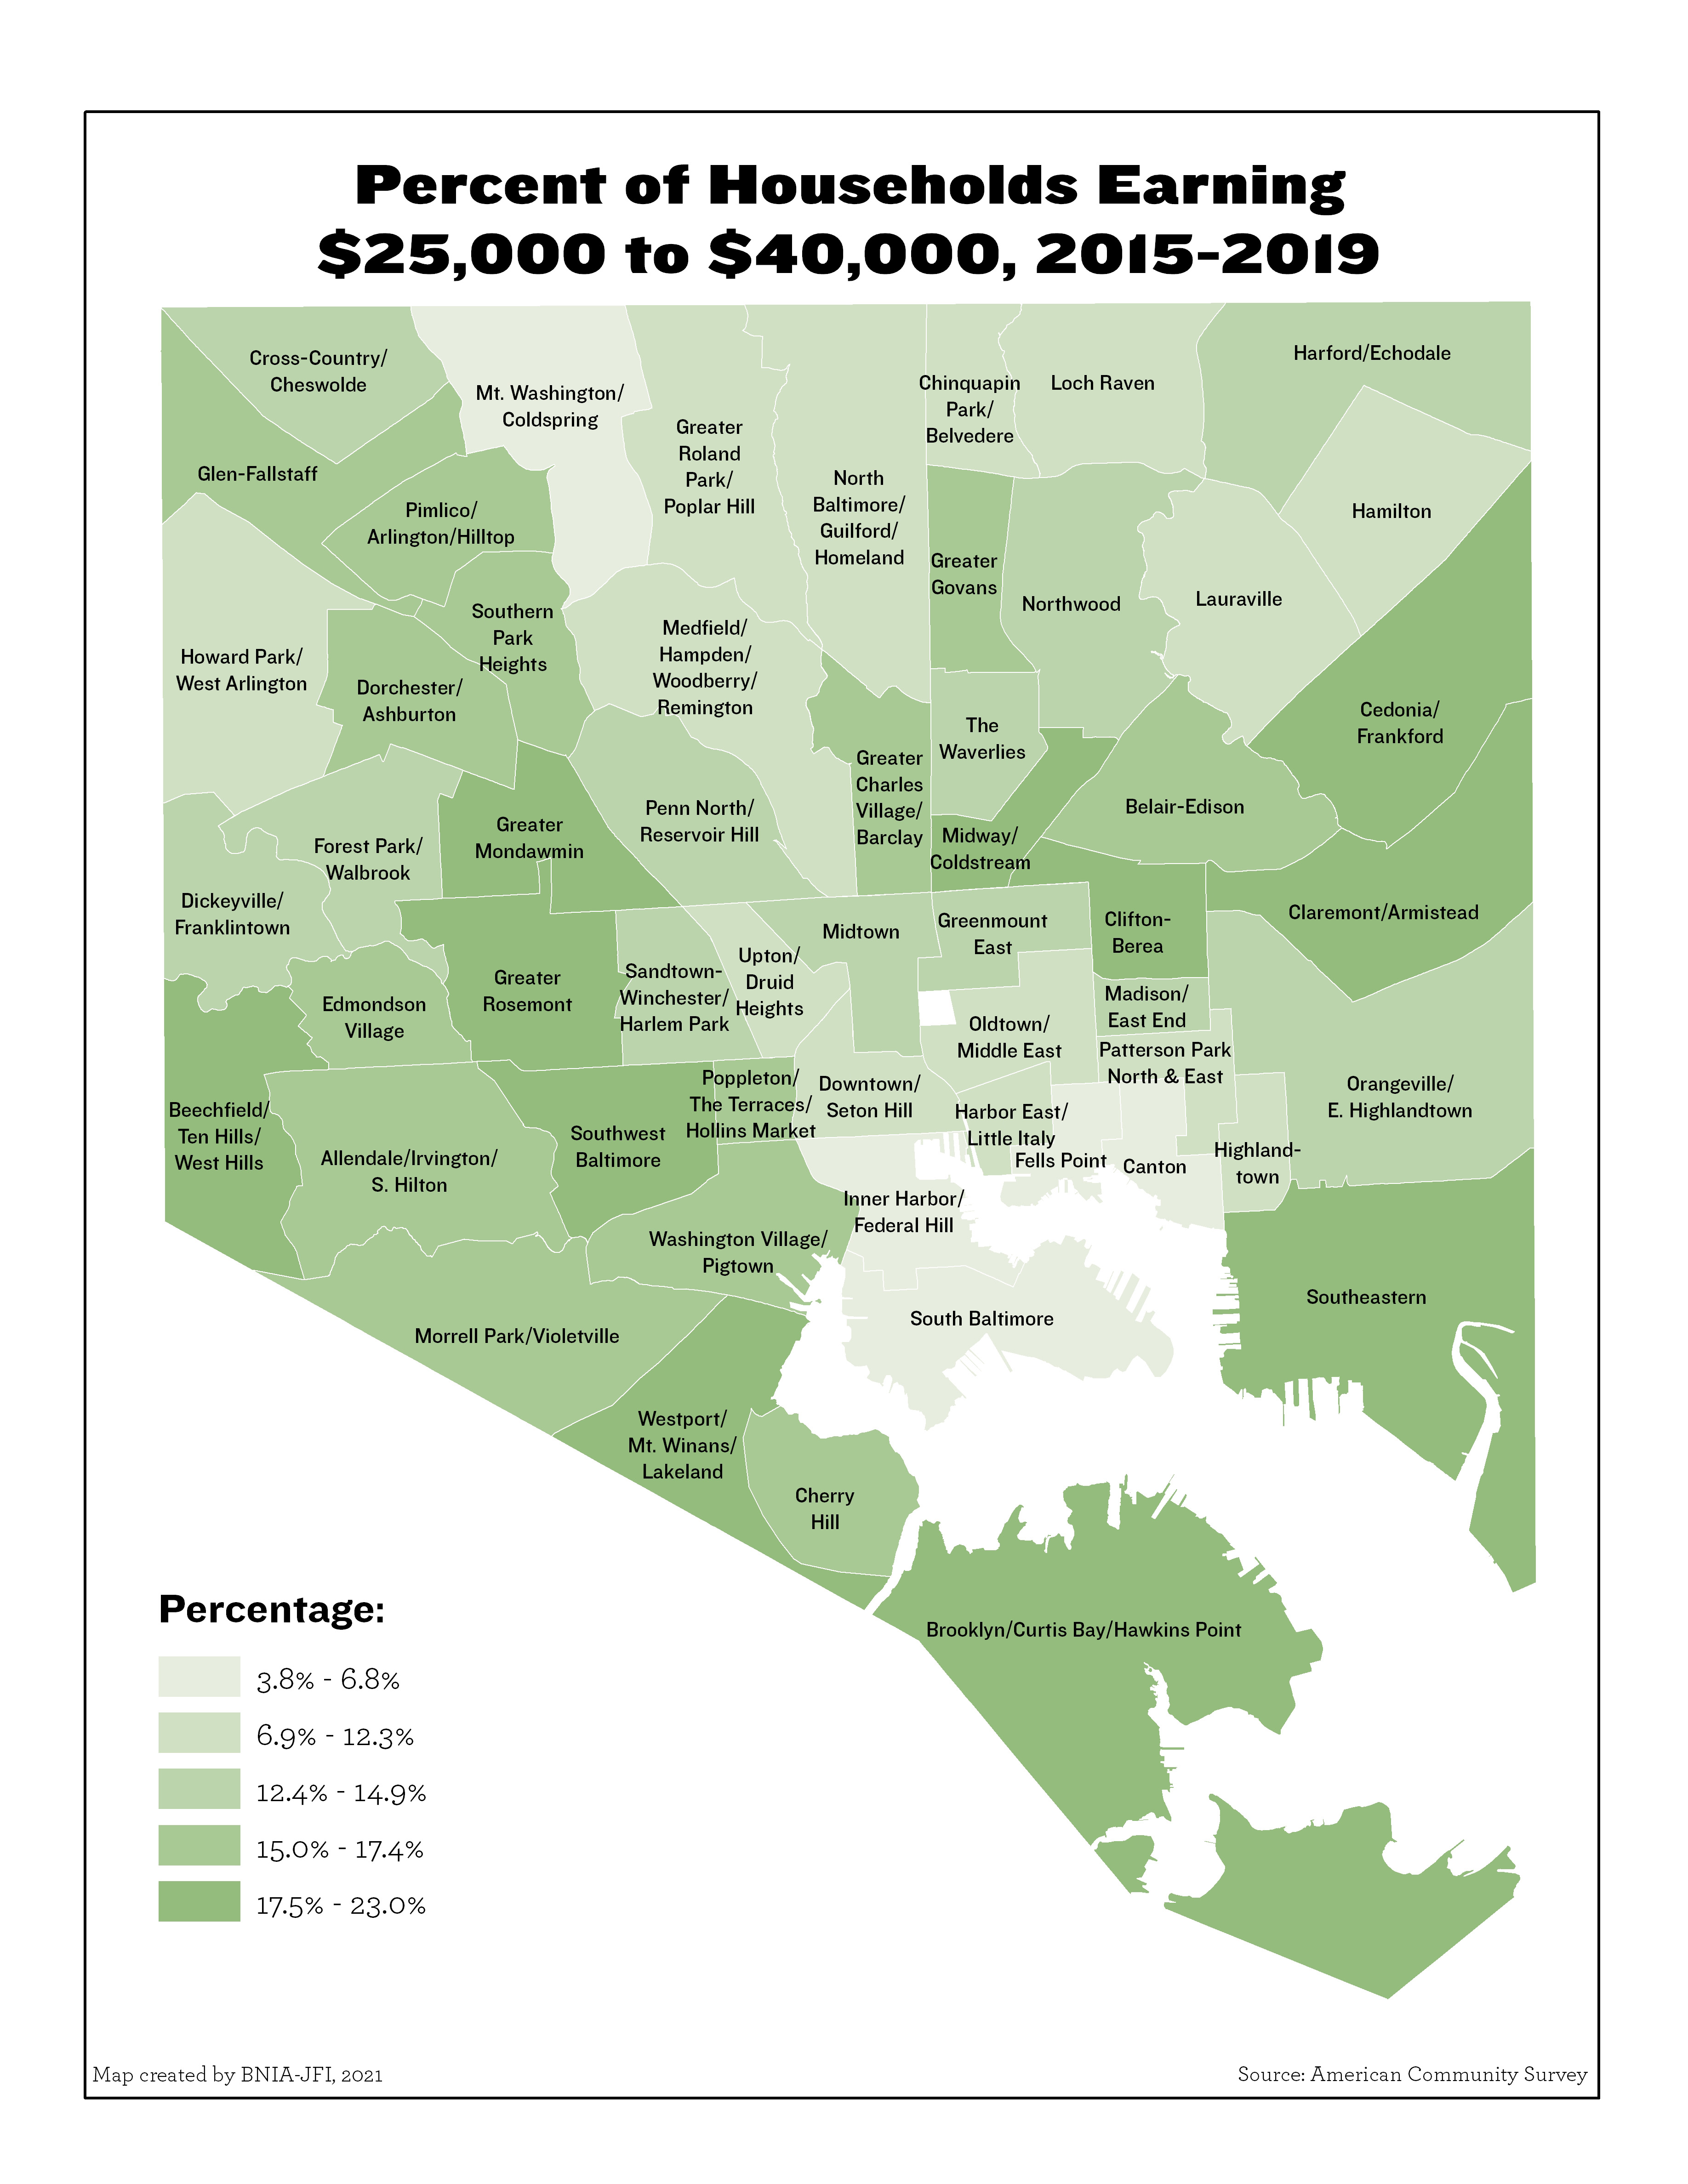
Percent of Households Earning $25,000 to $40,000 (2020)
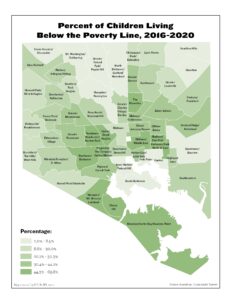
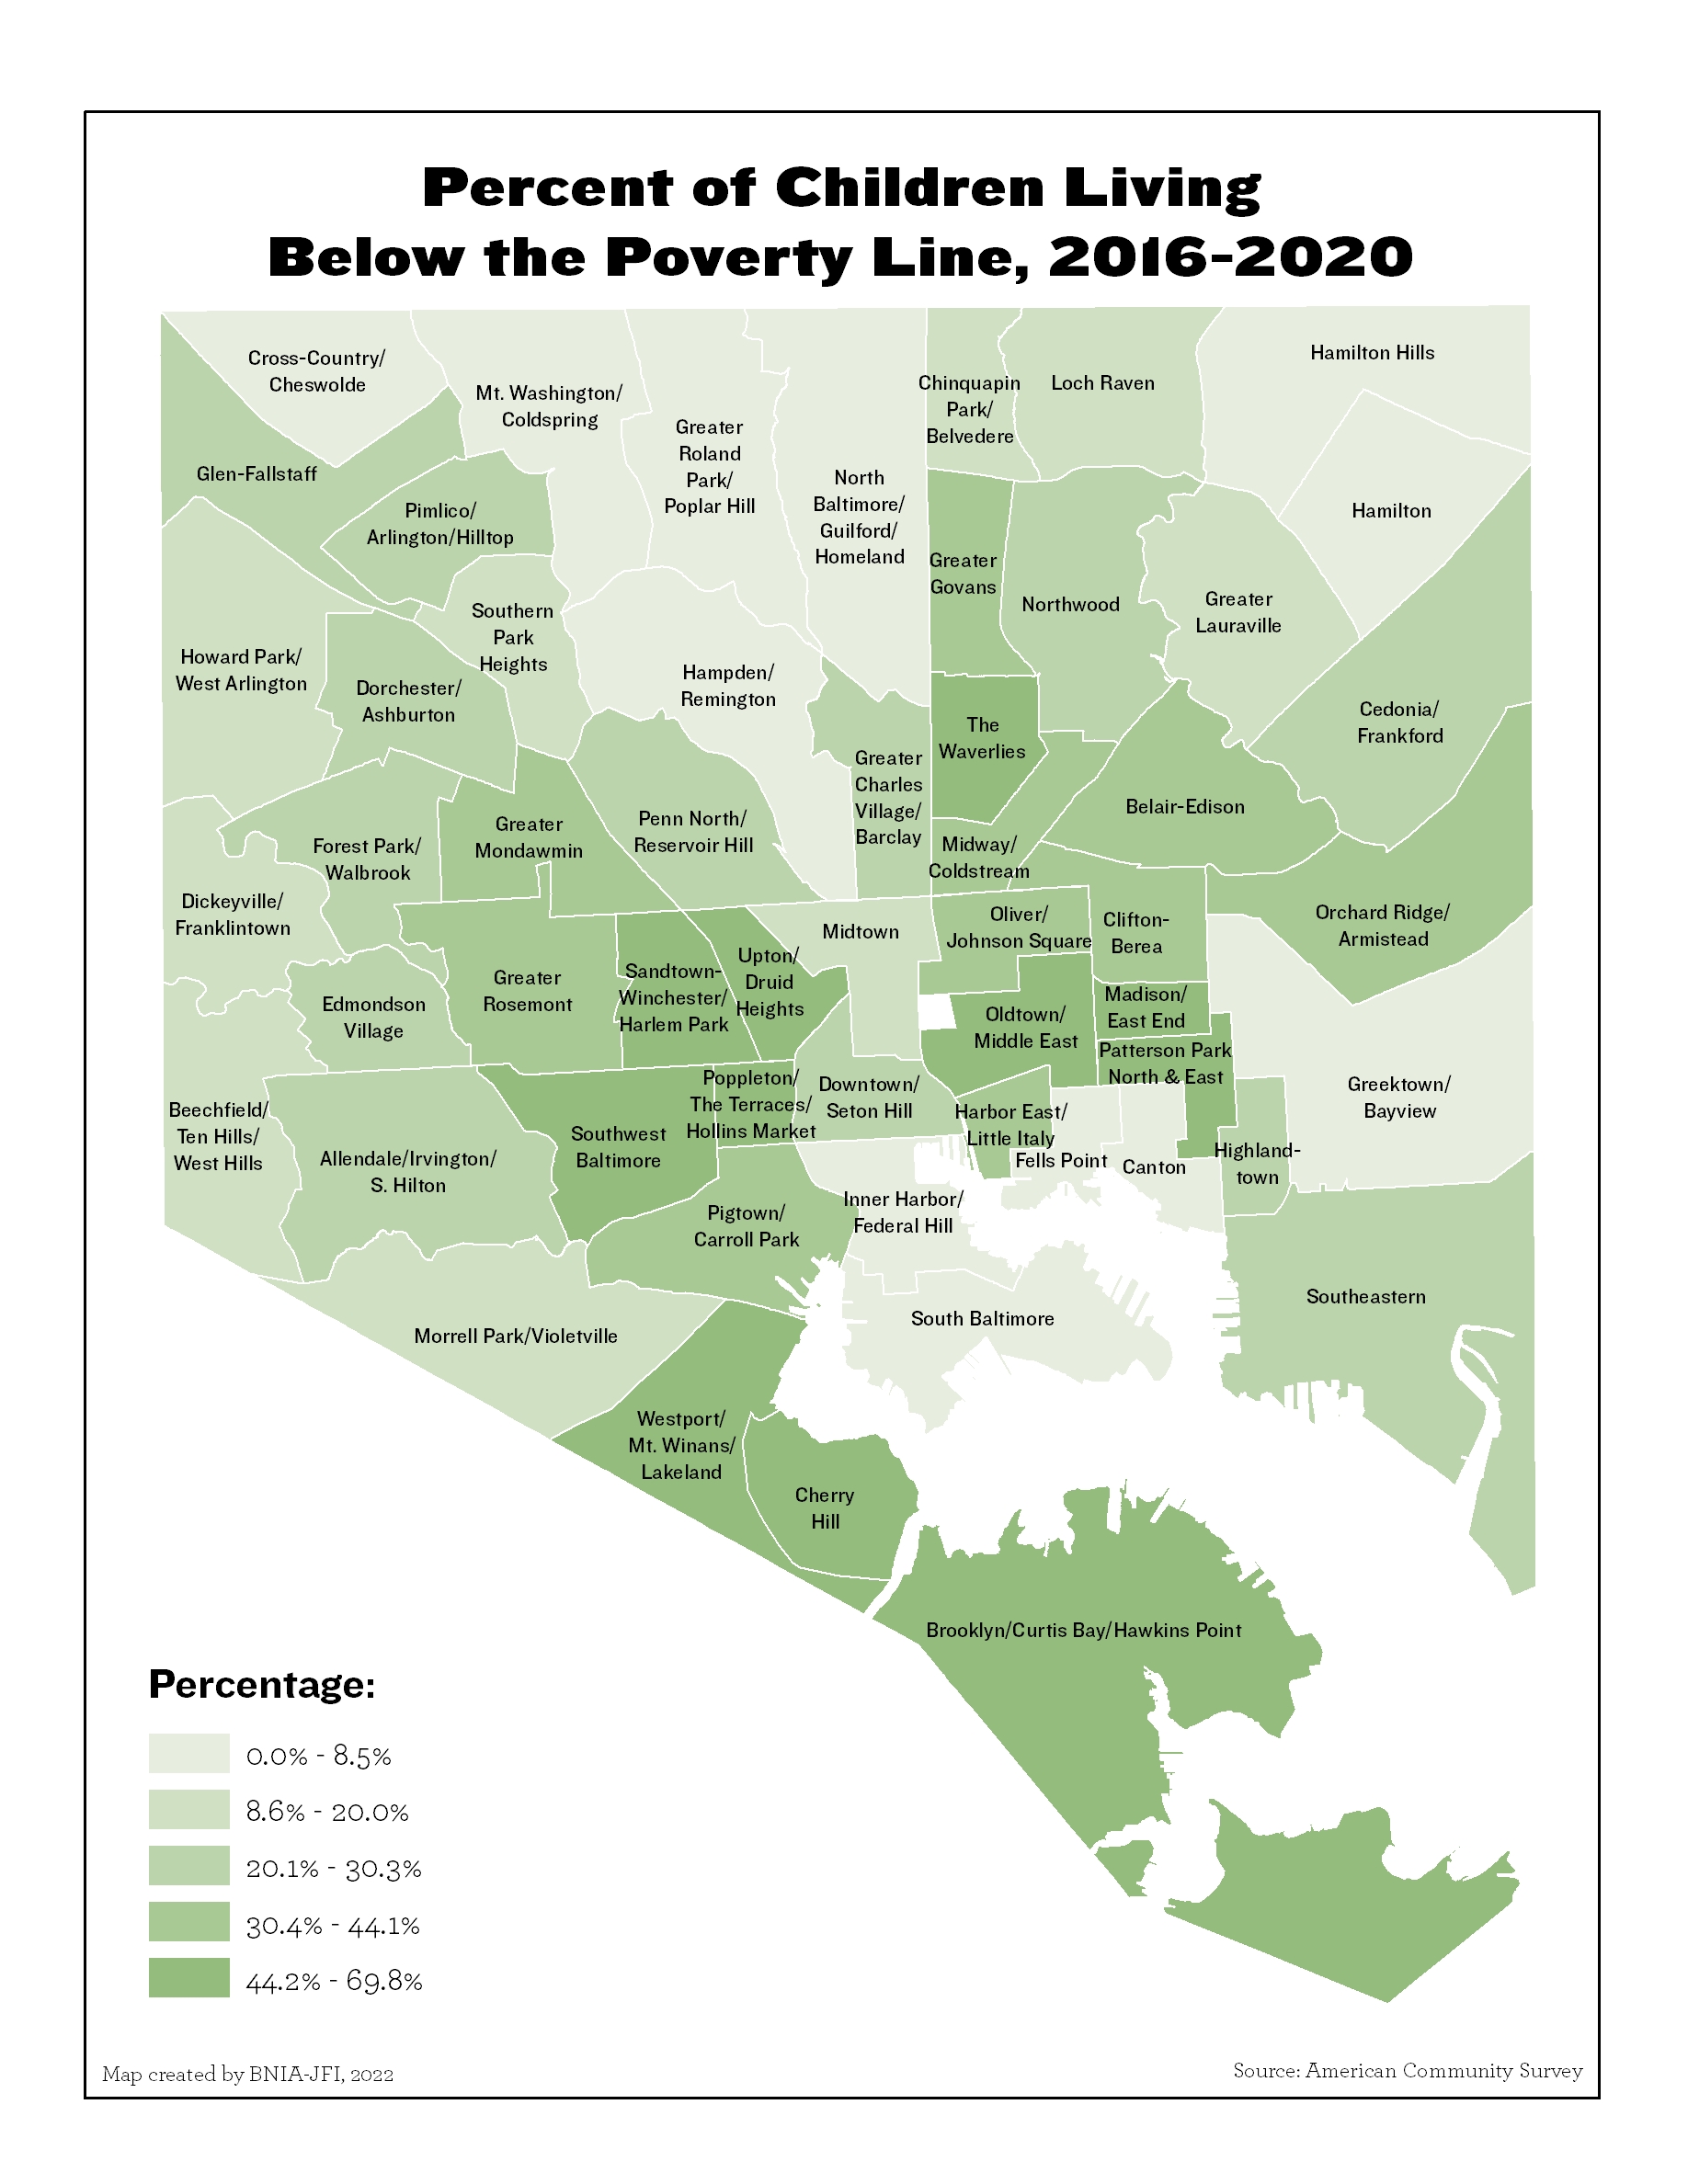
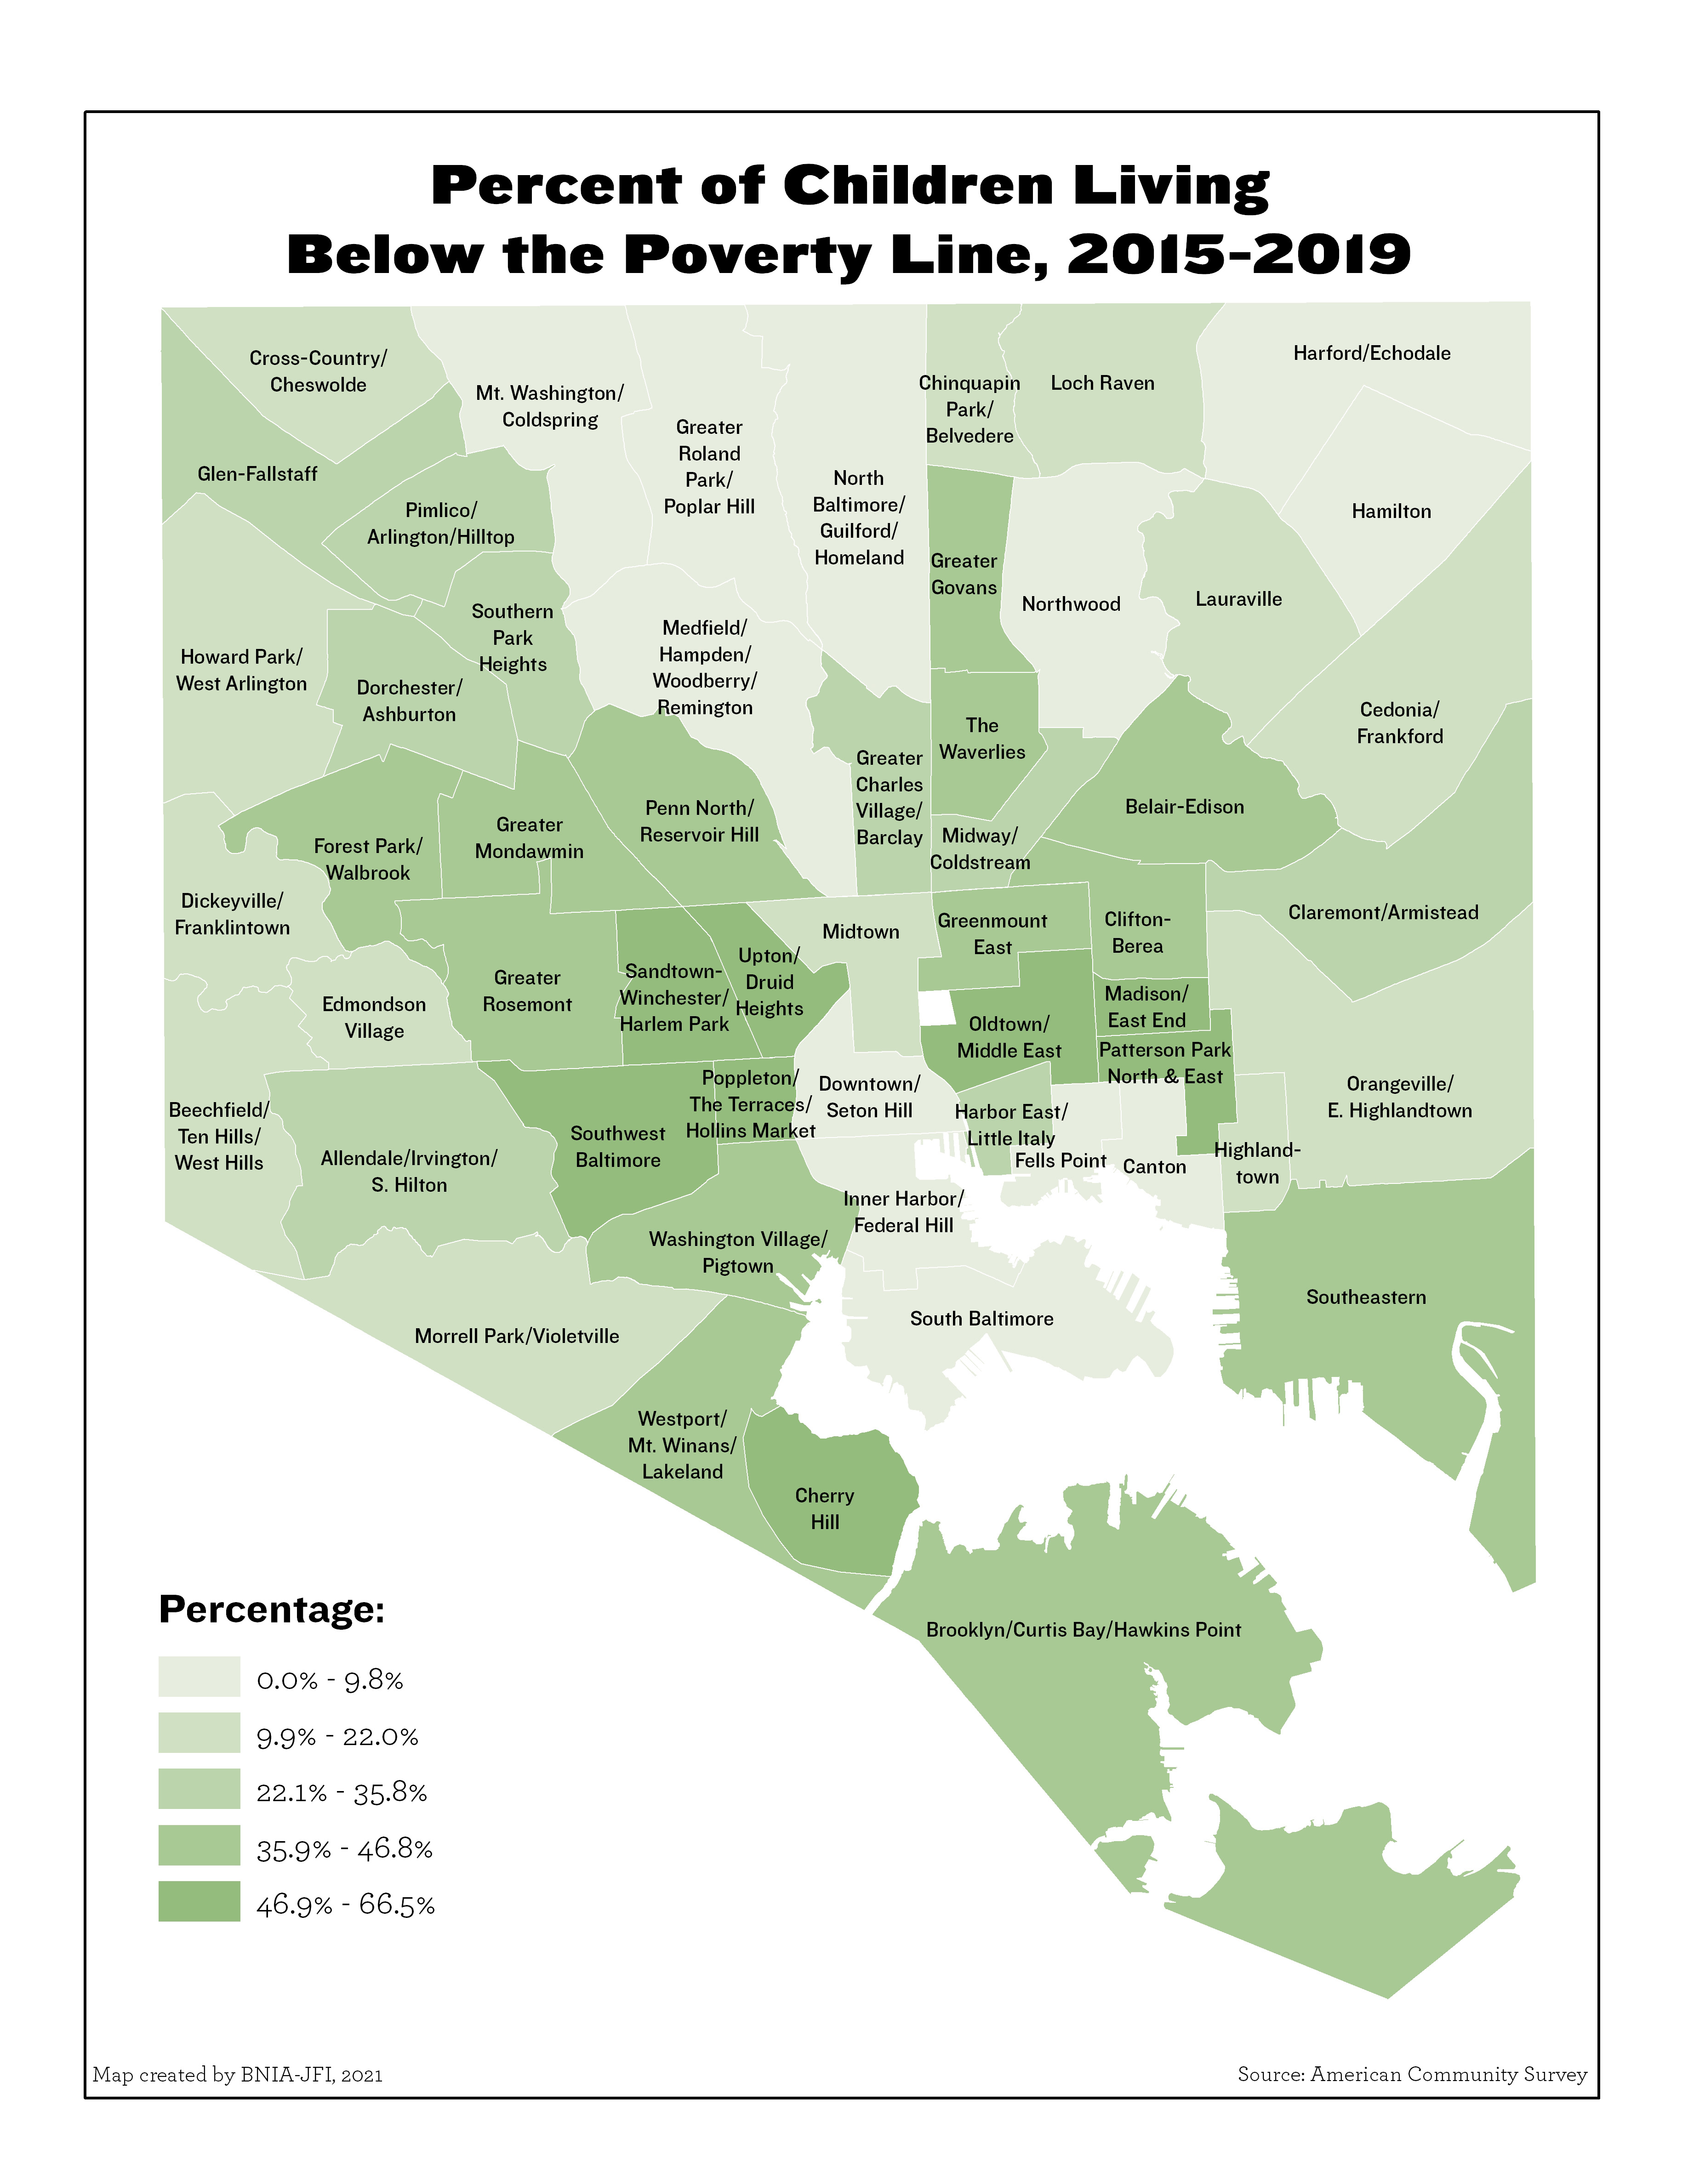
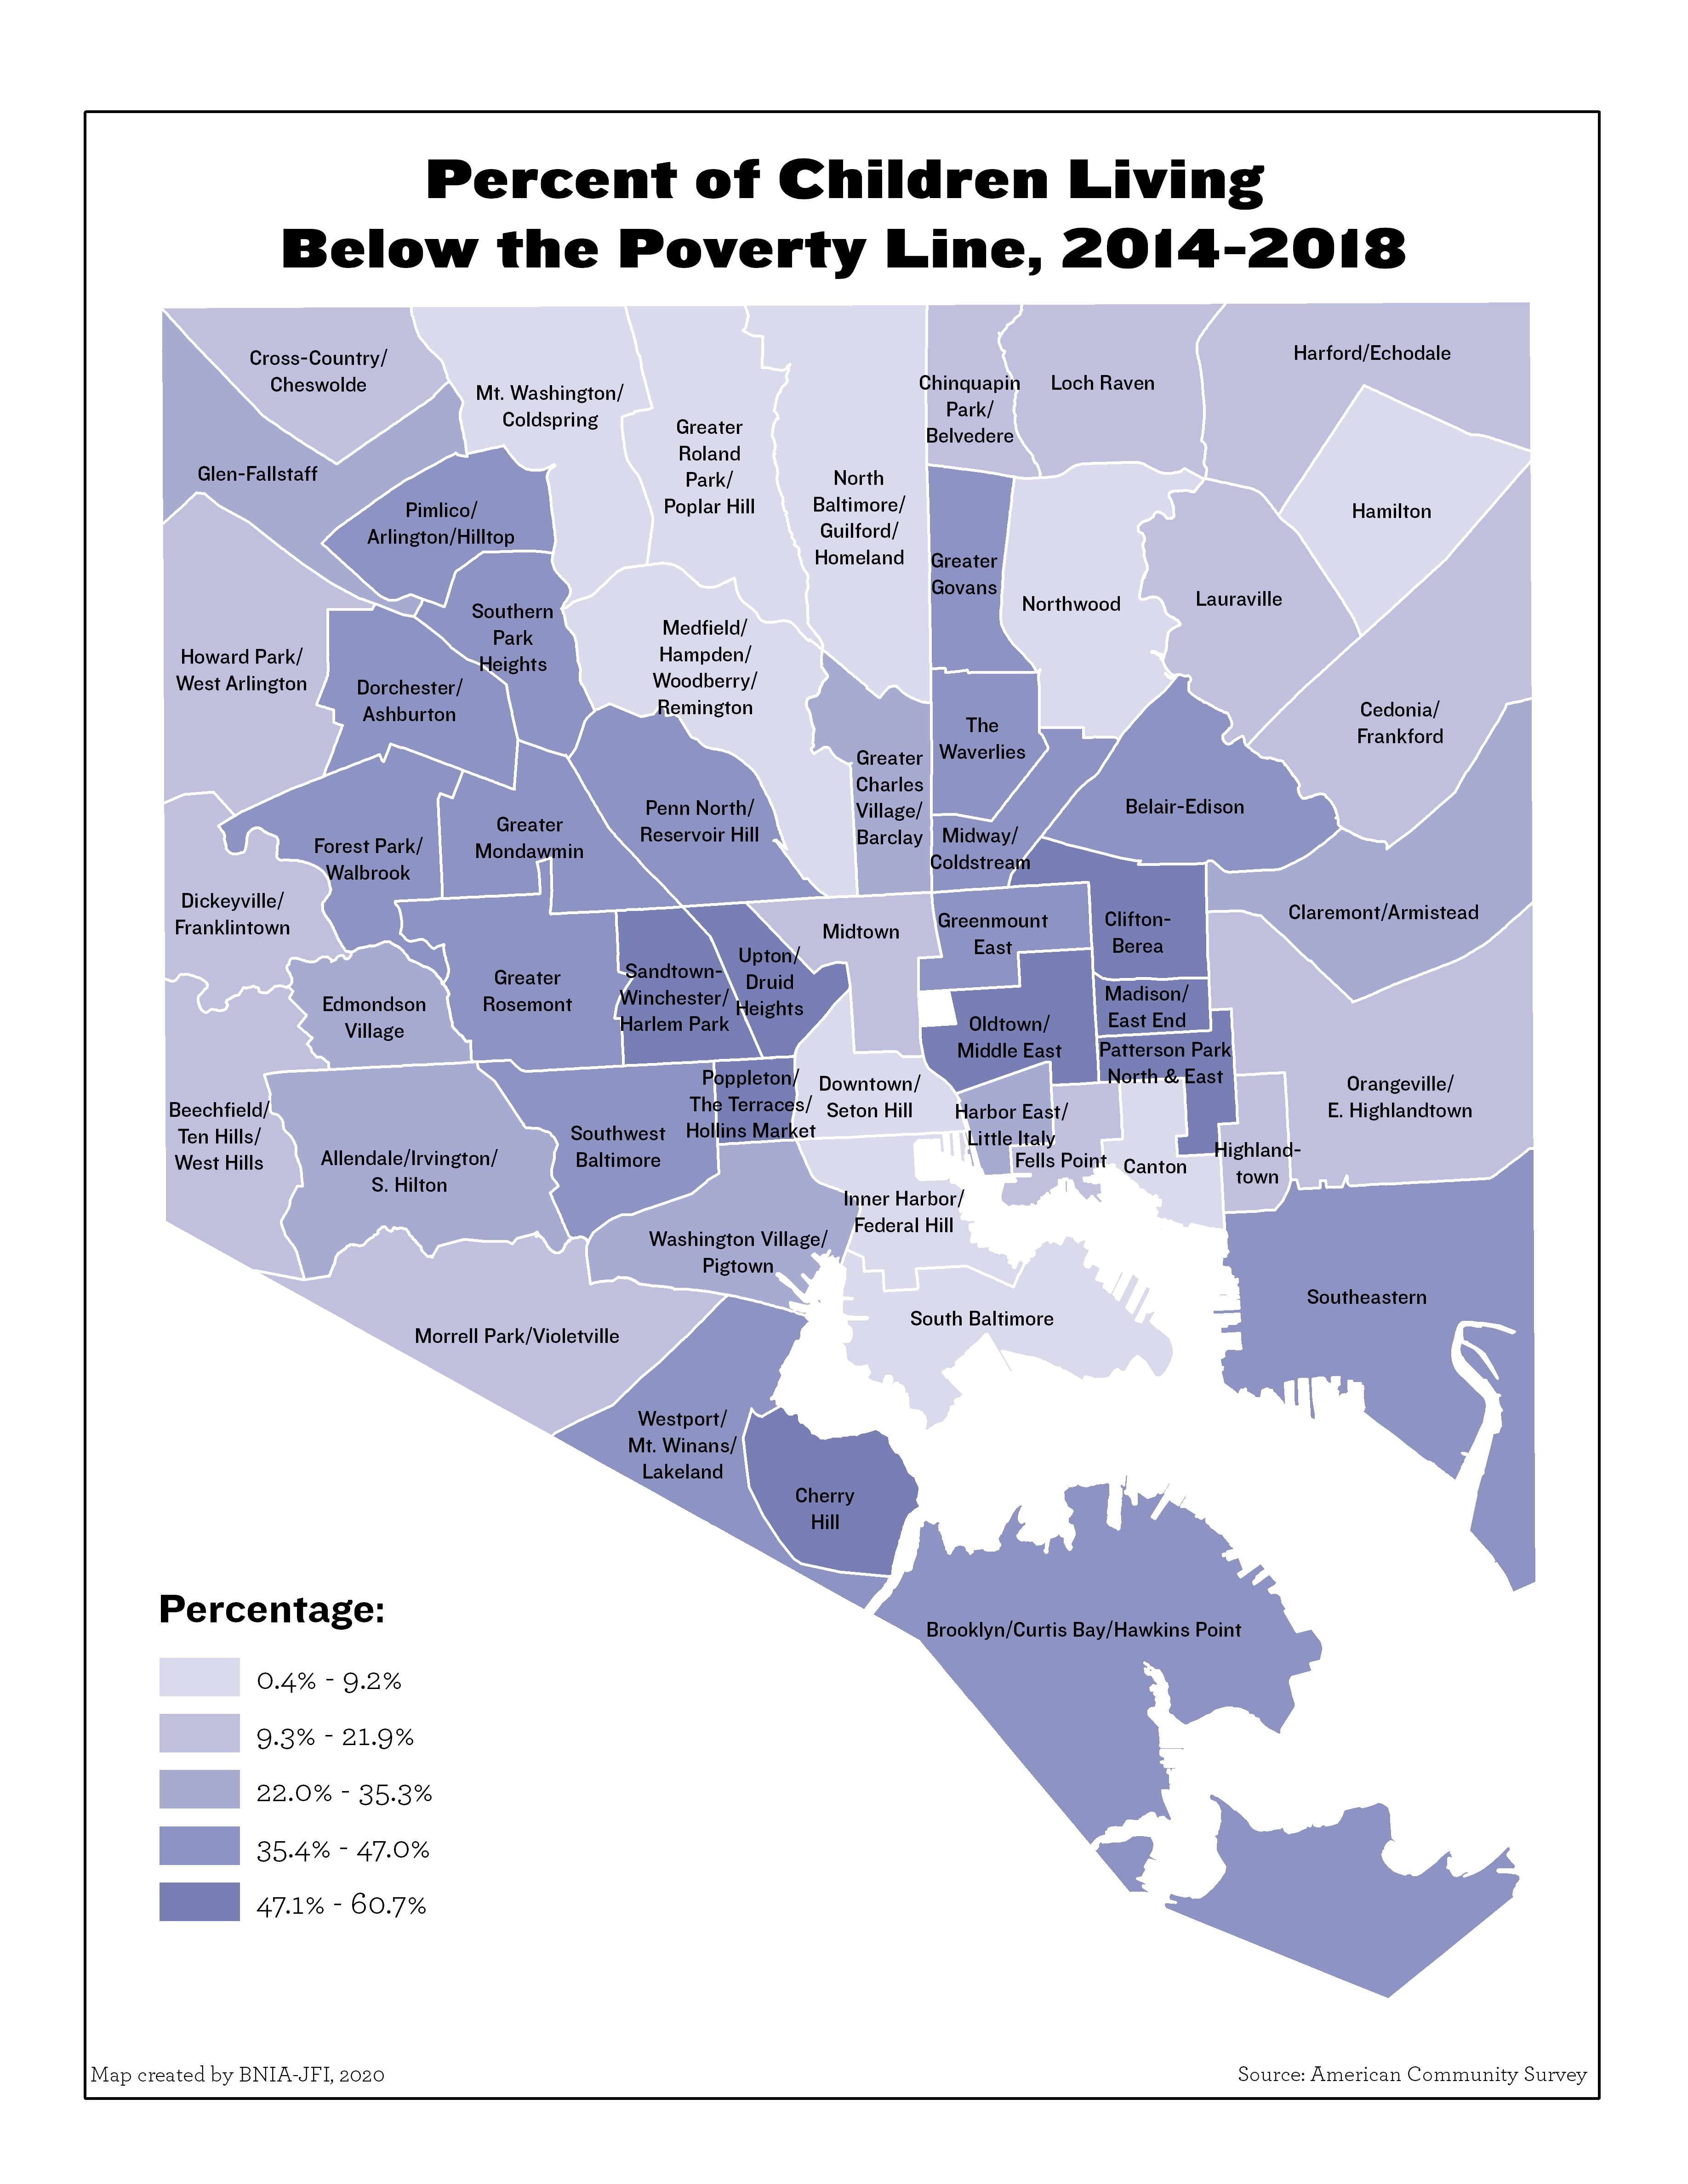
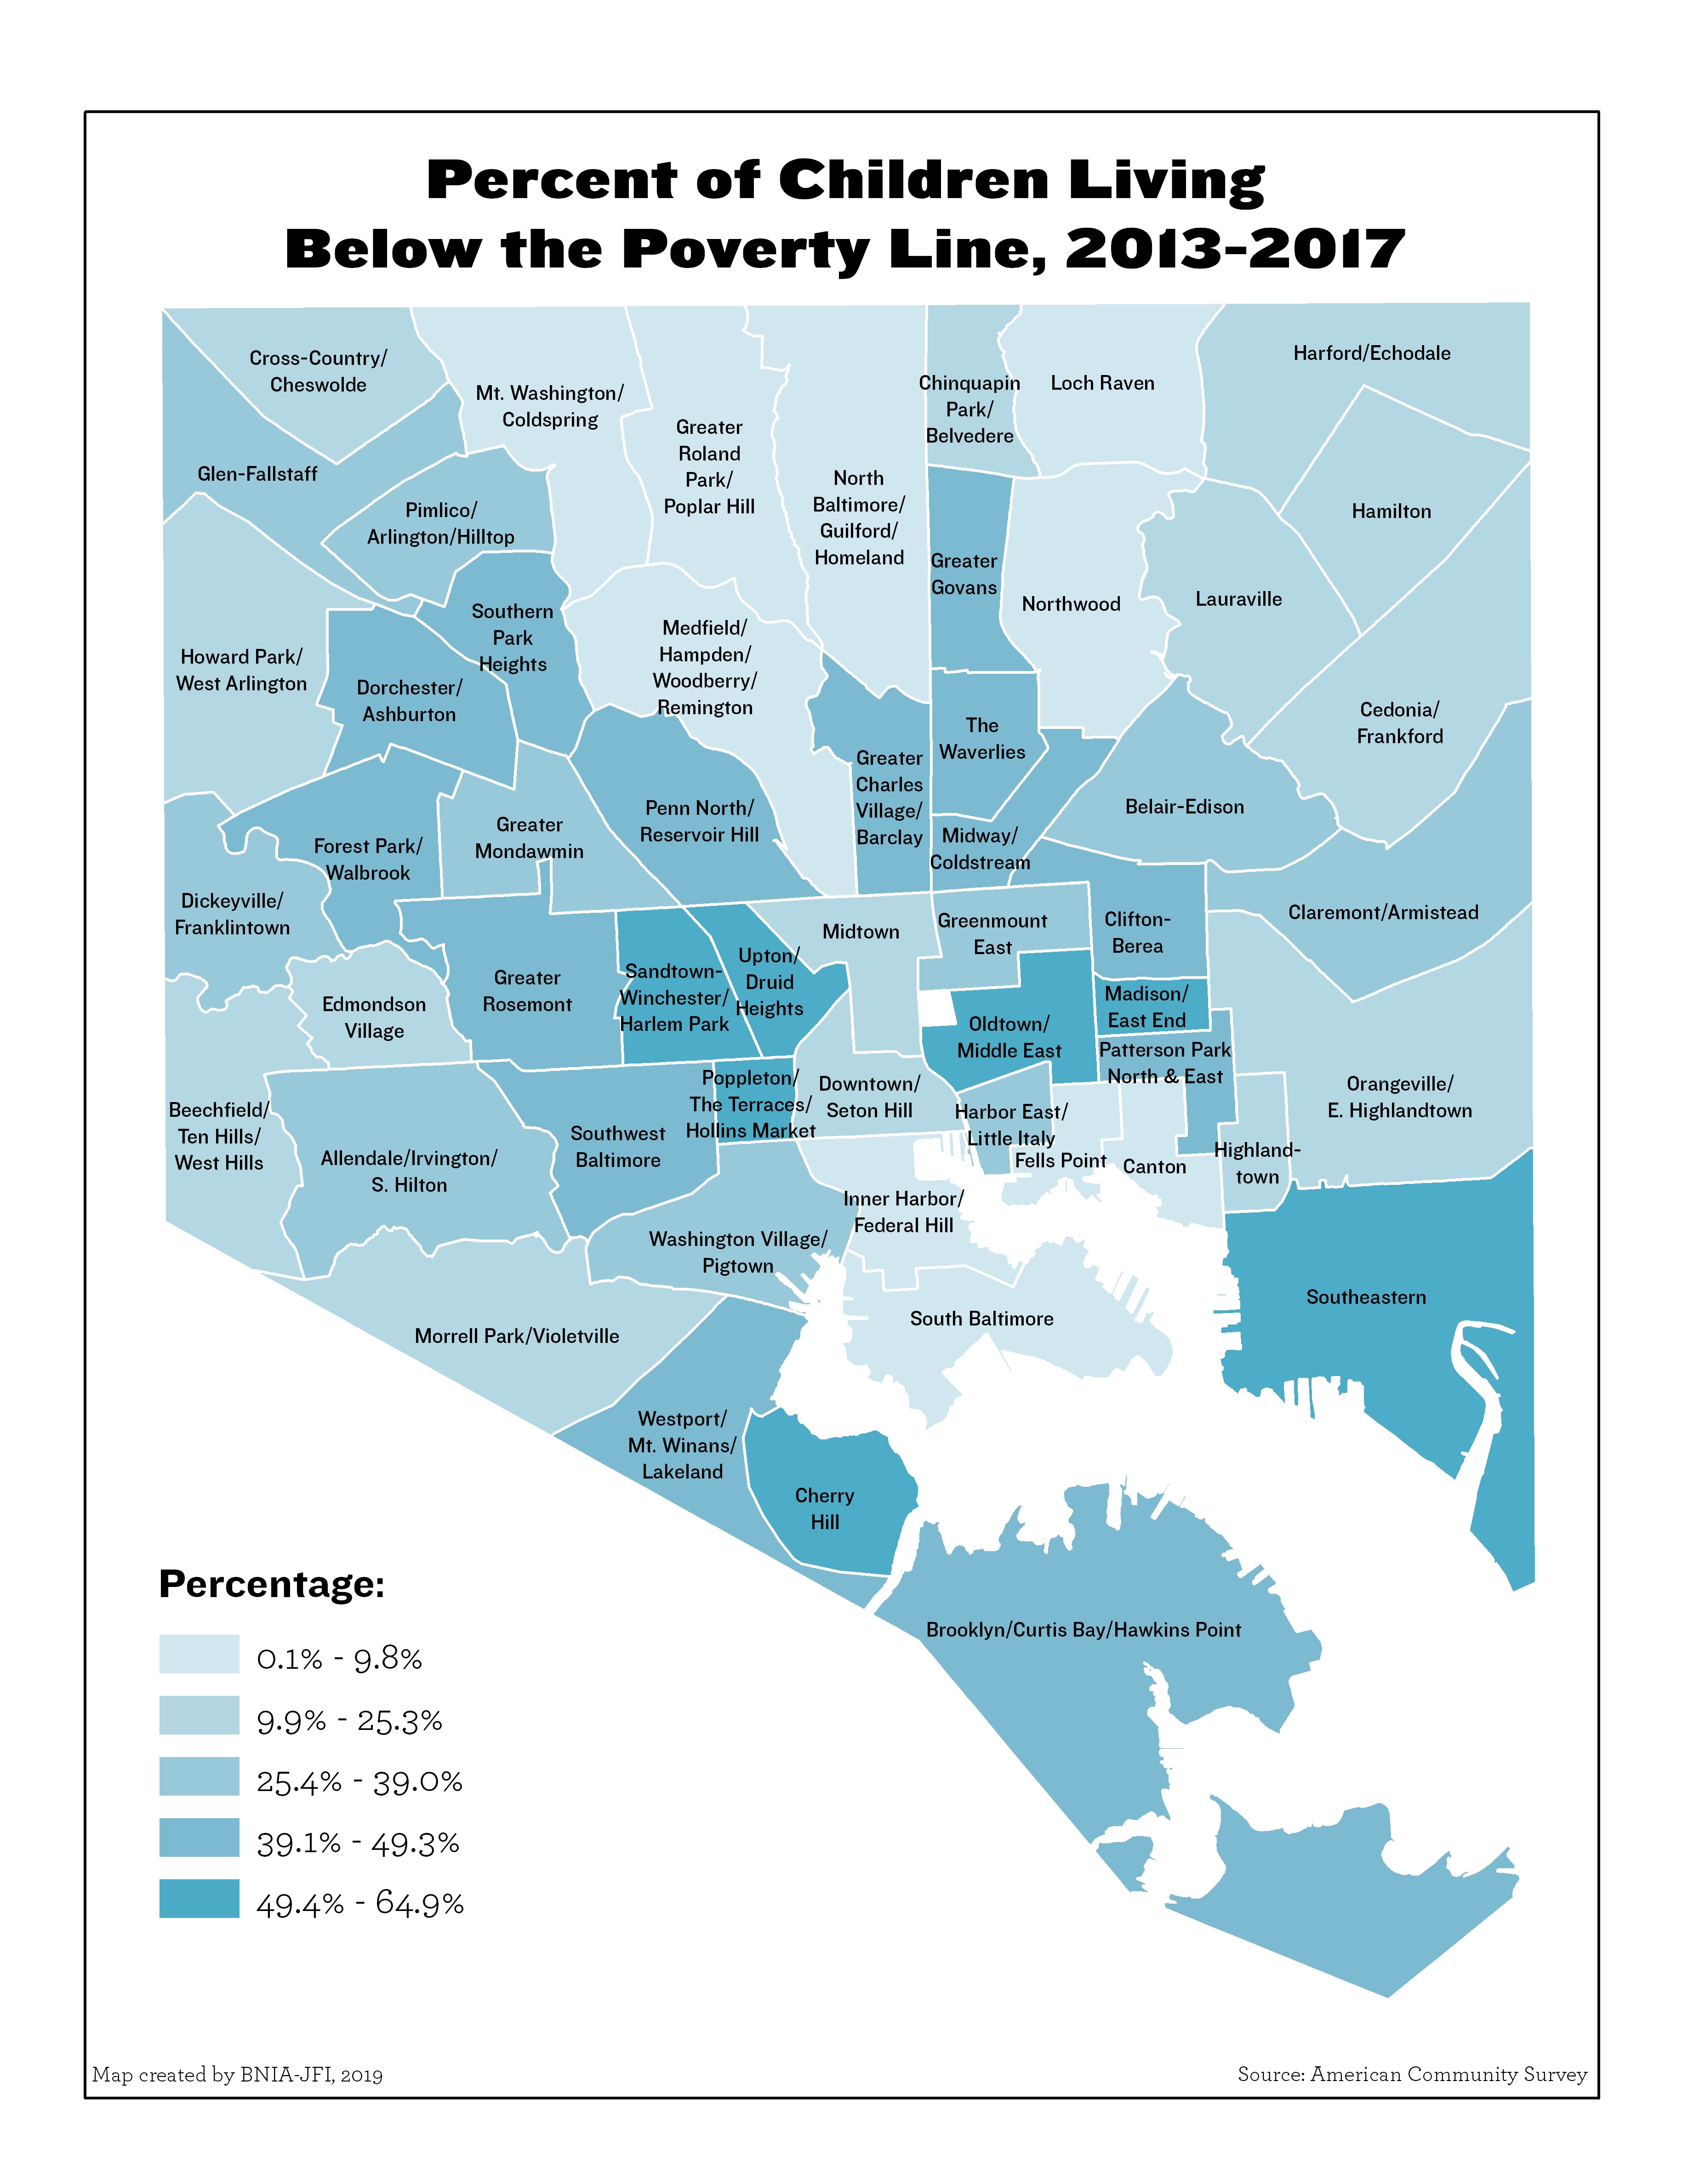
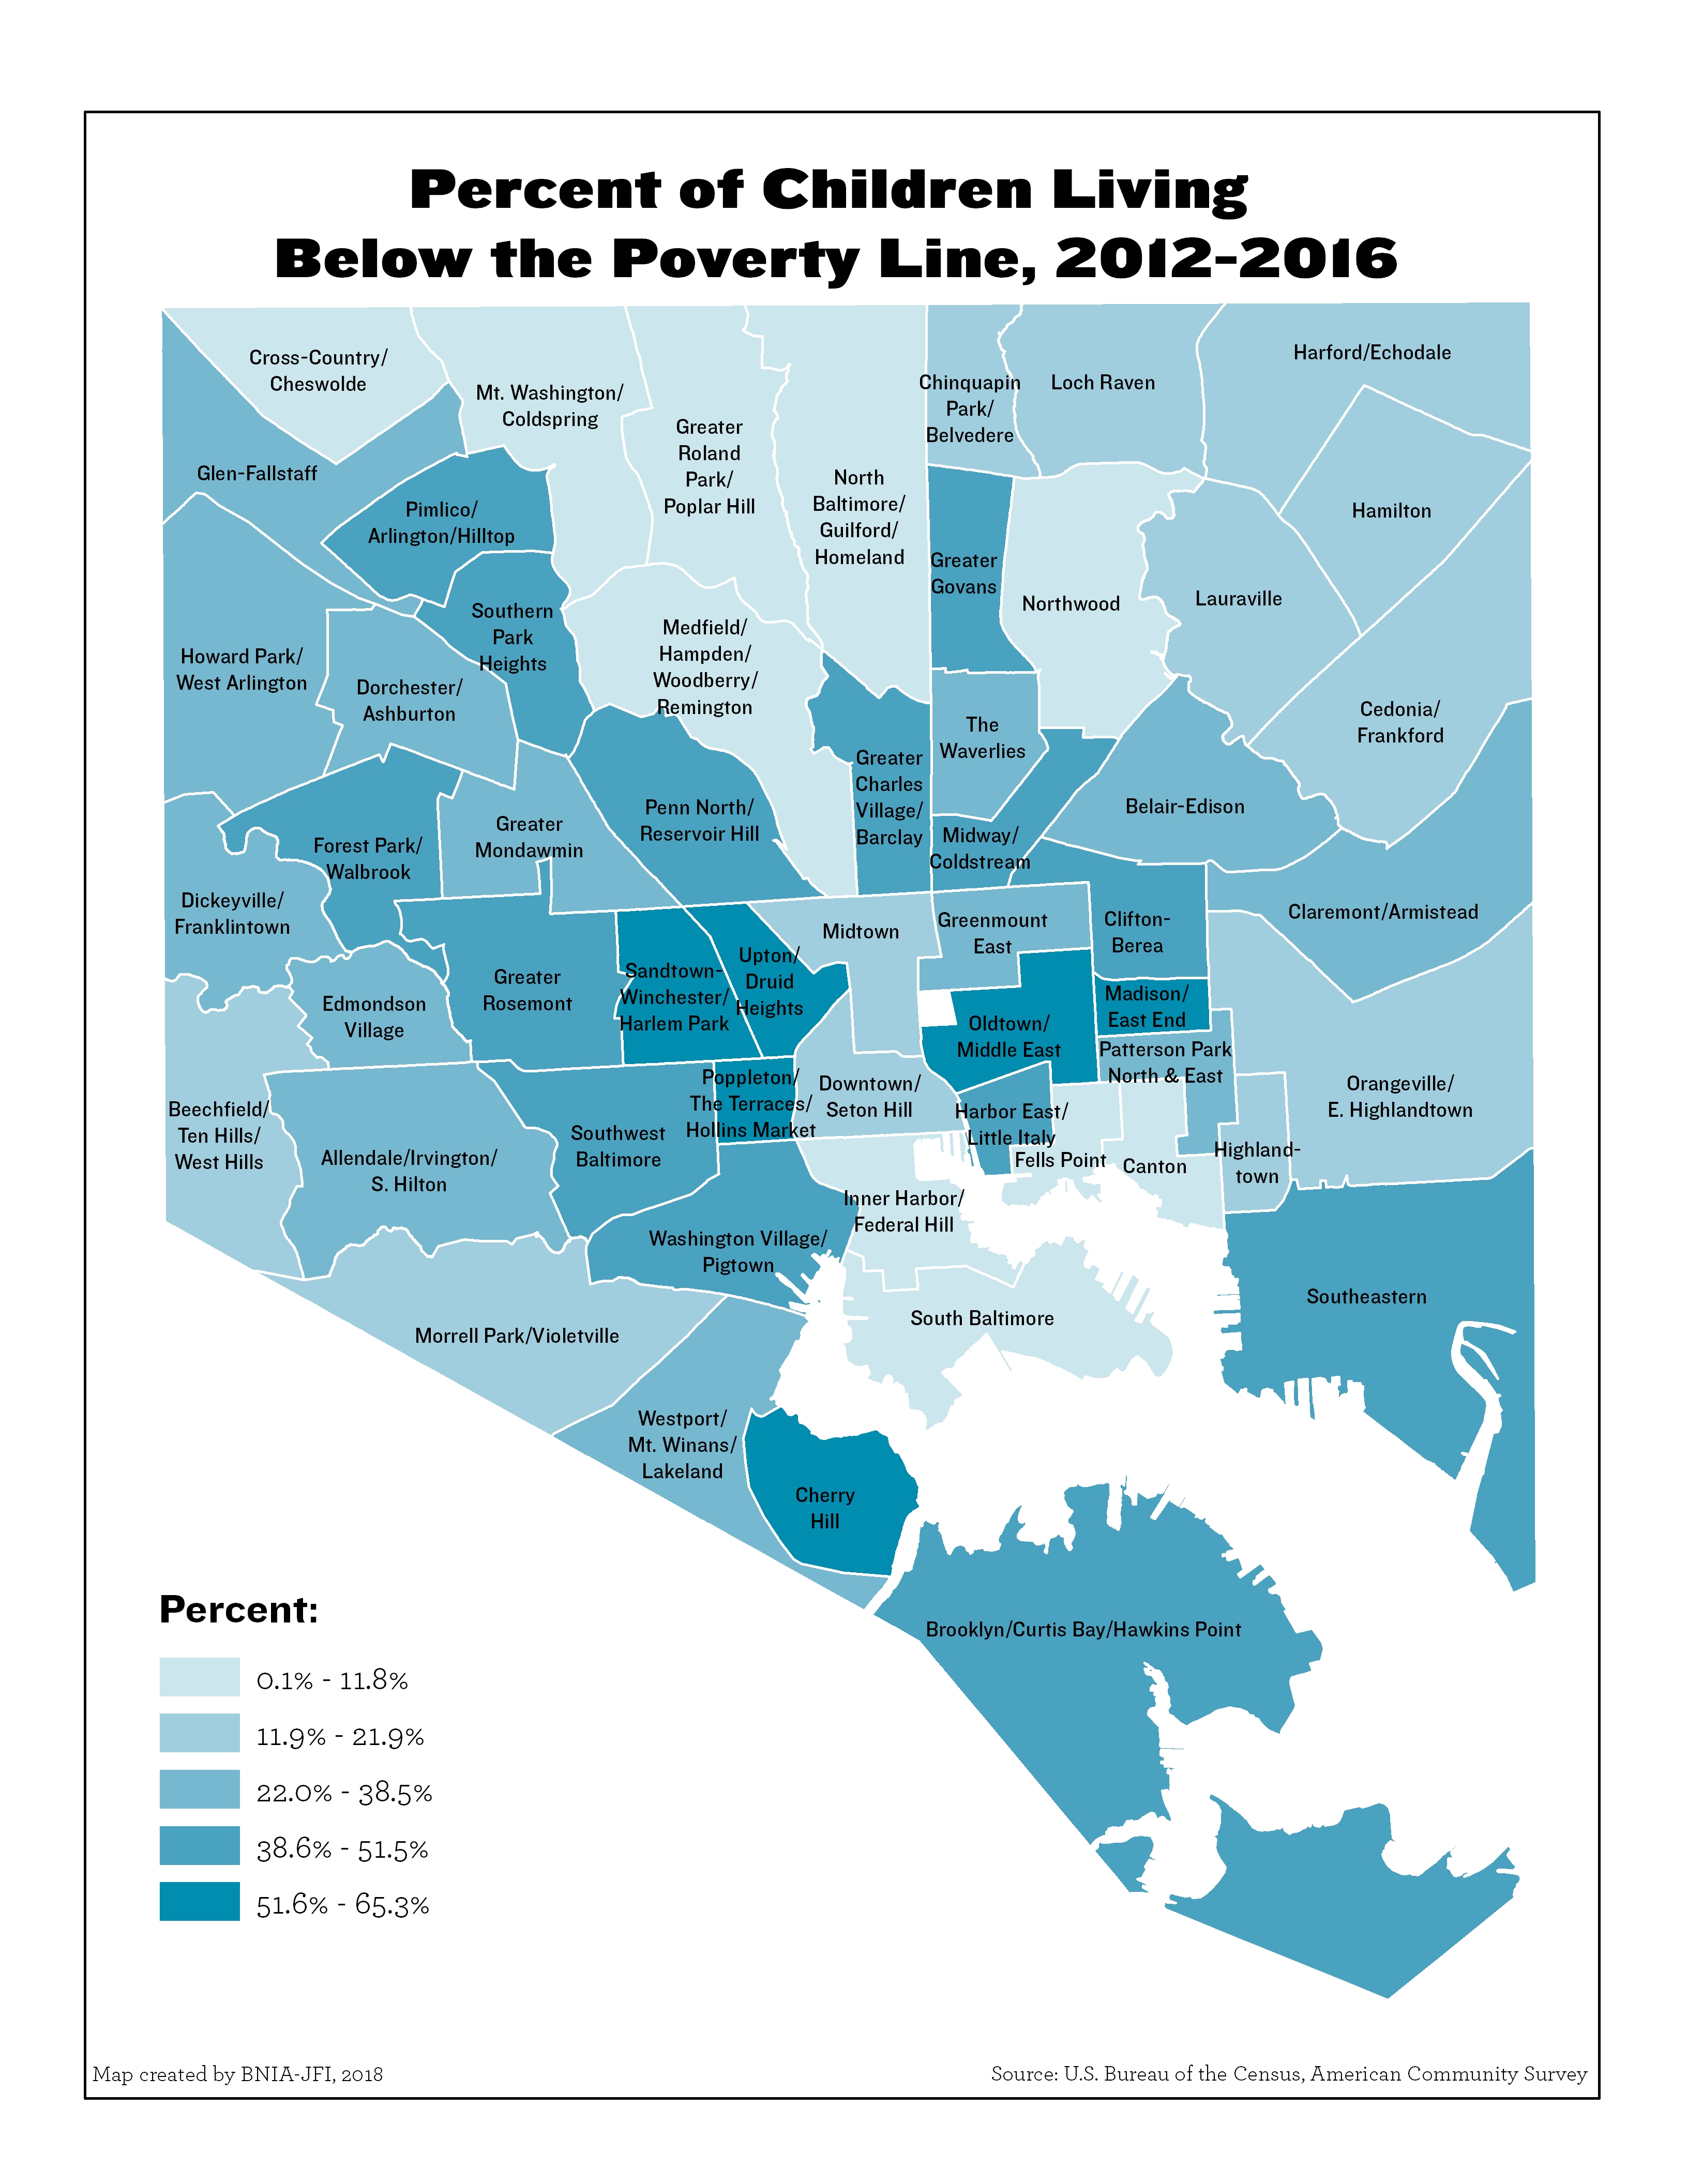
Percent of Children Living Below the Poverty Line (2020)
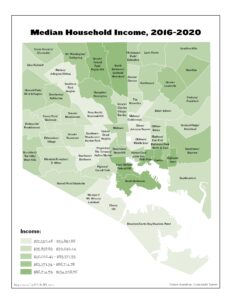
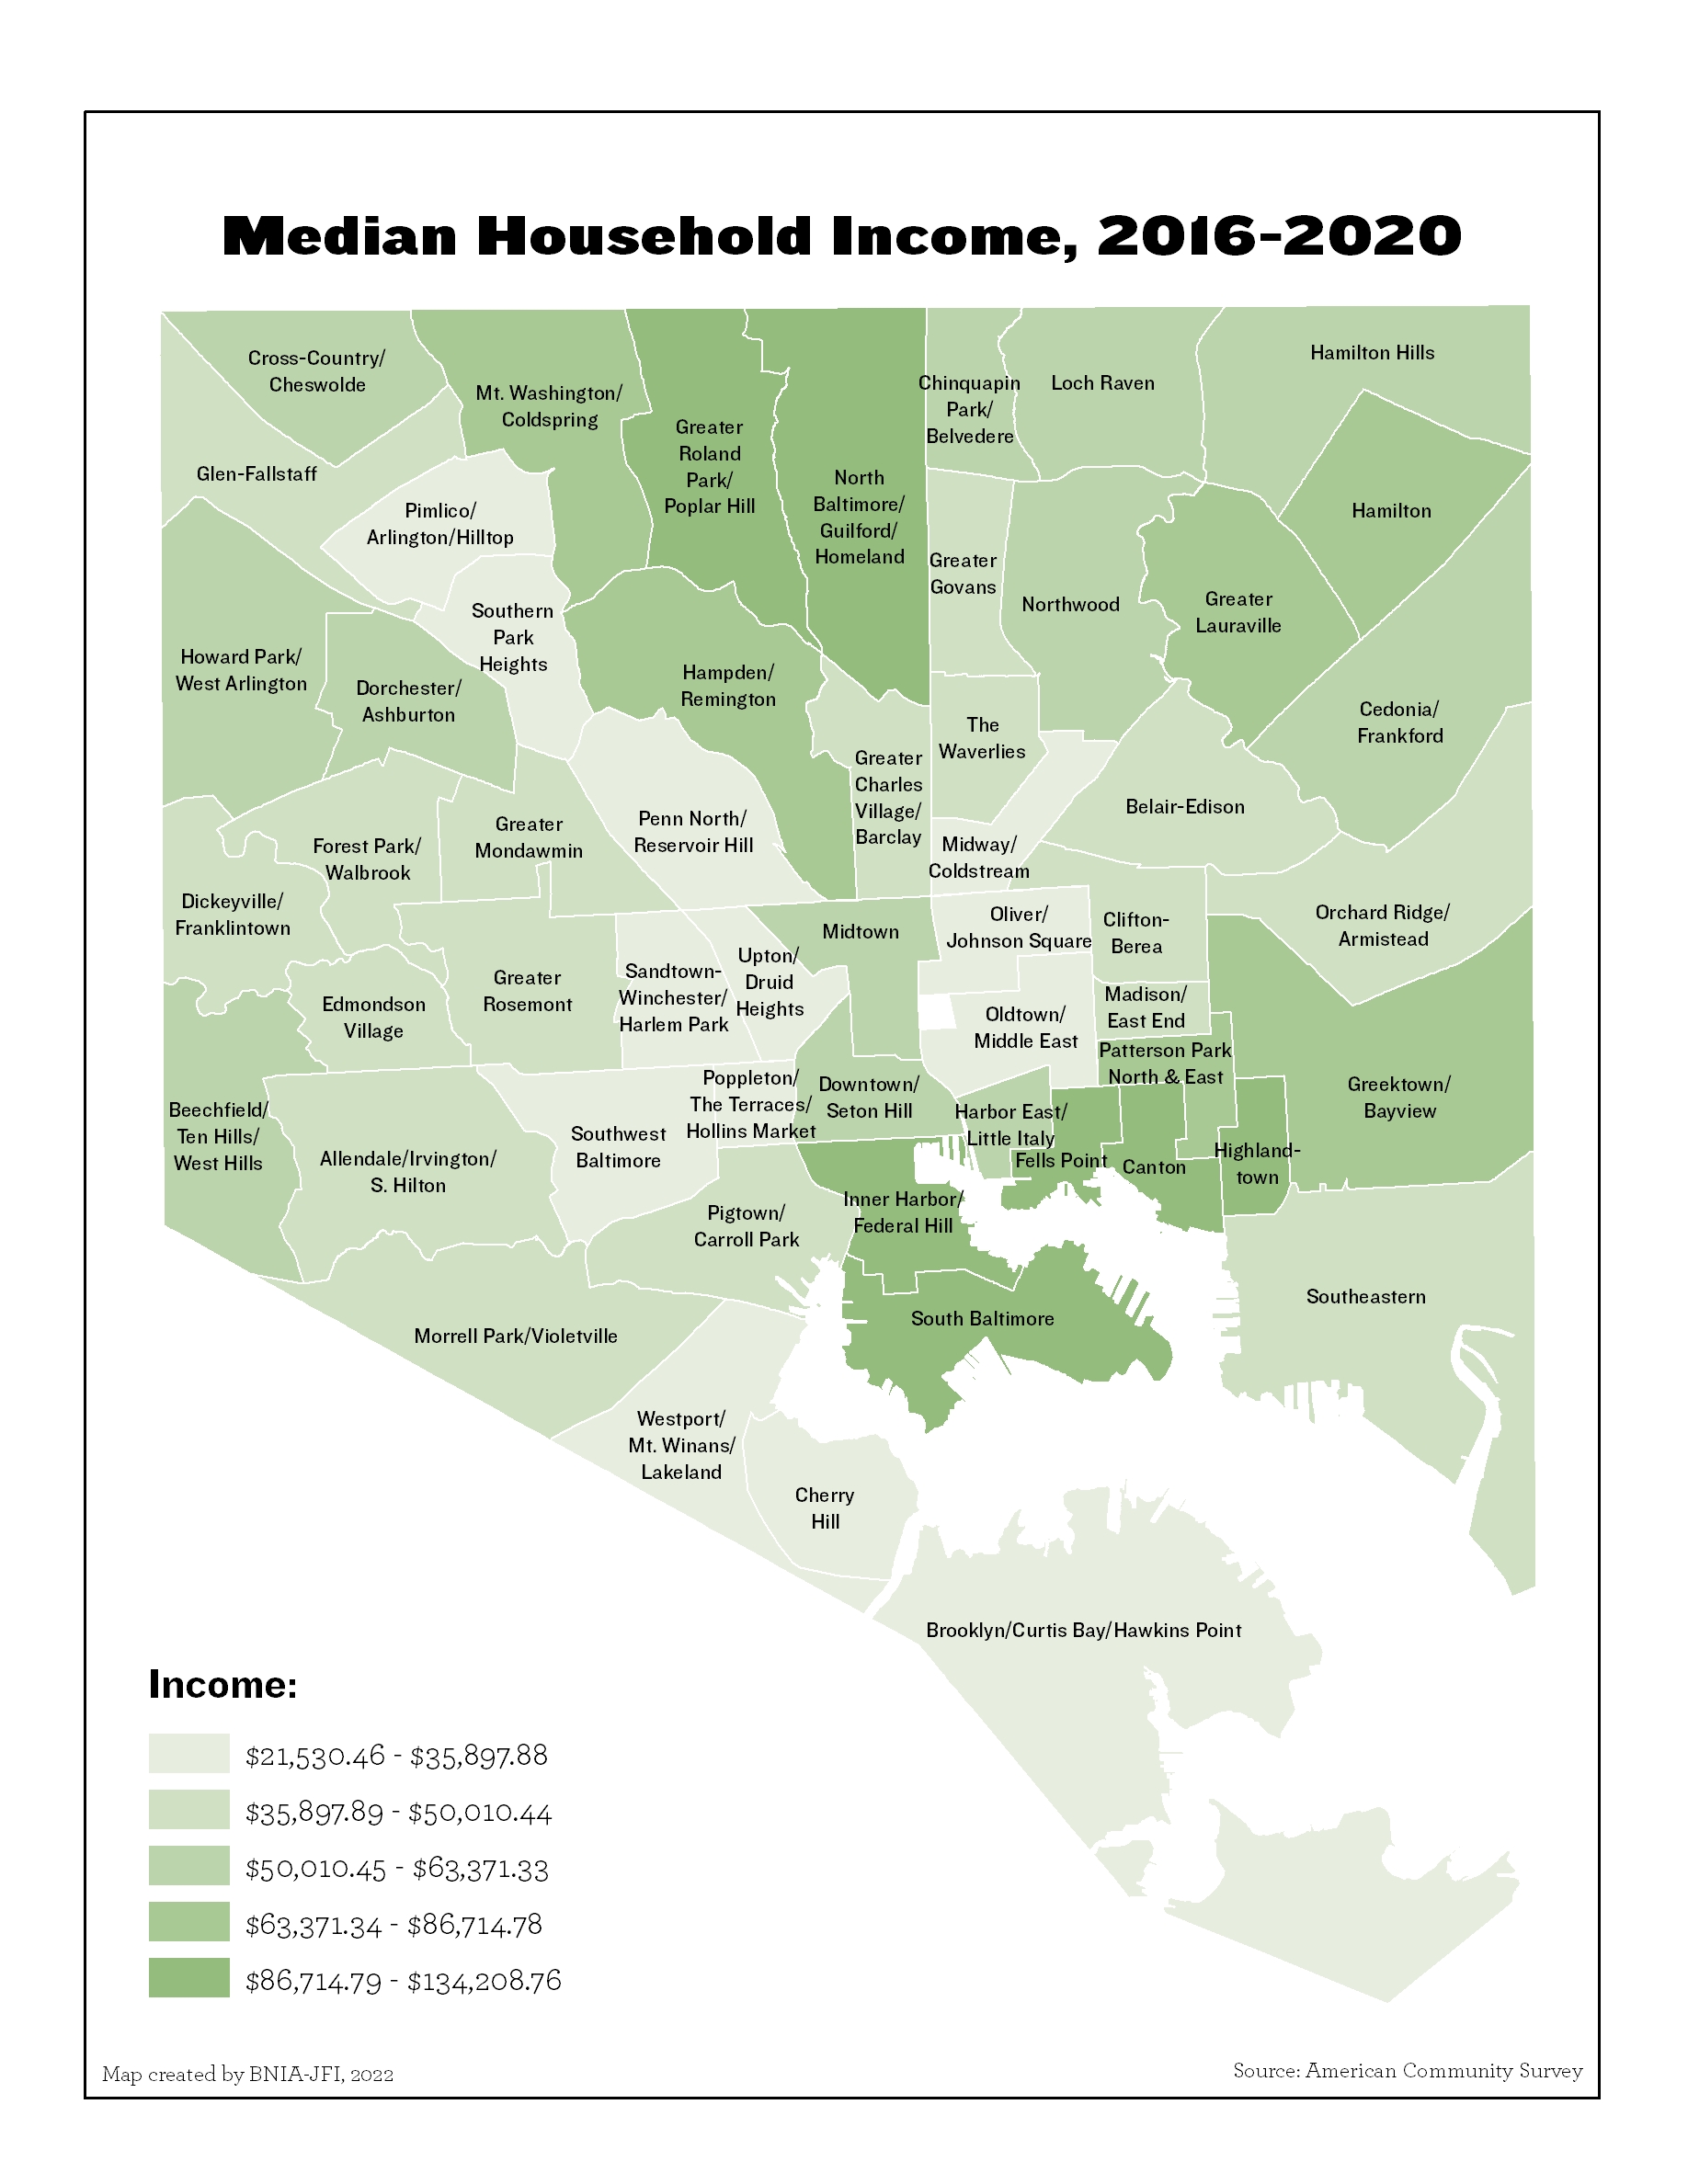
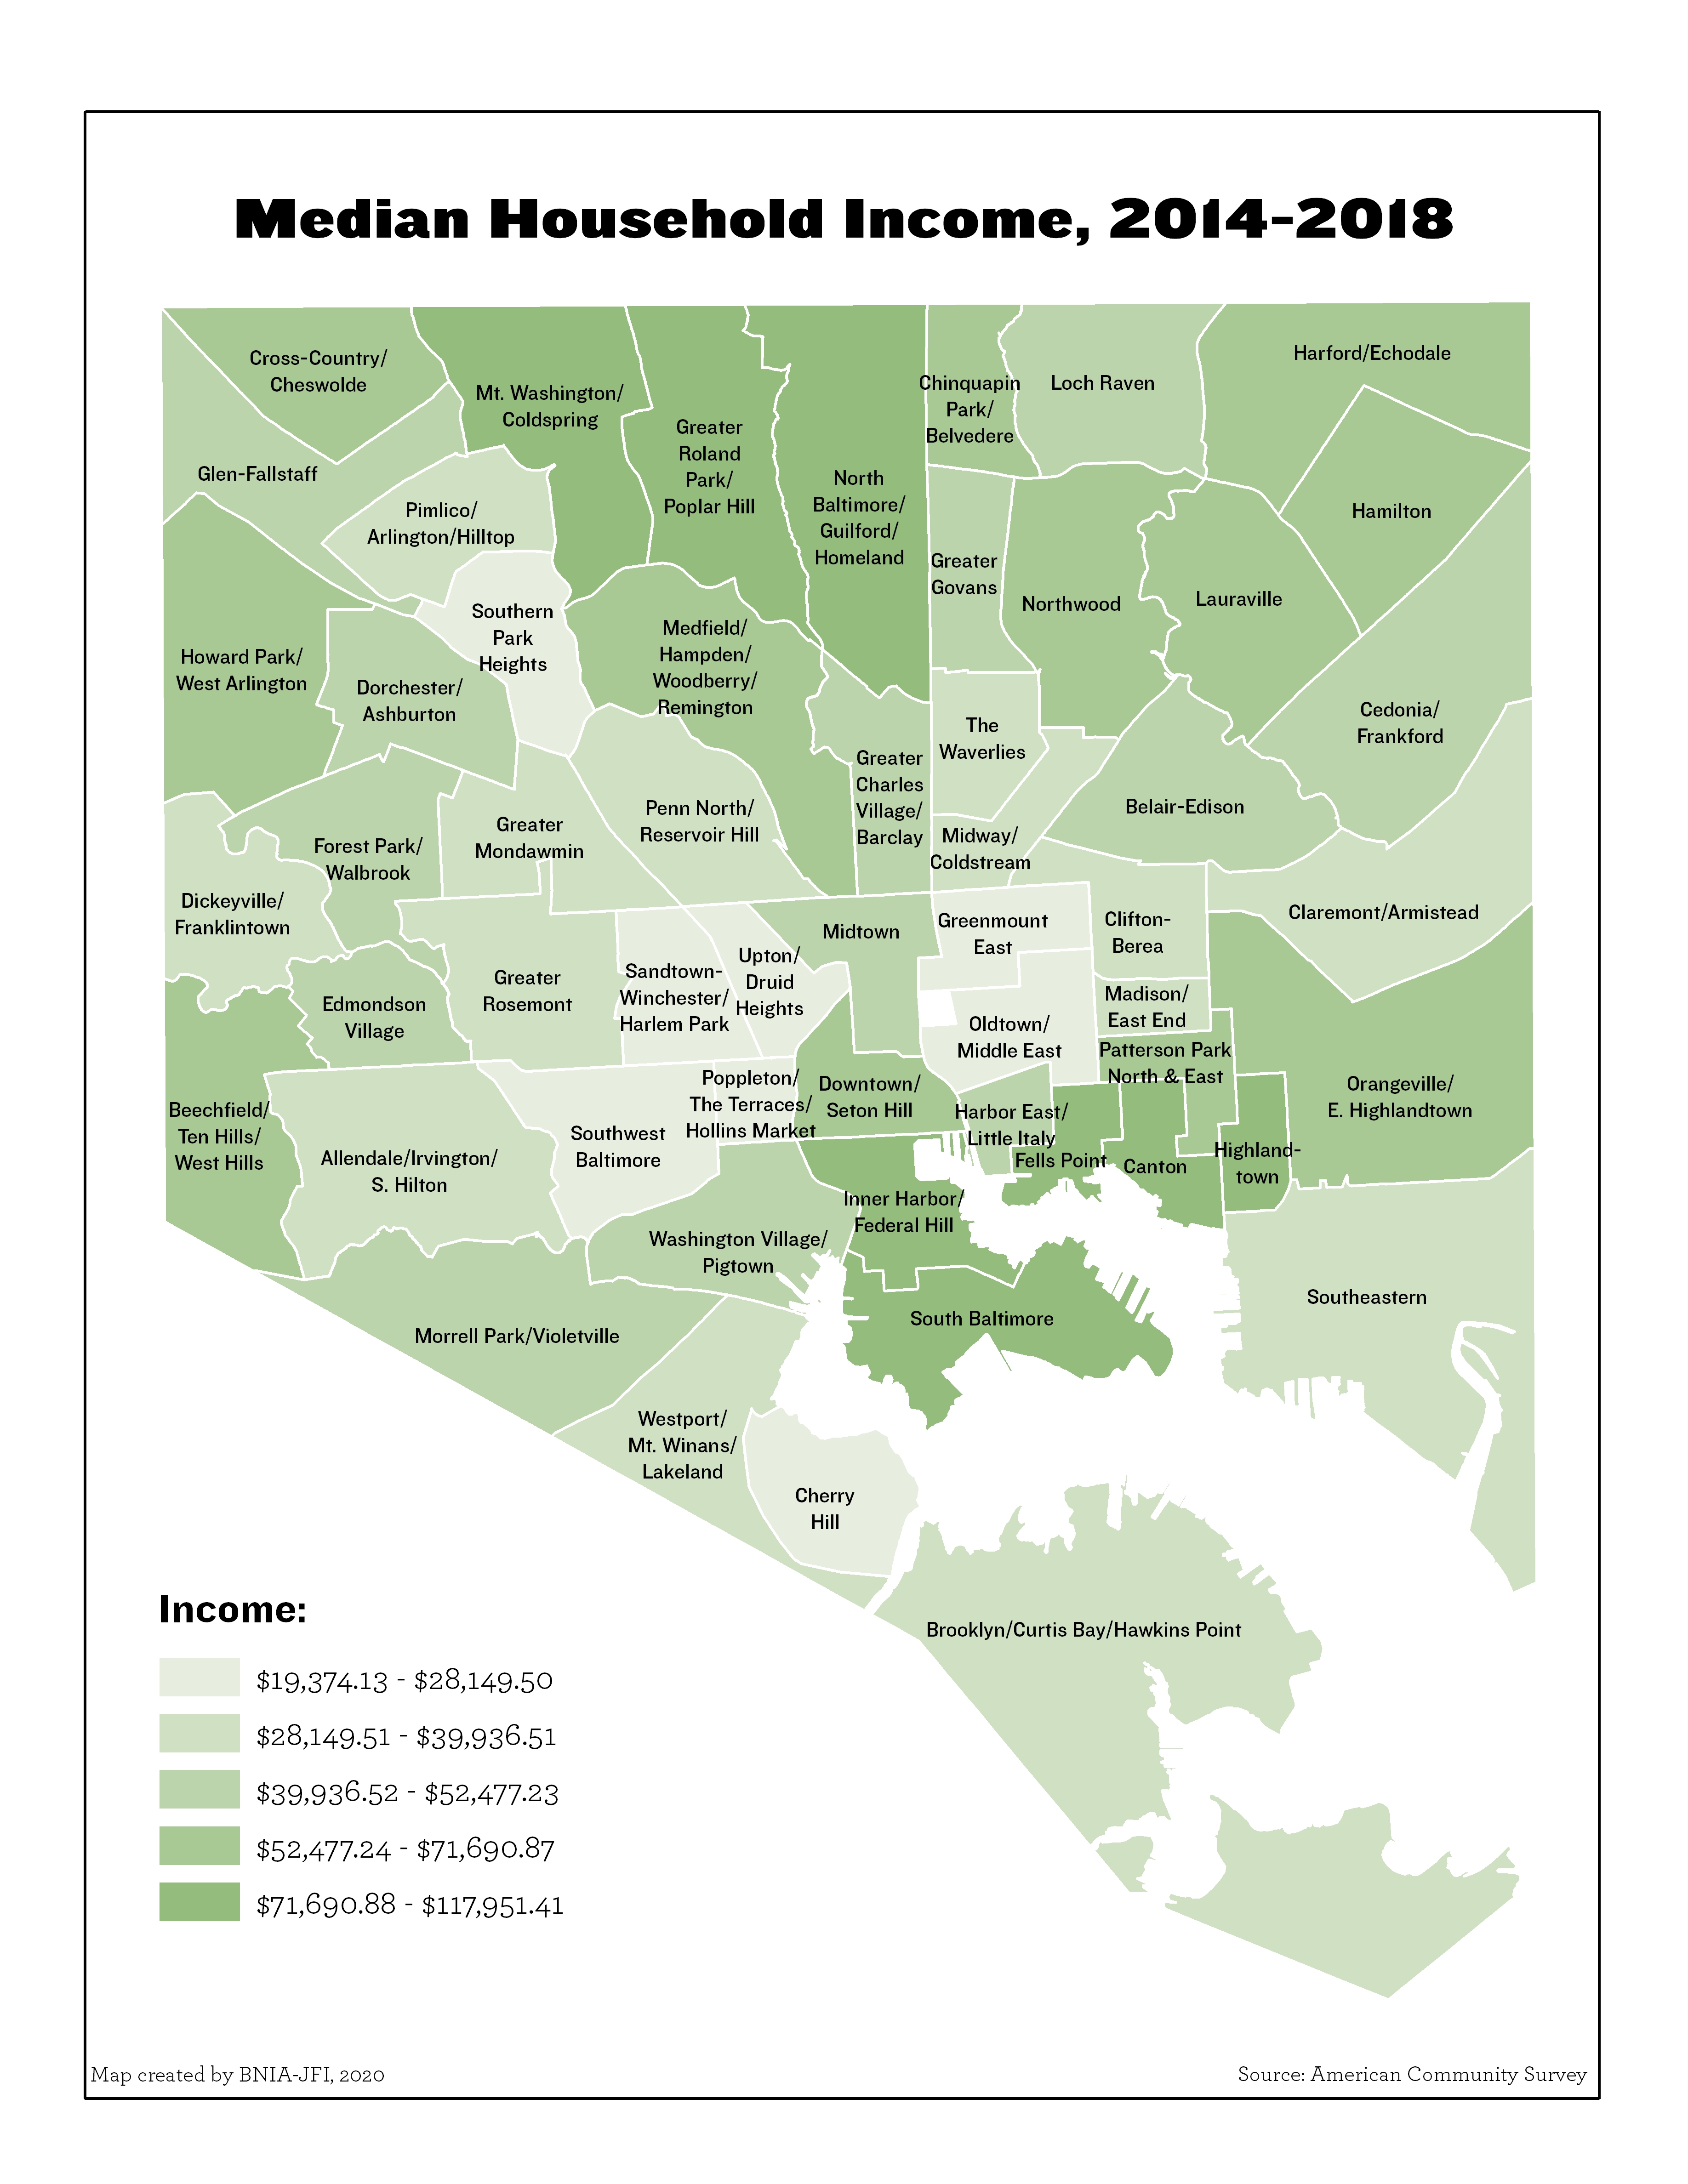
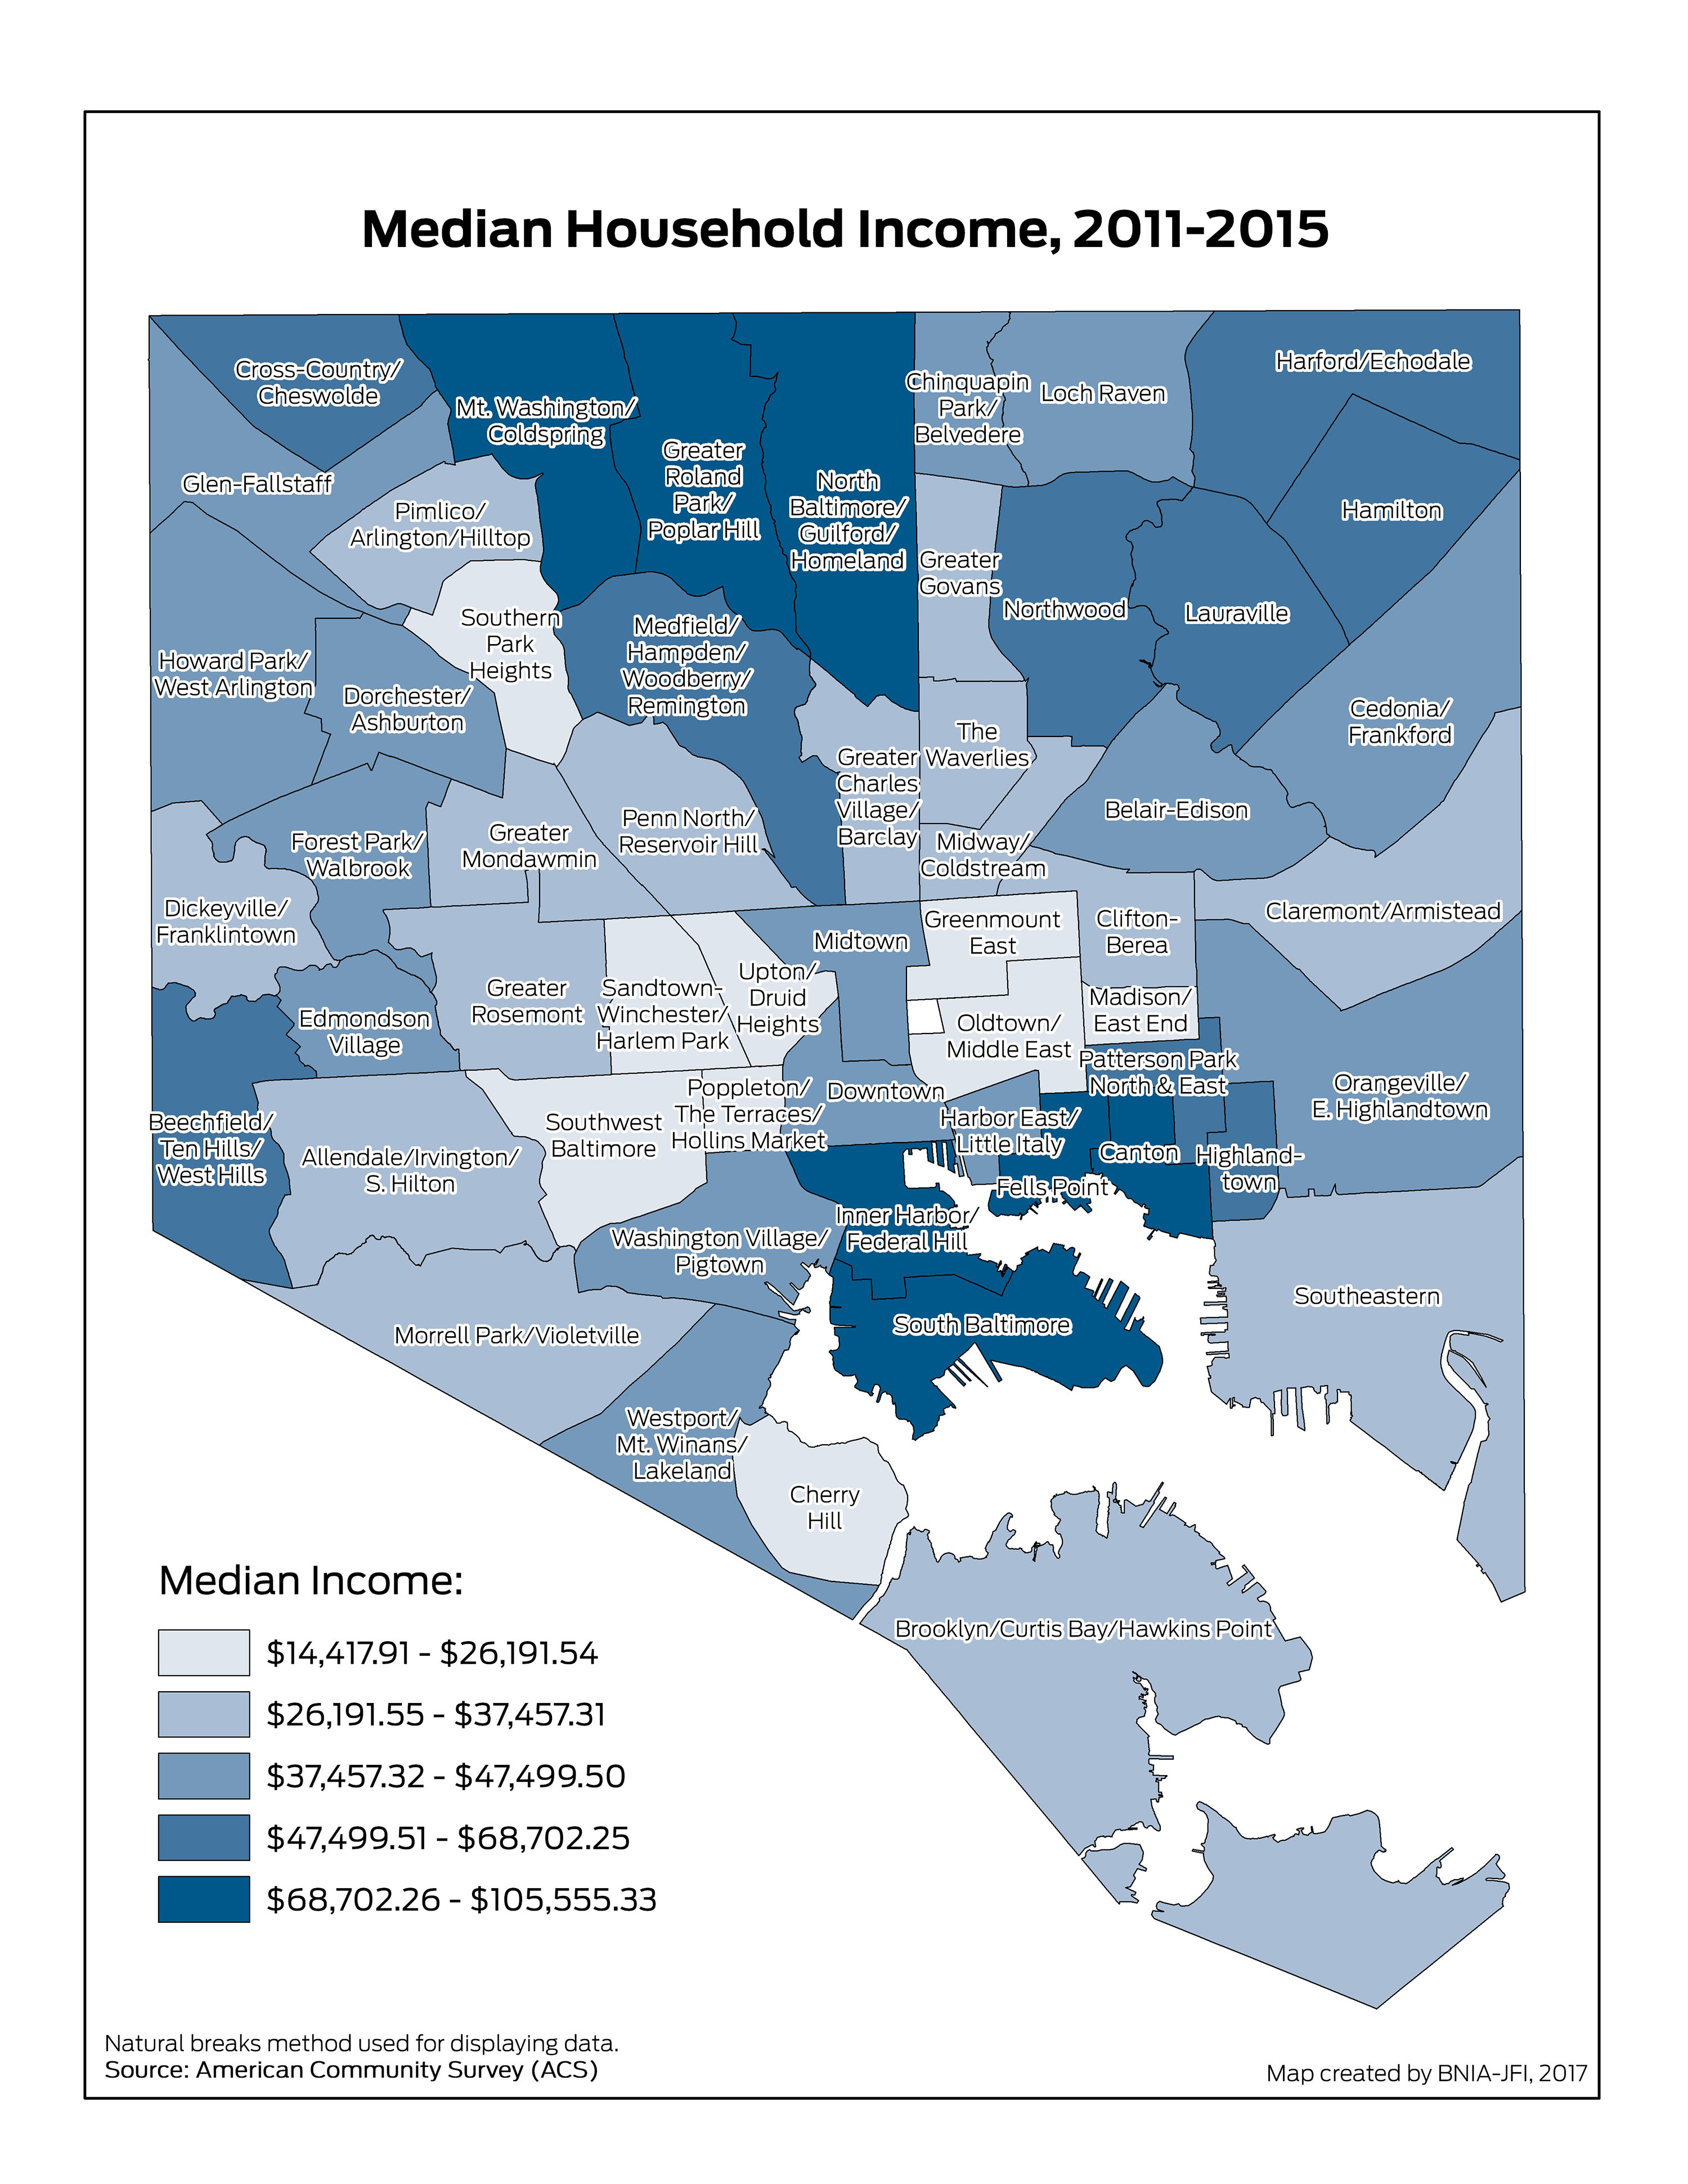
Median Household Income (2020)
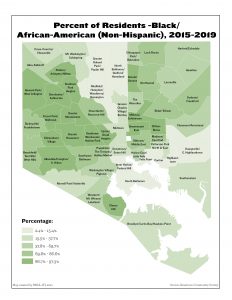
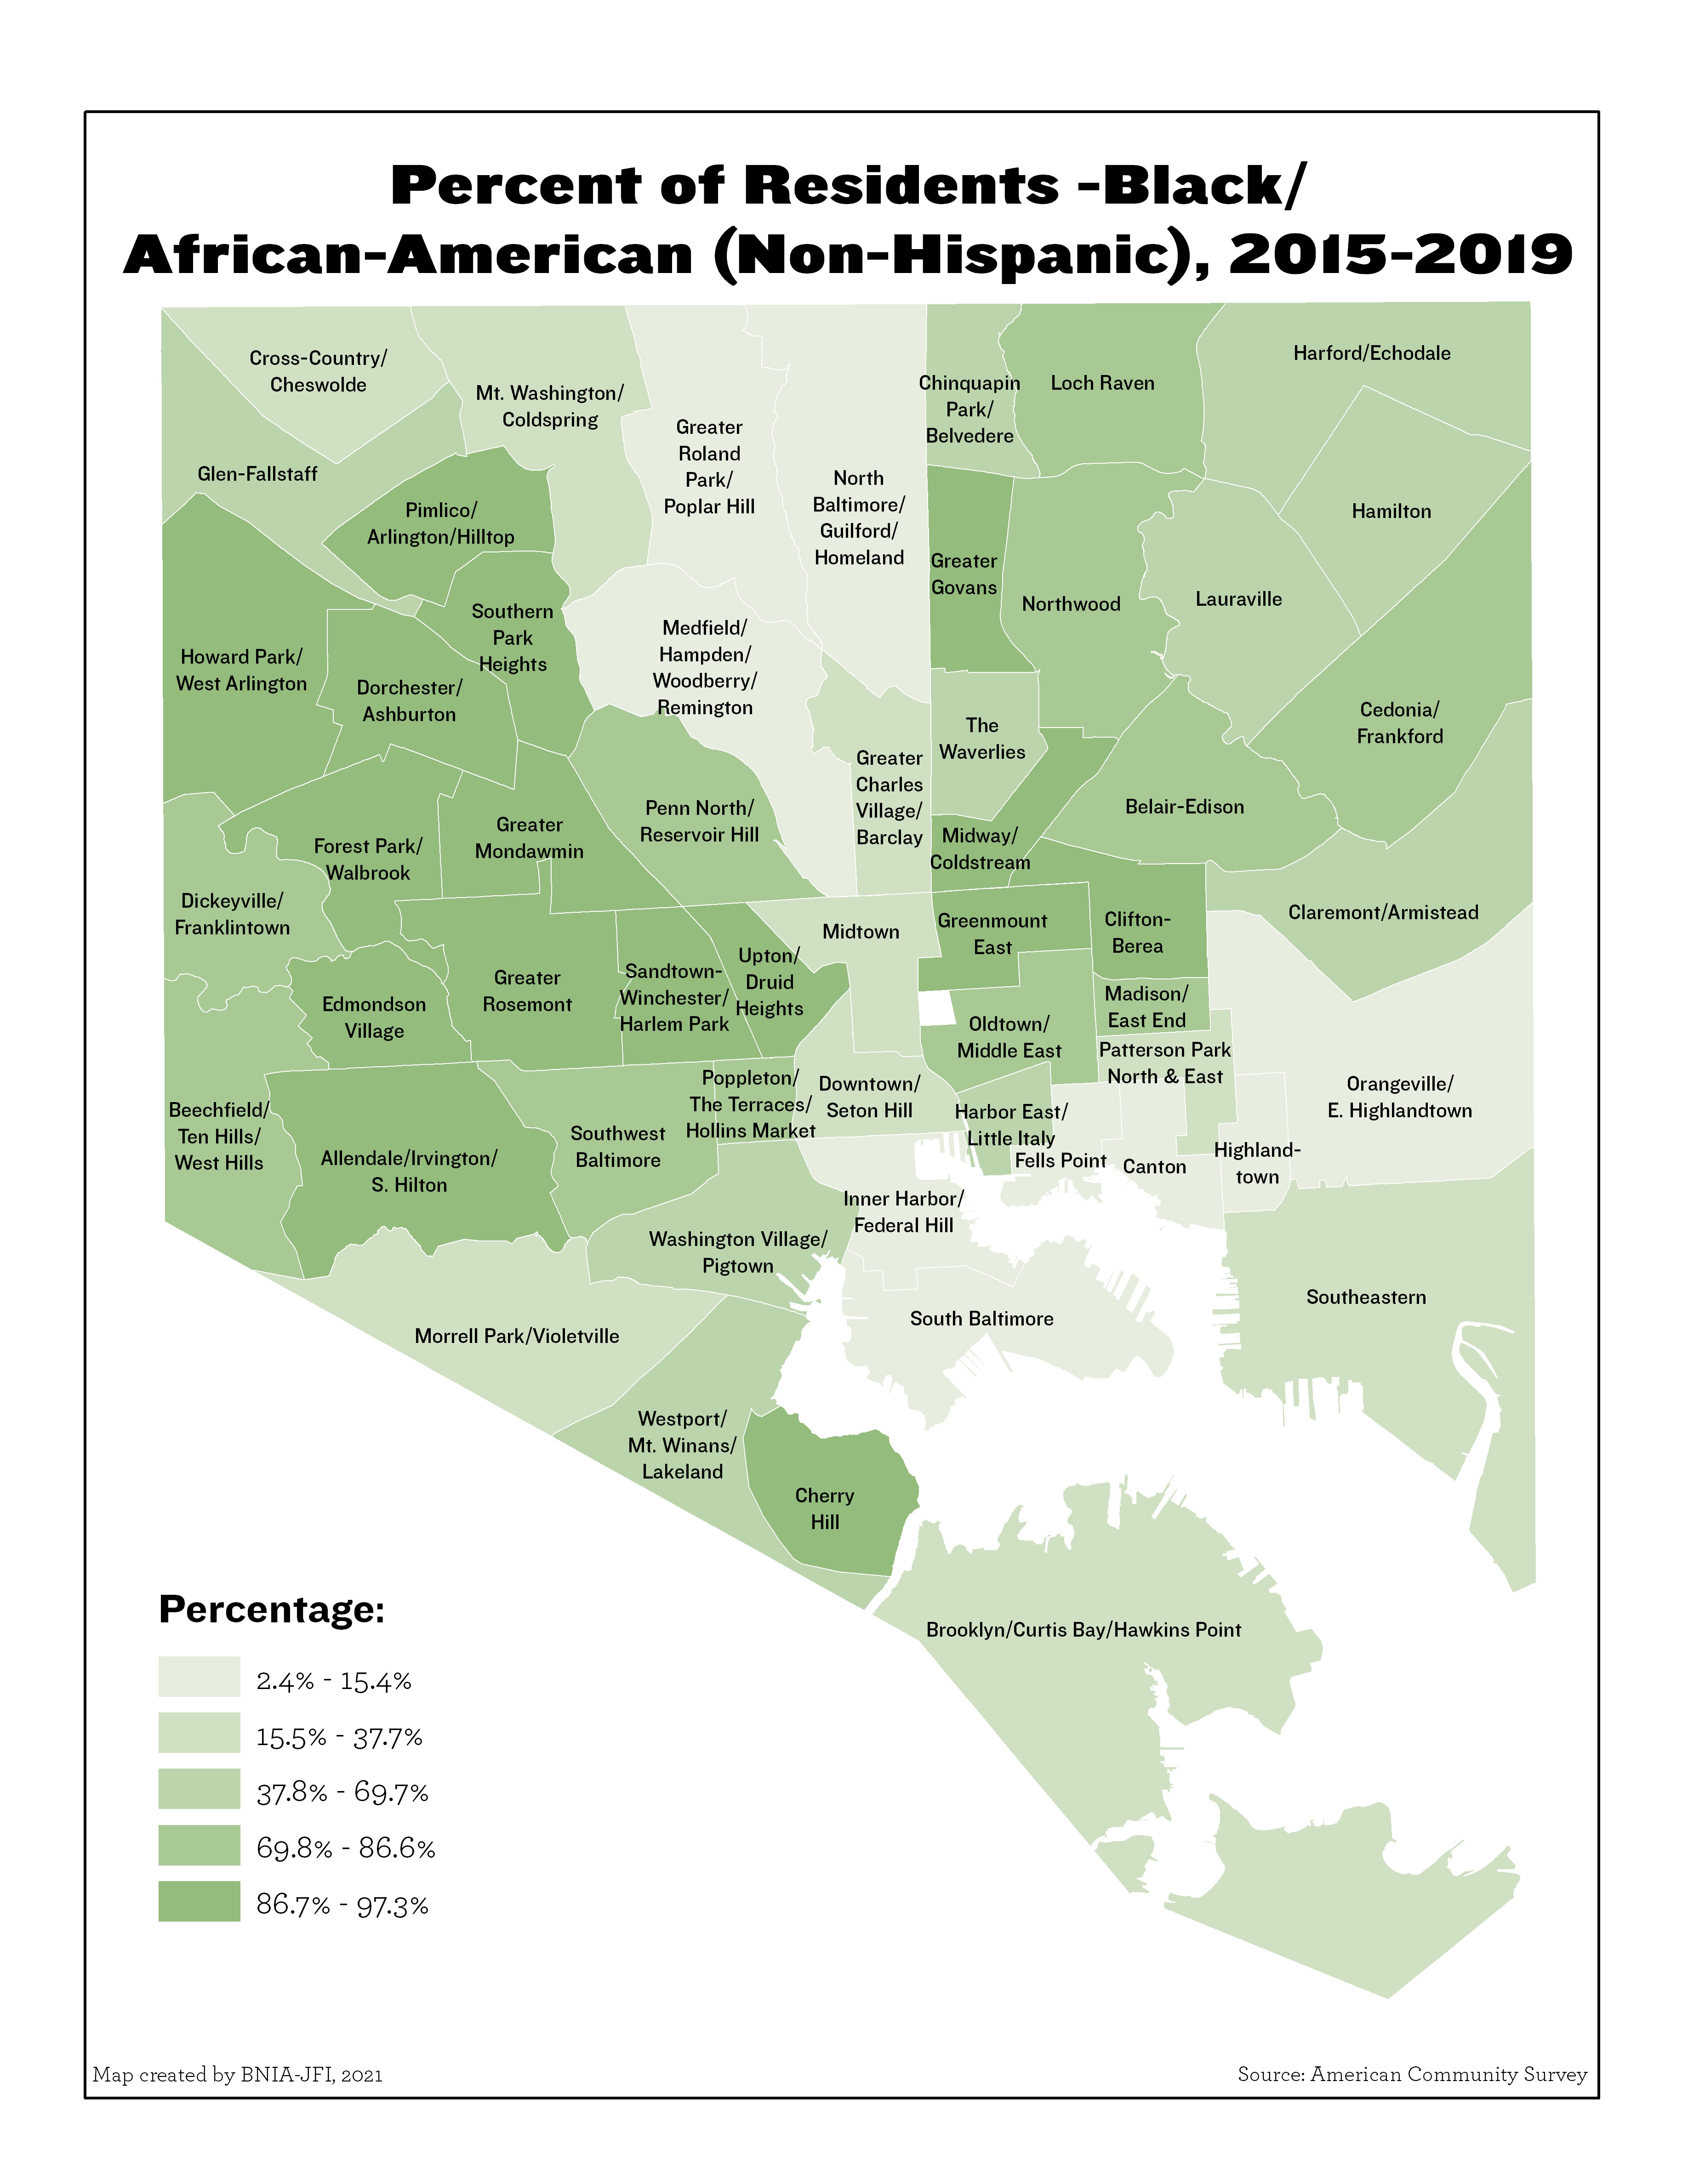
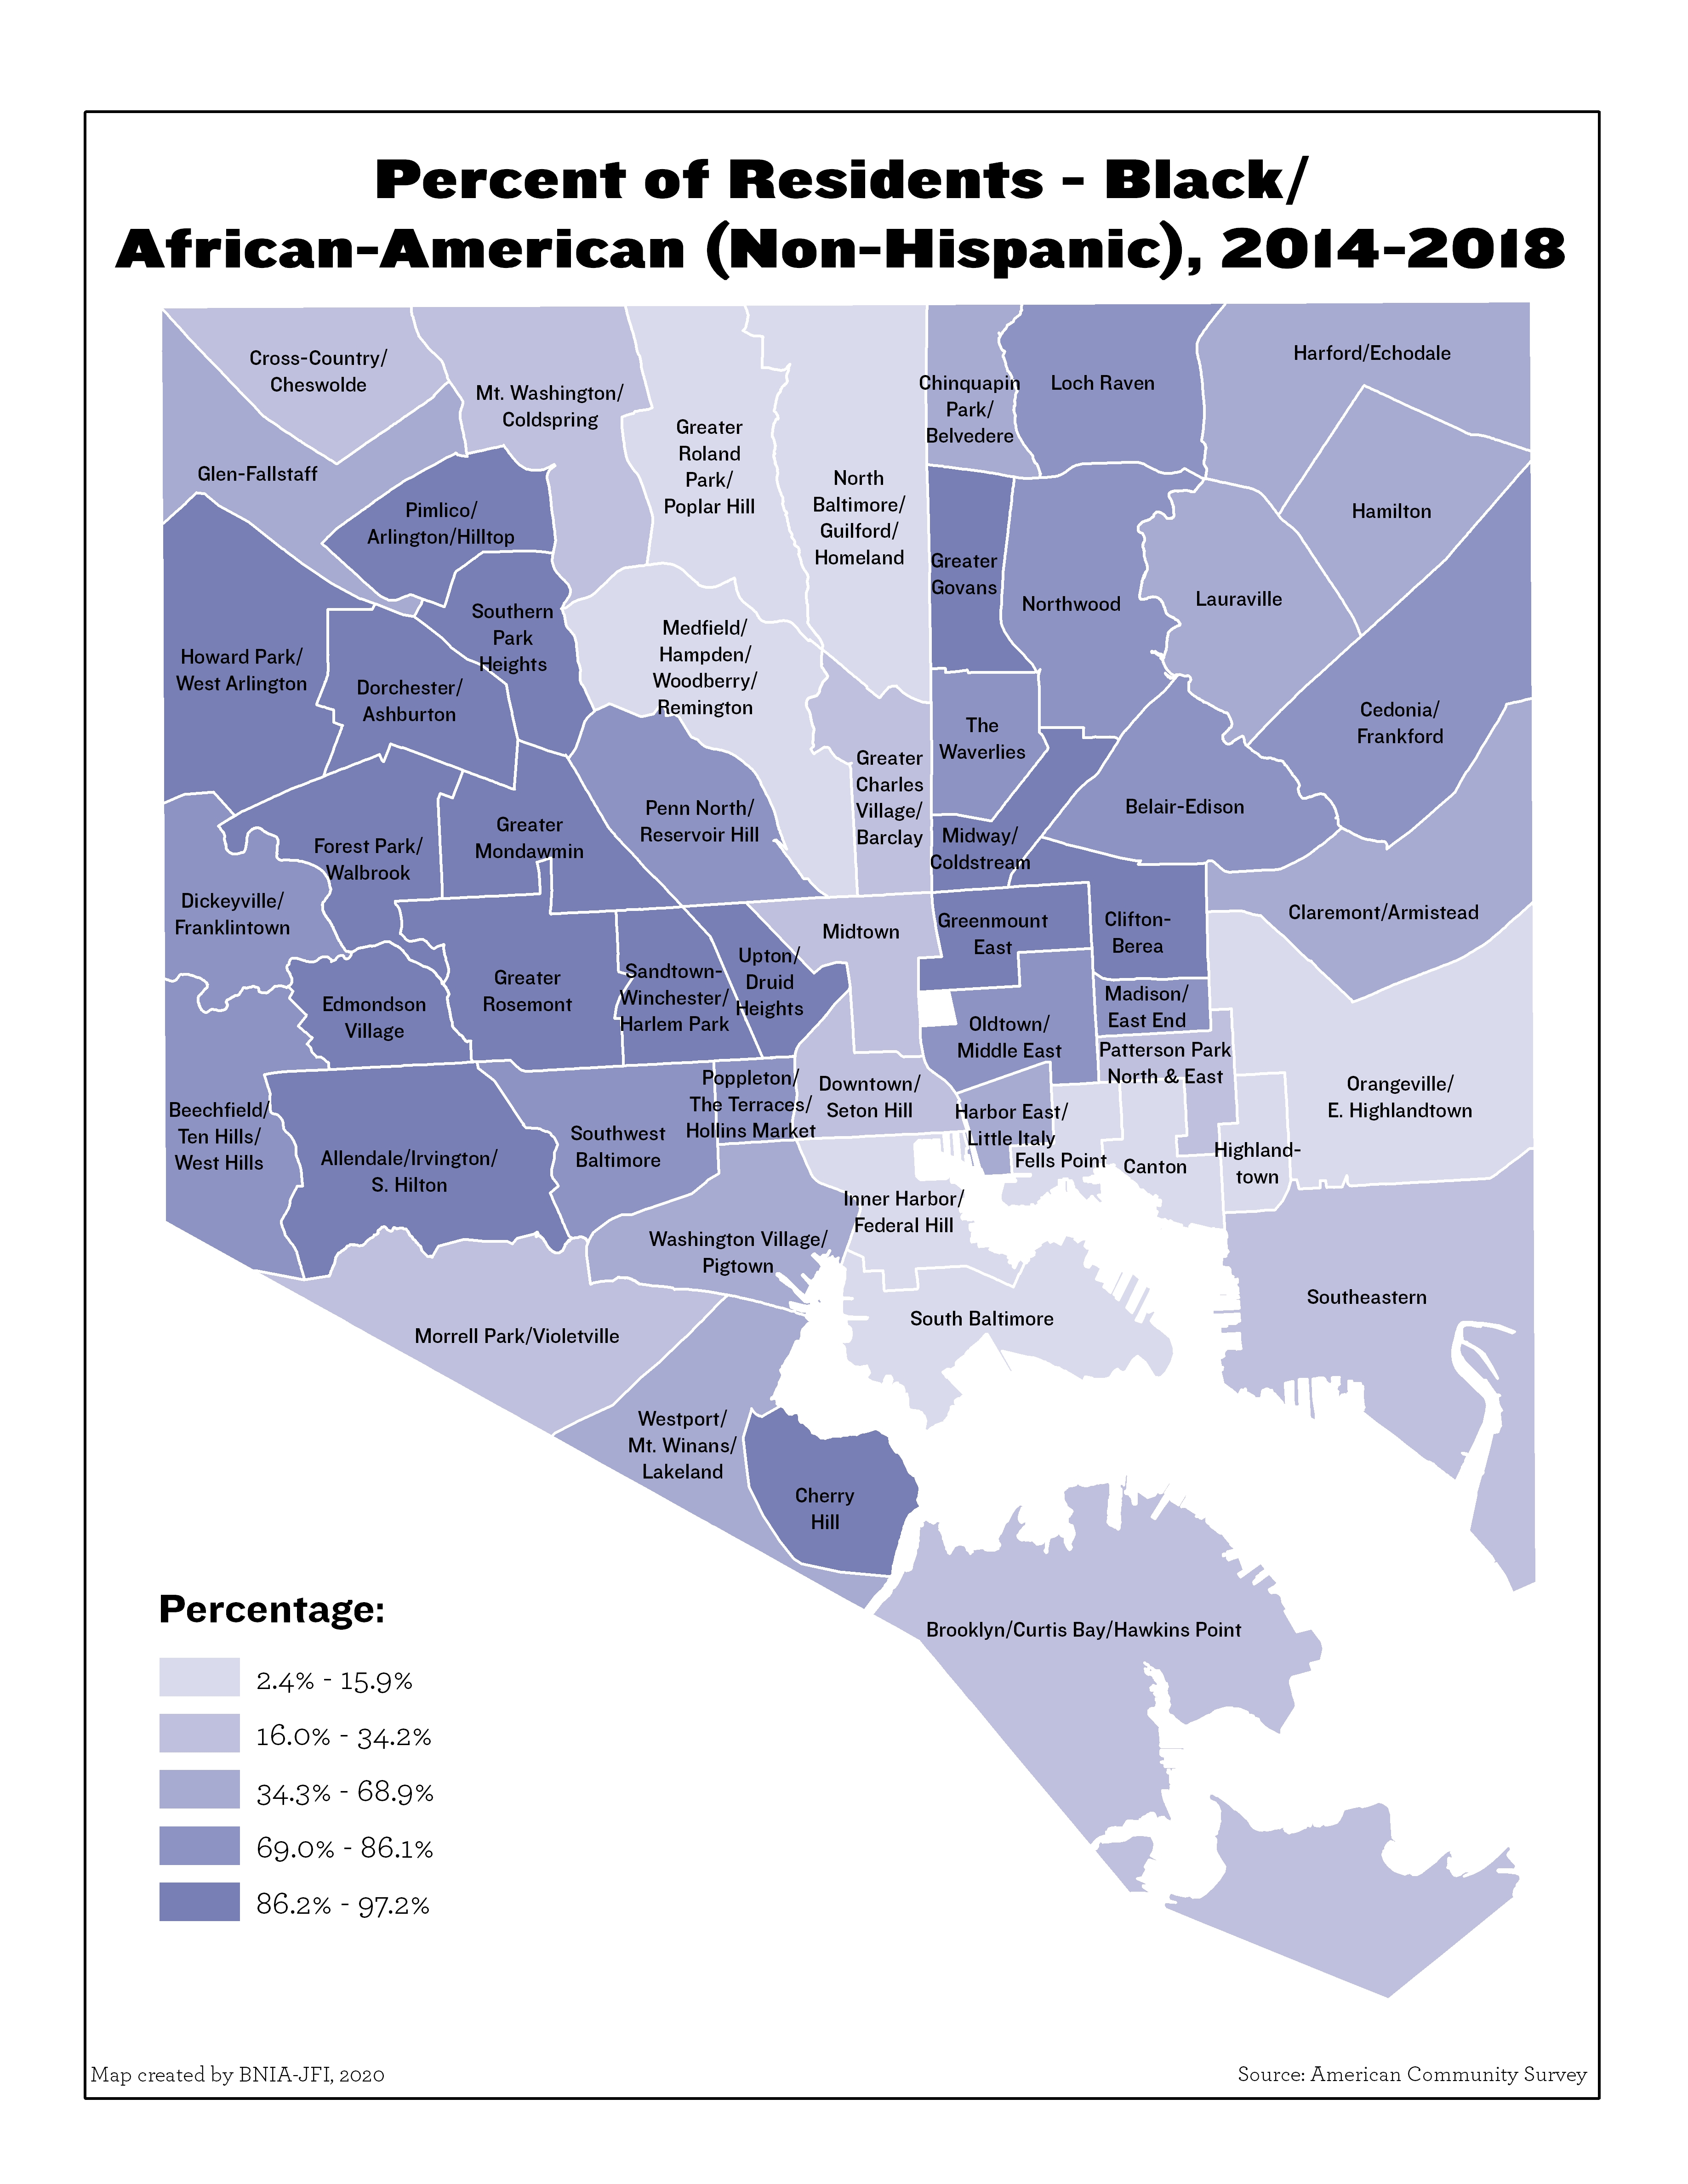
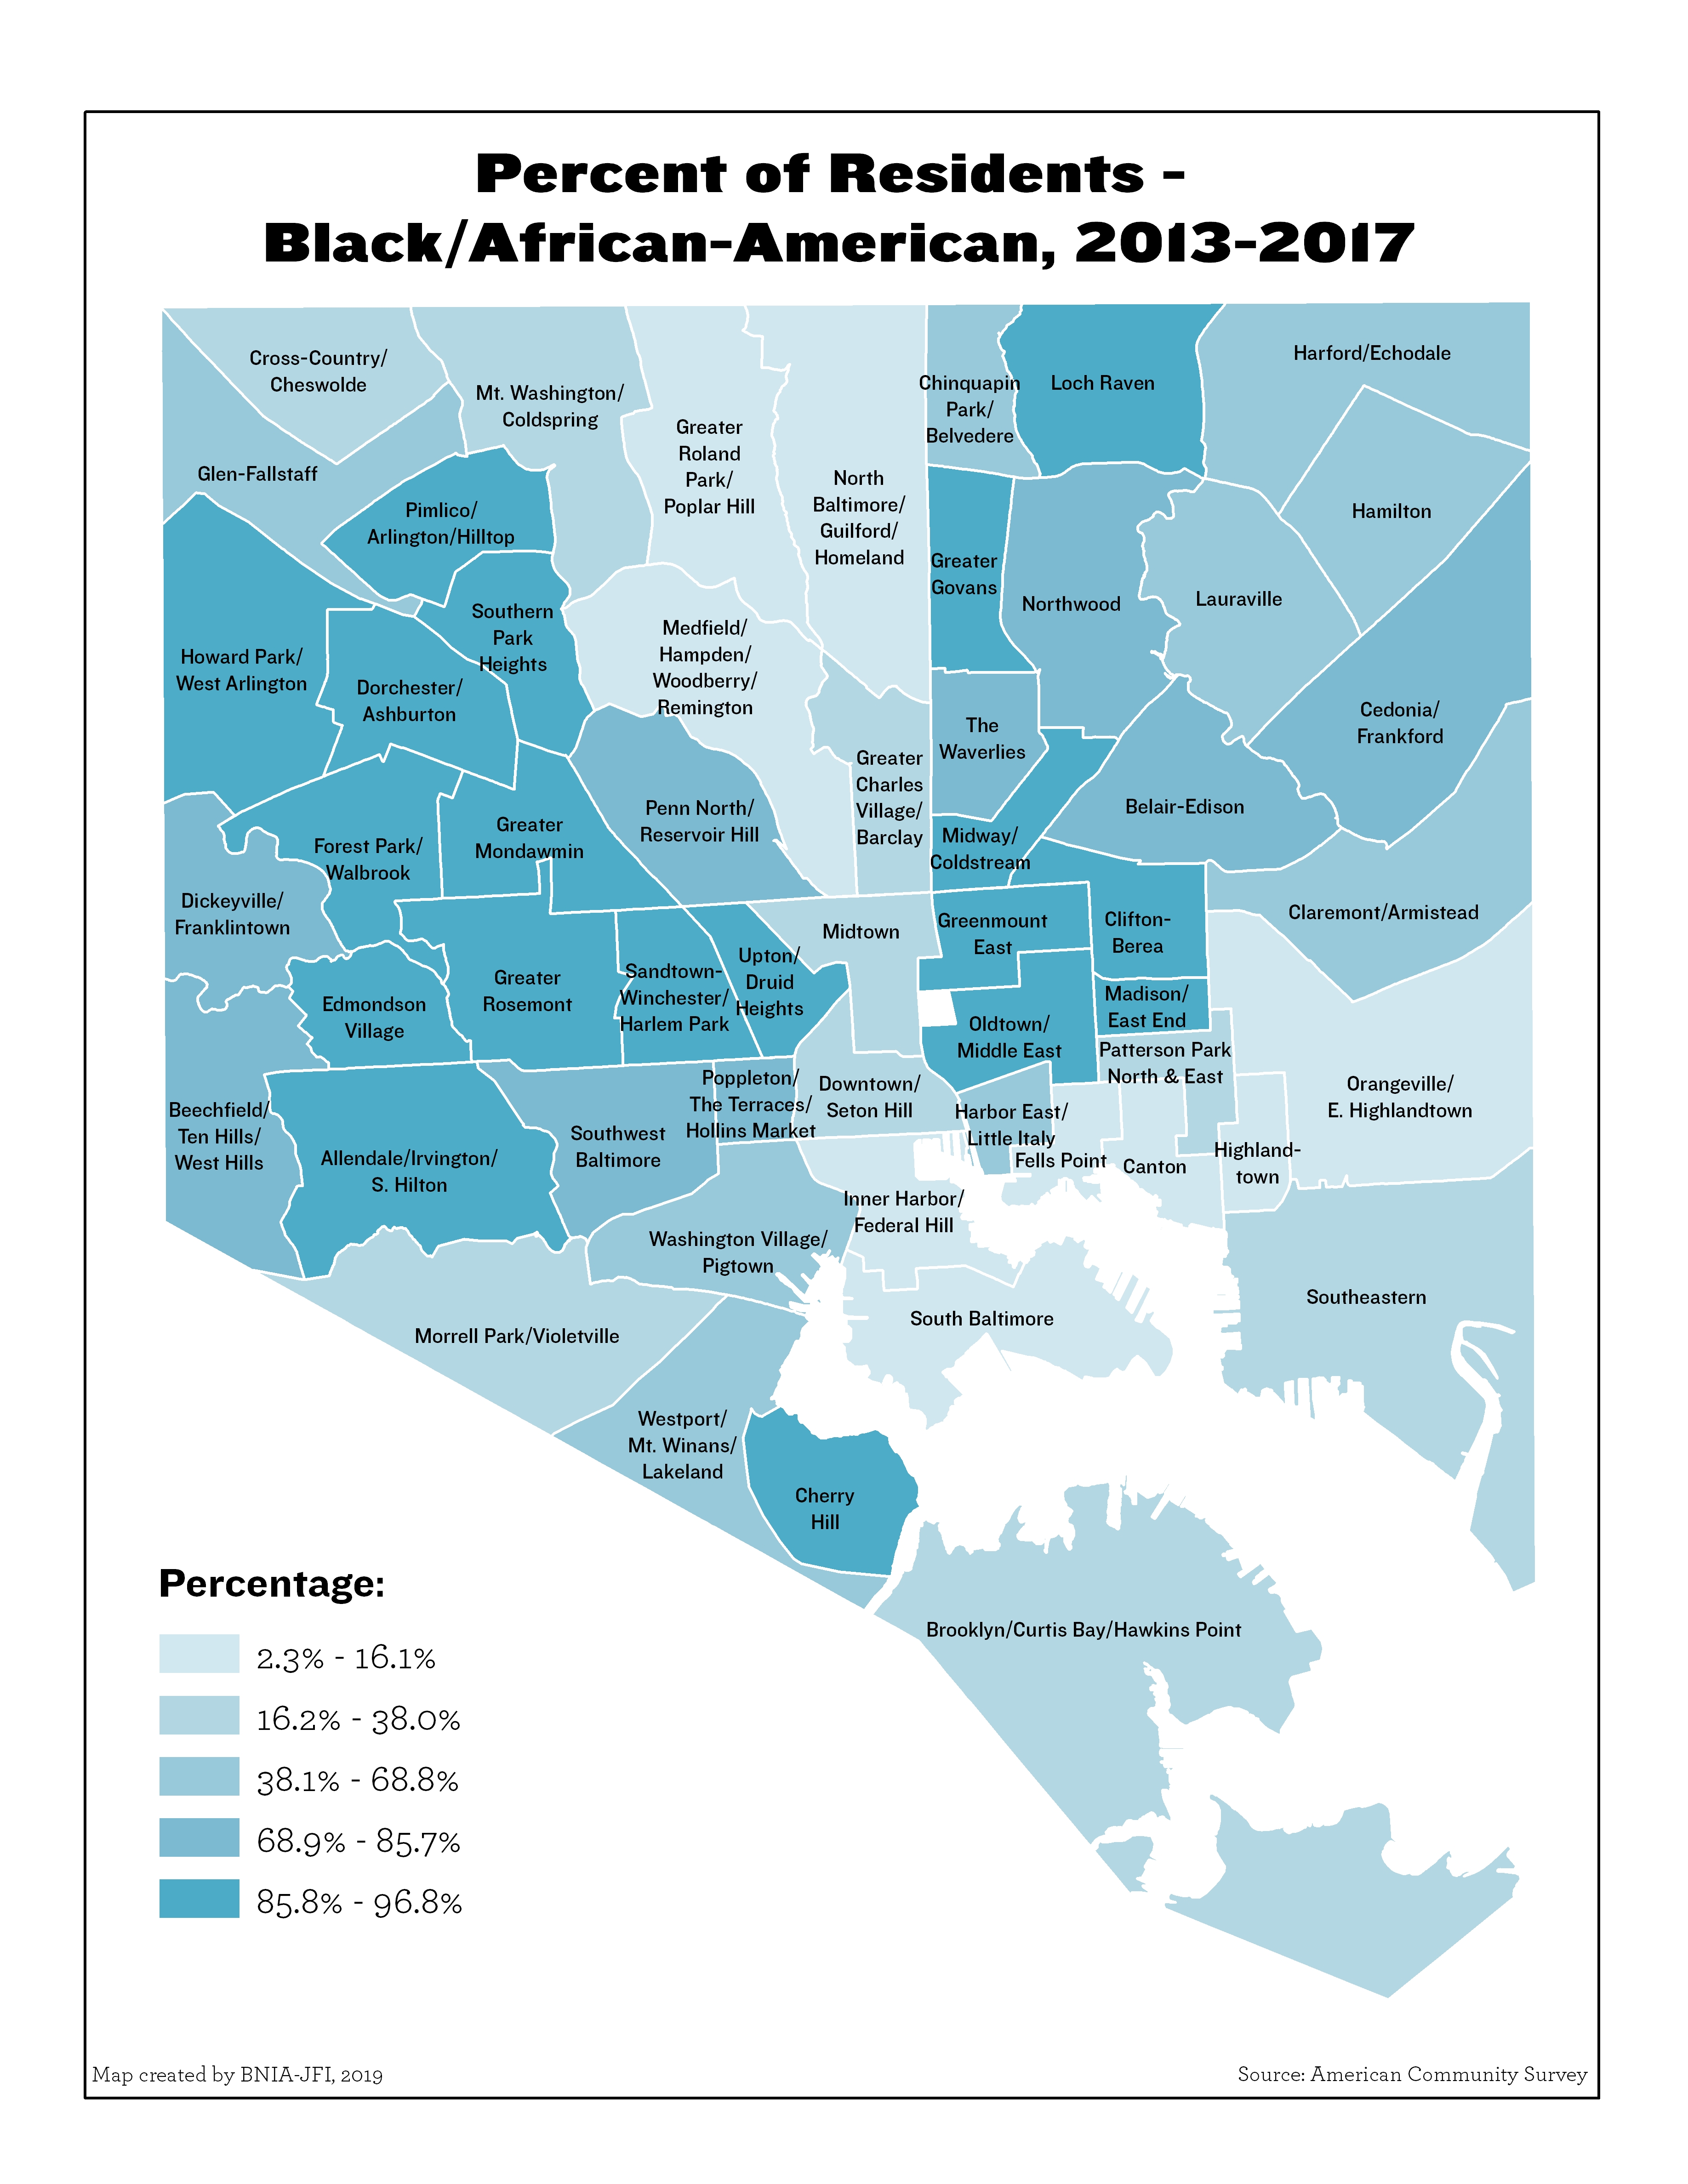
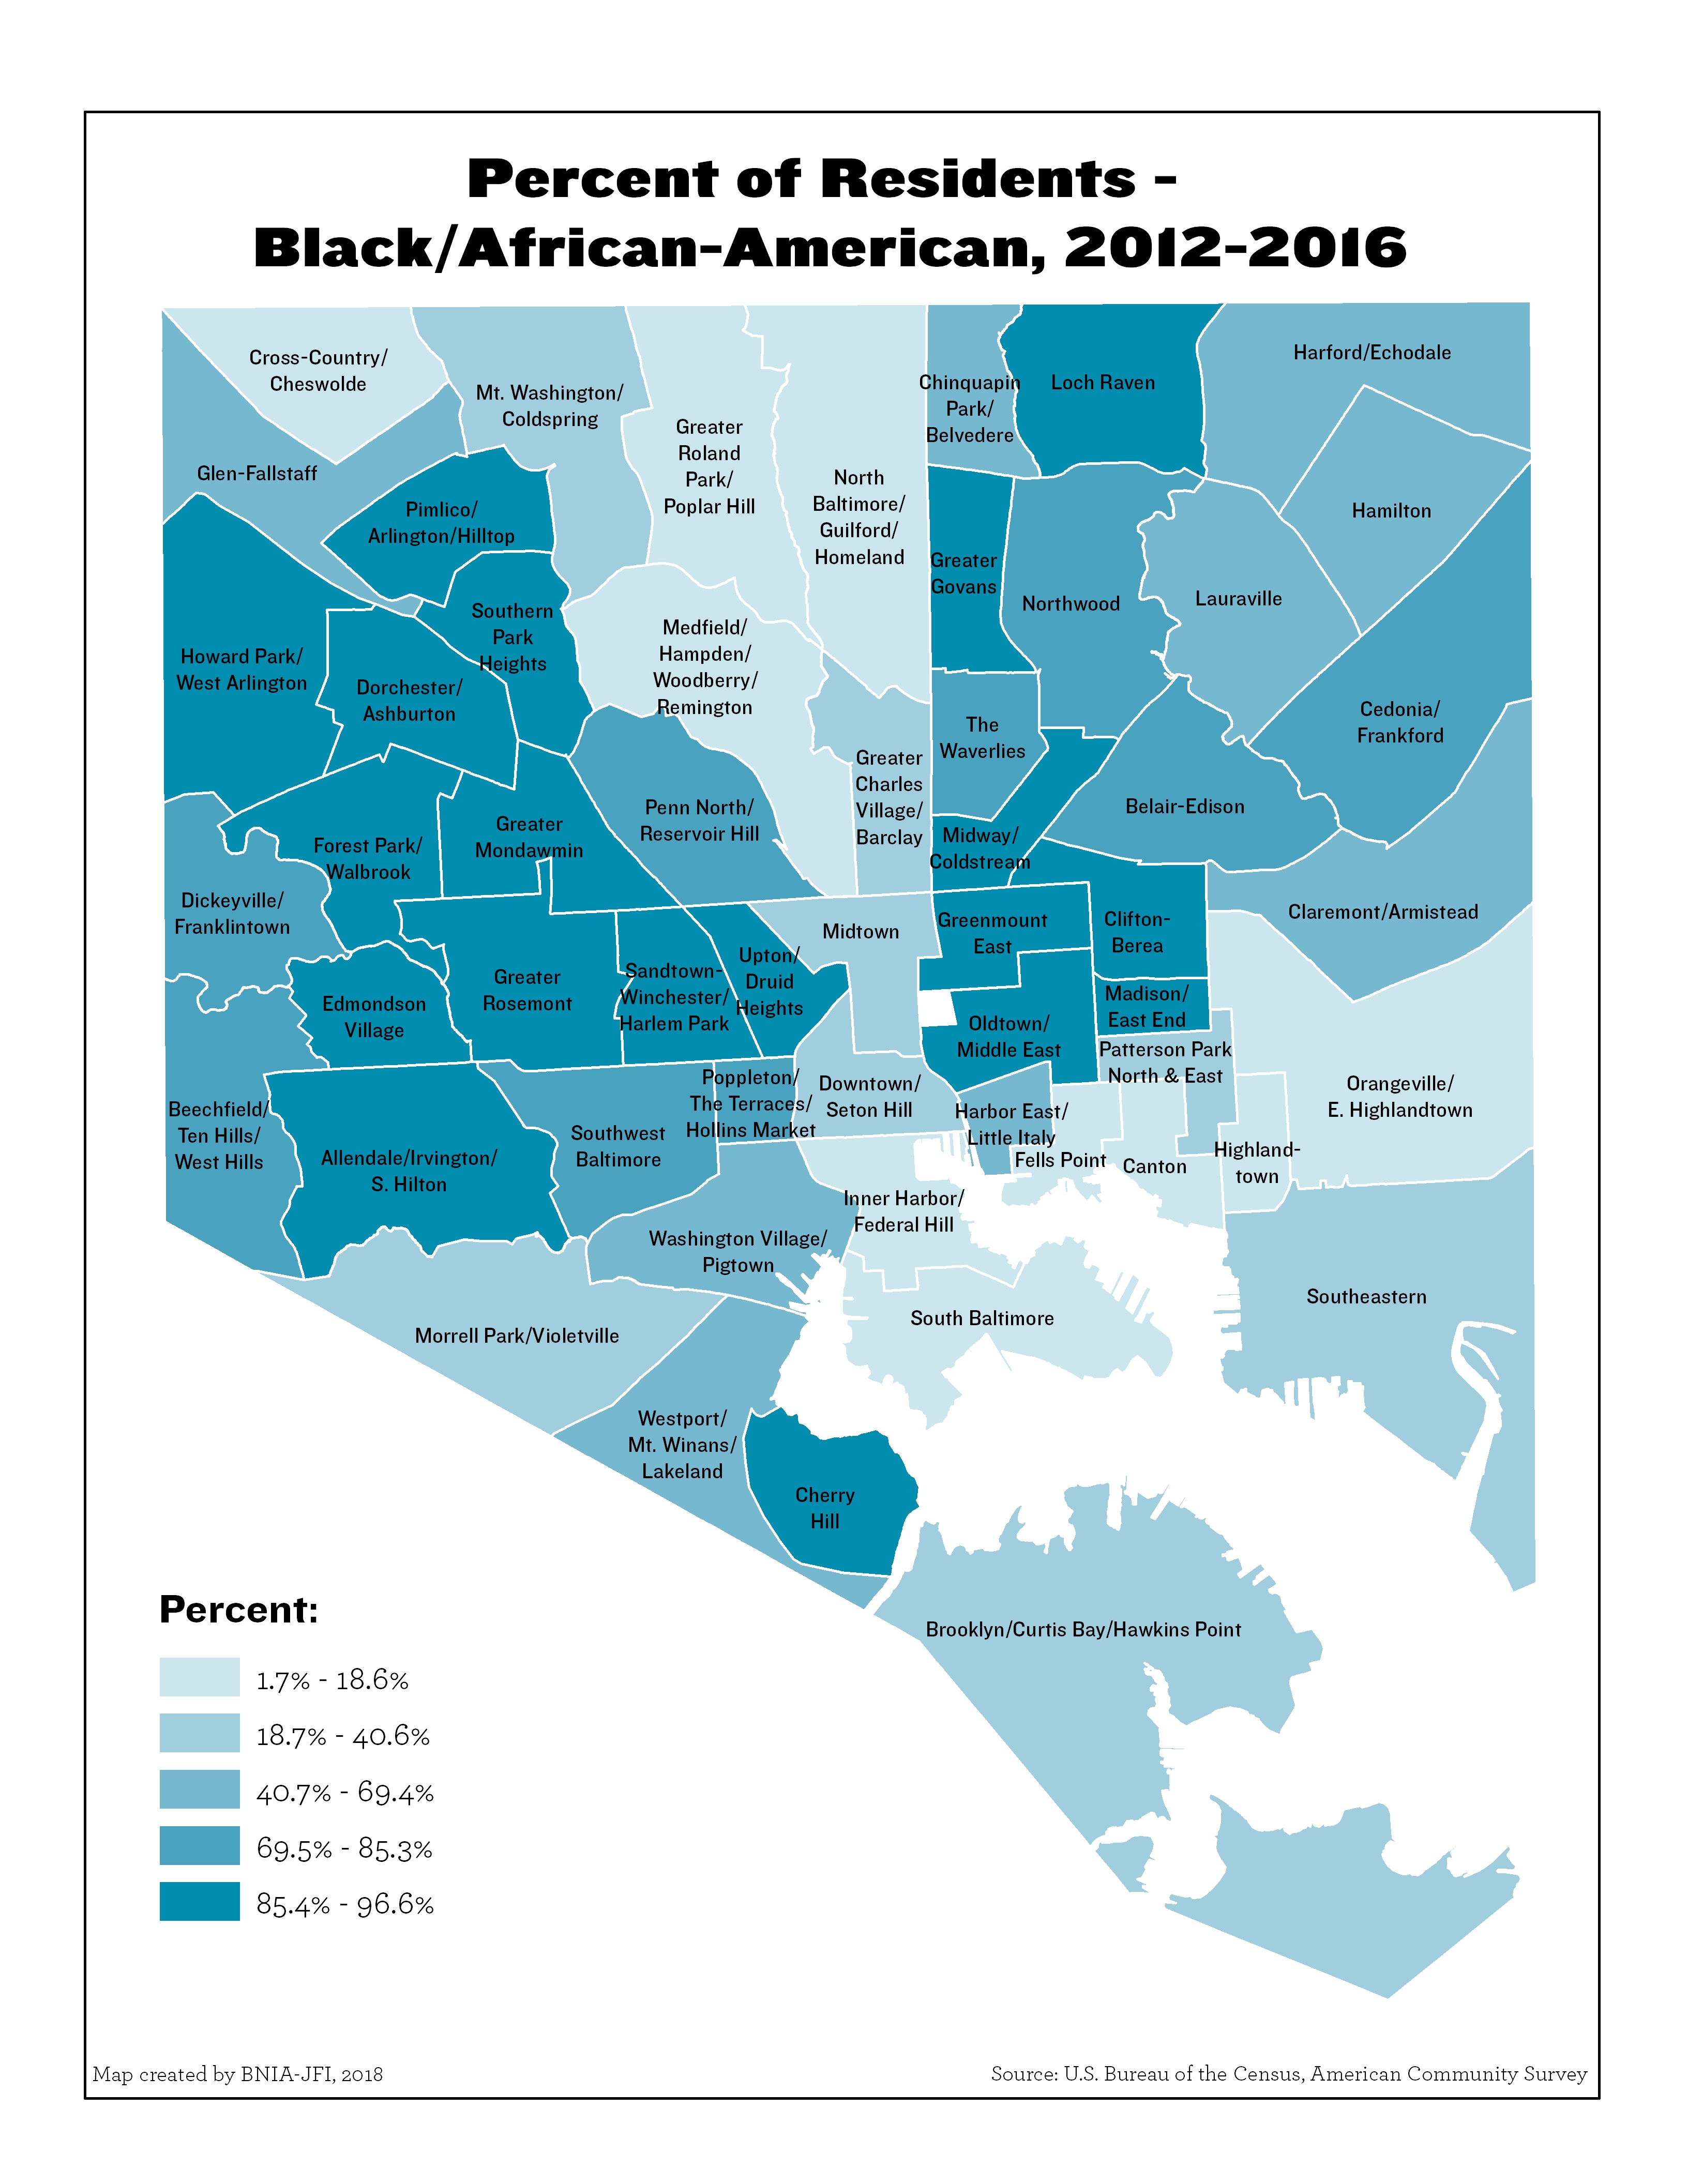
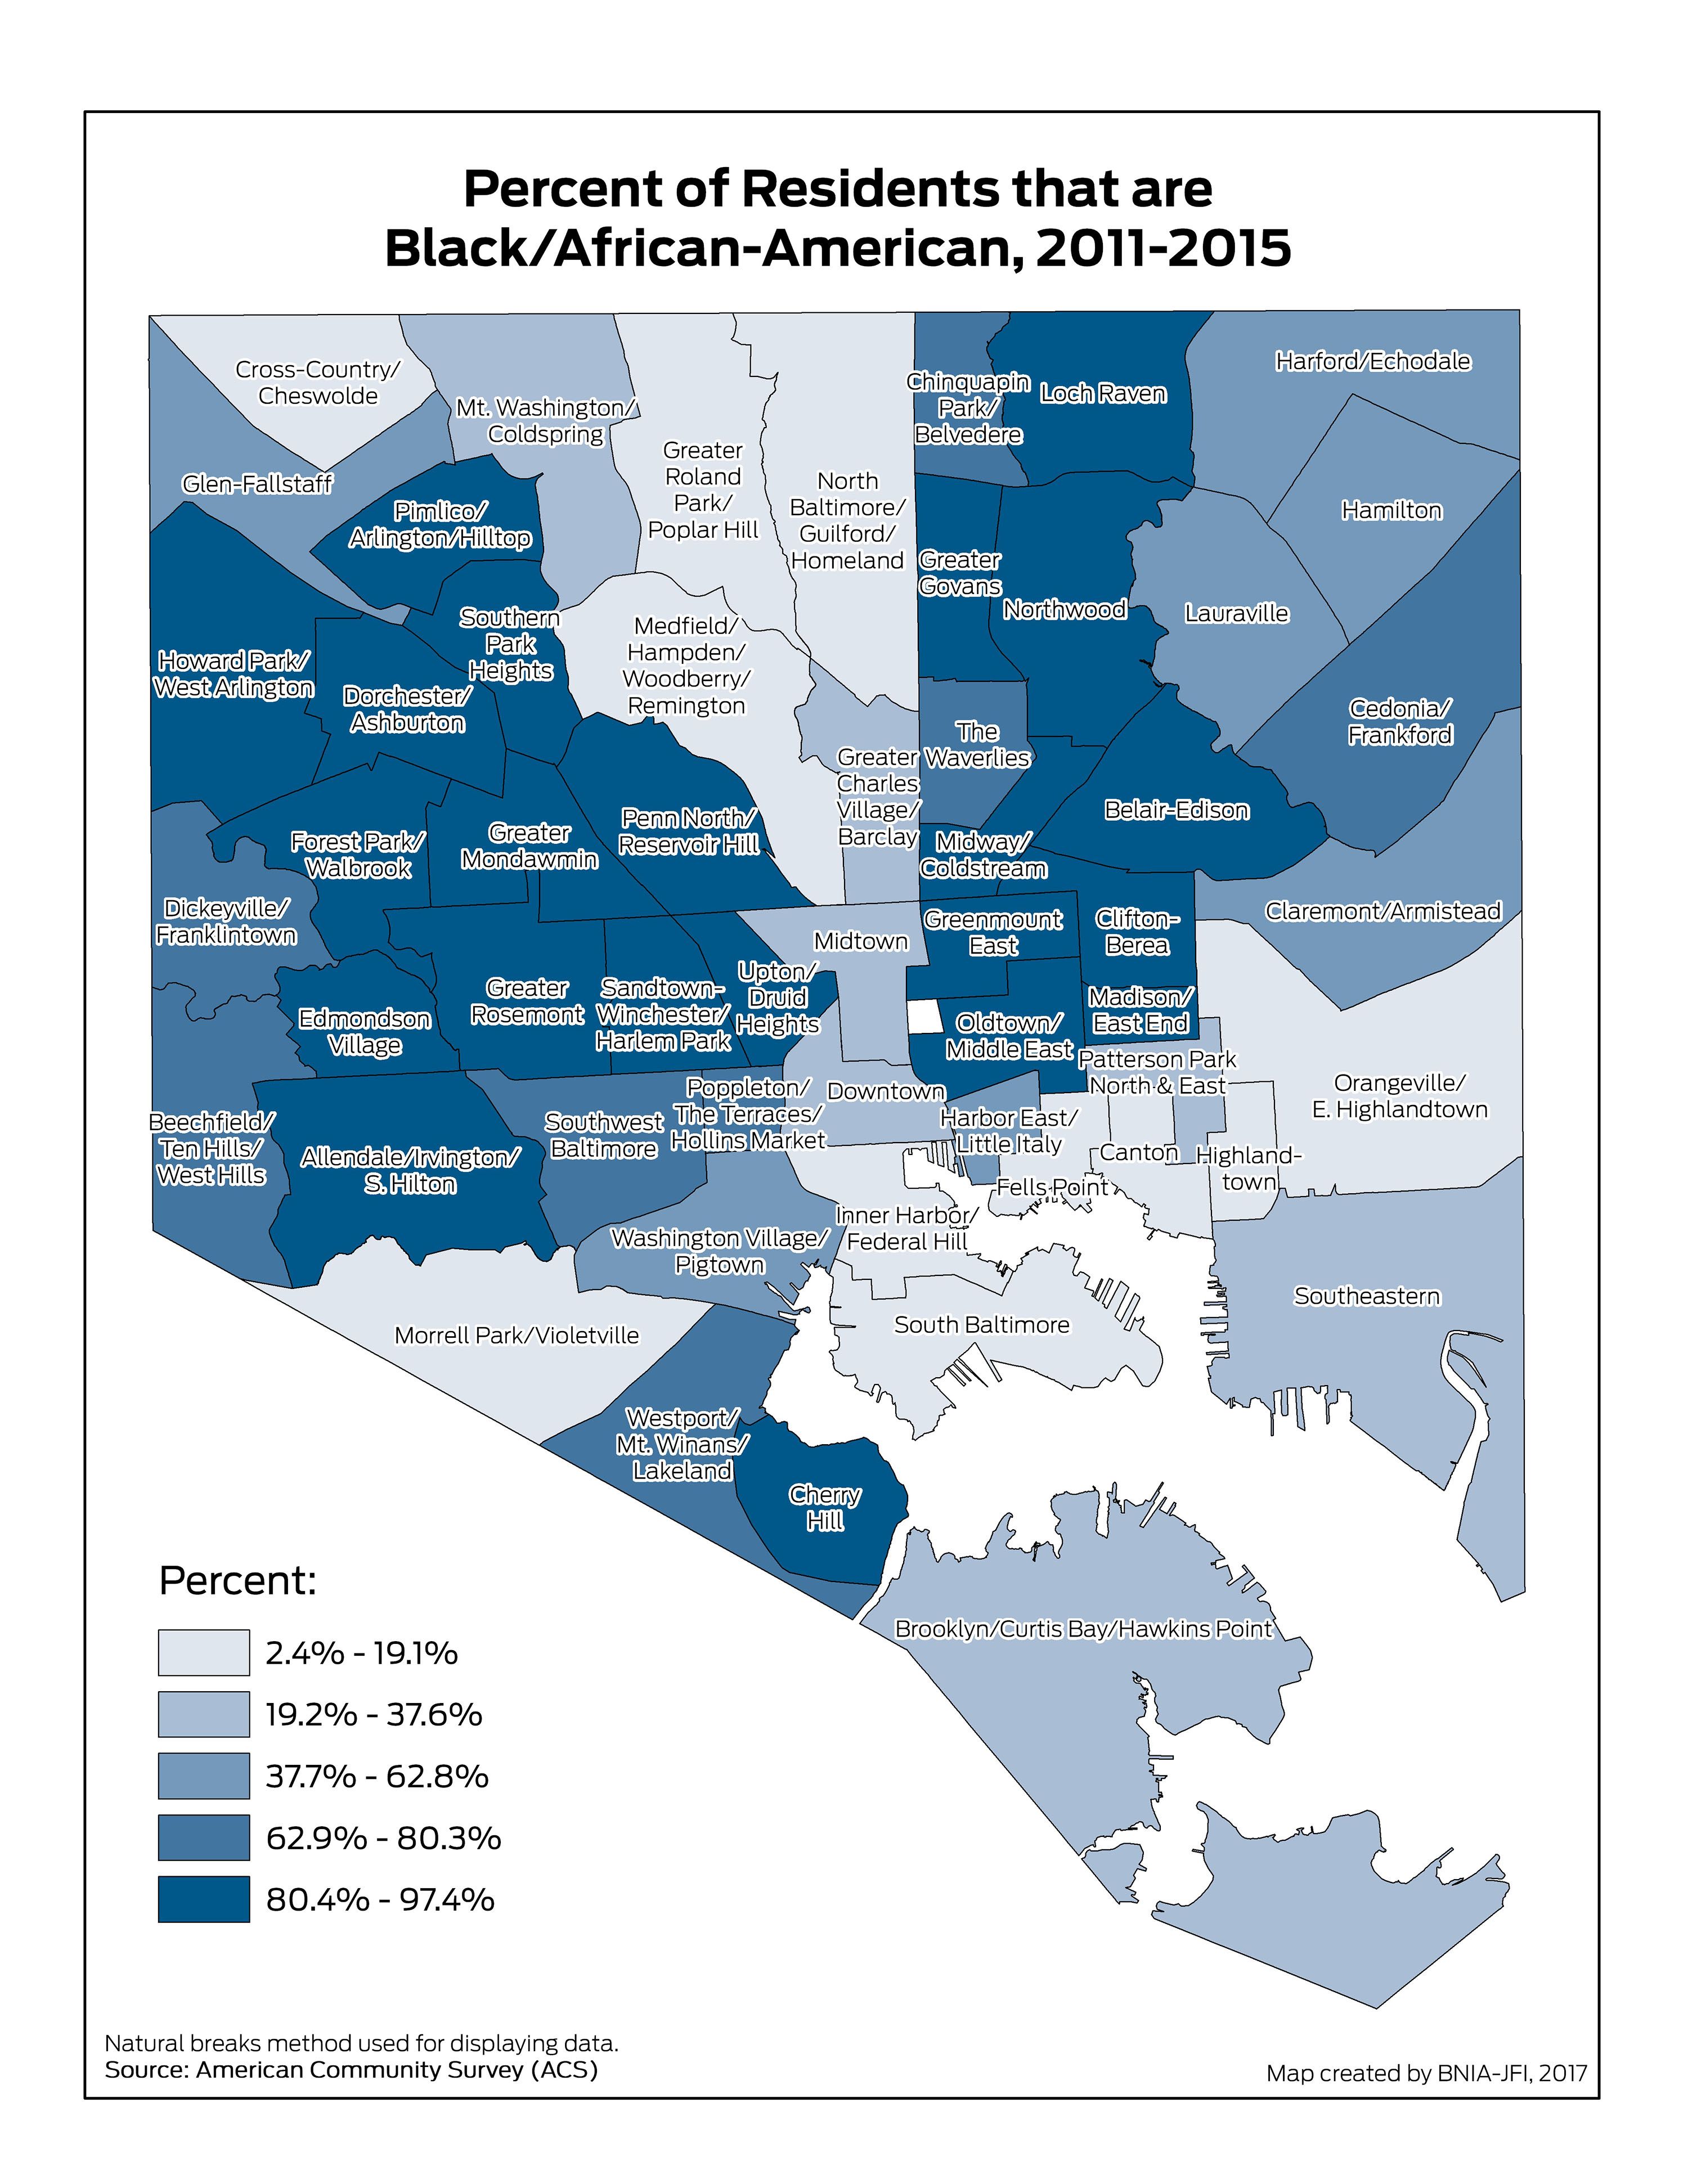
Percent of Residents – Black/African American (Non-Hispanic)
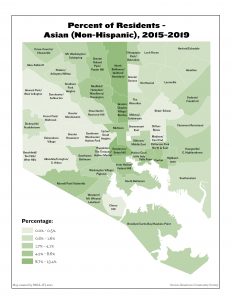
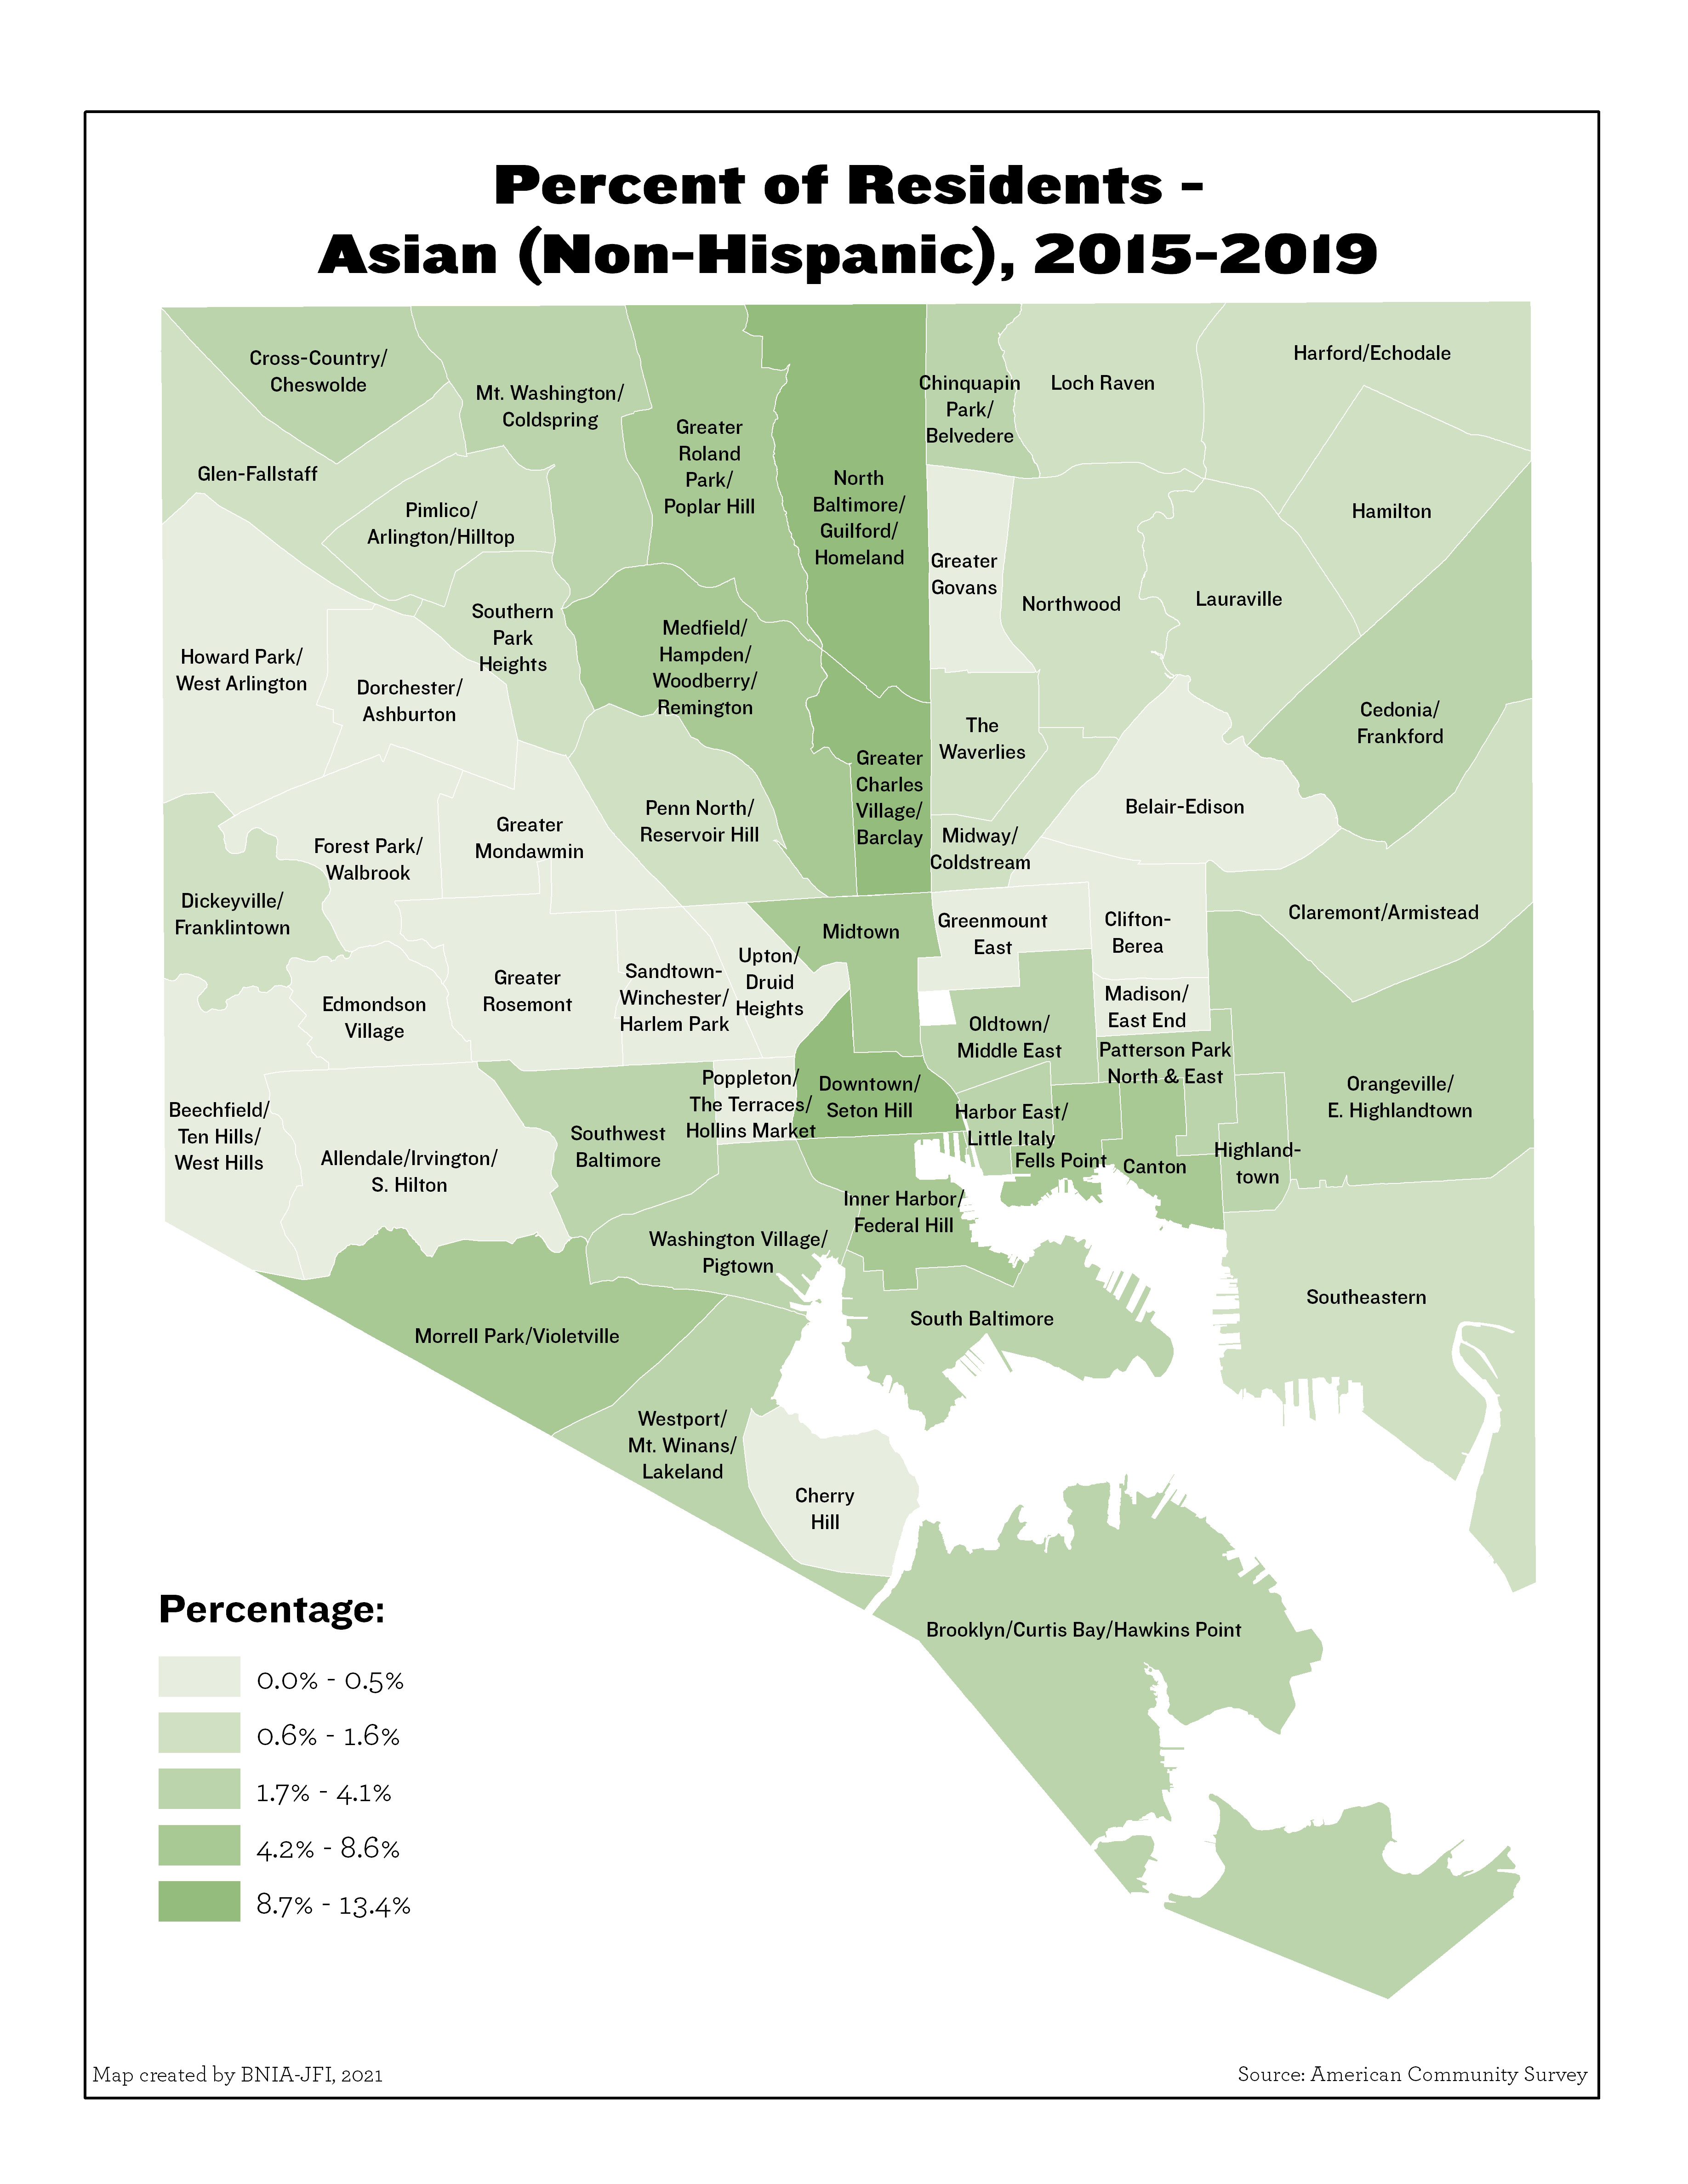
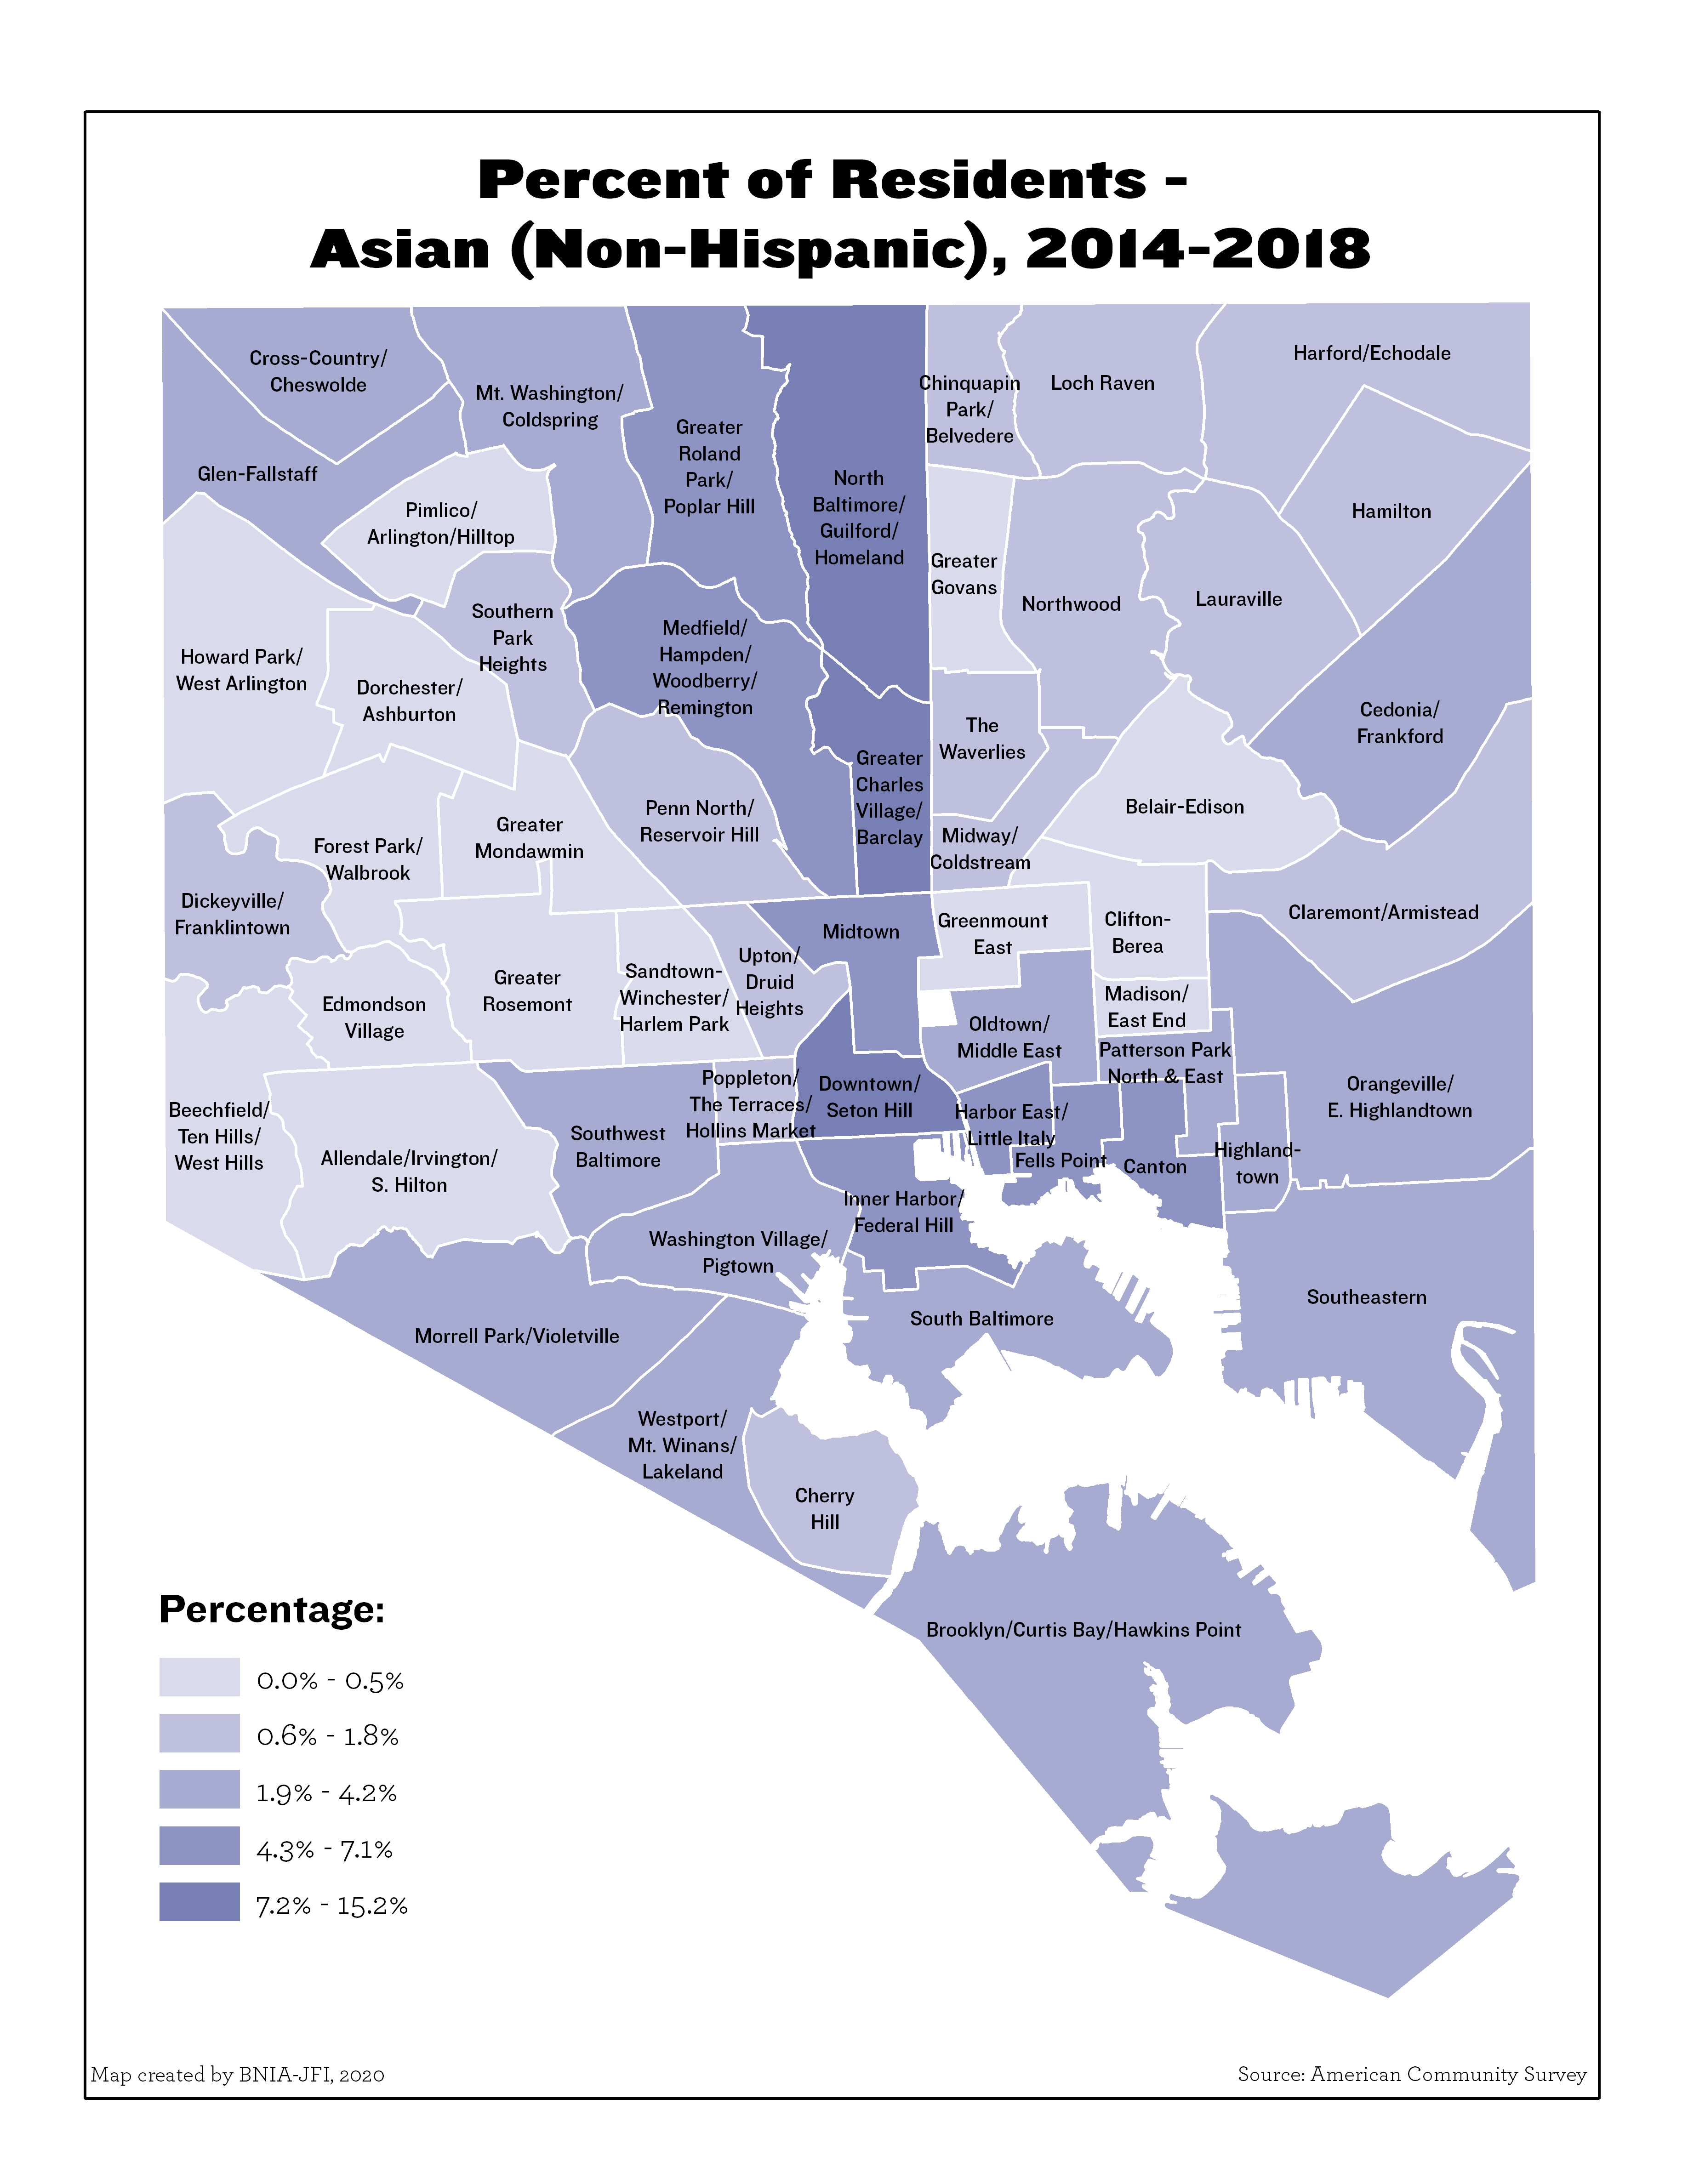
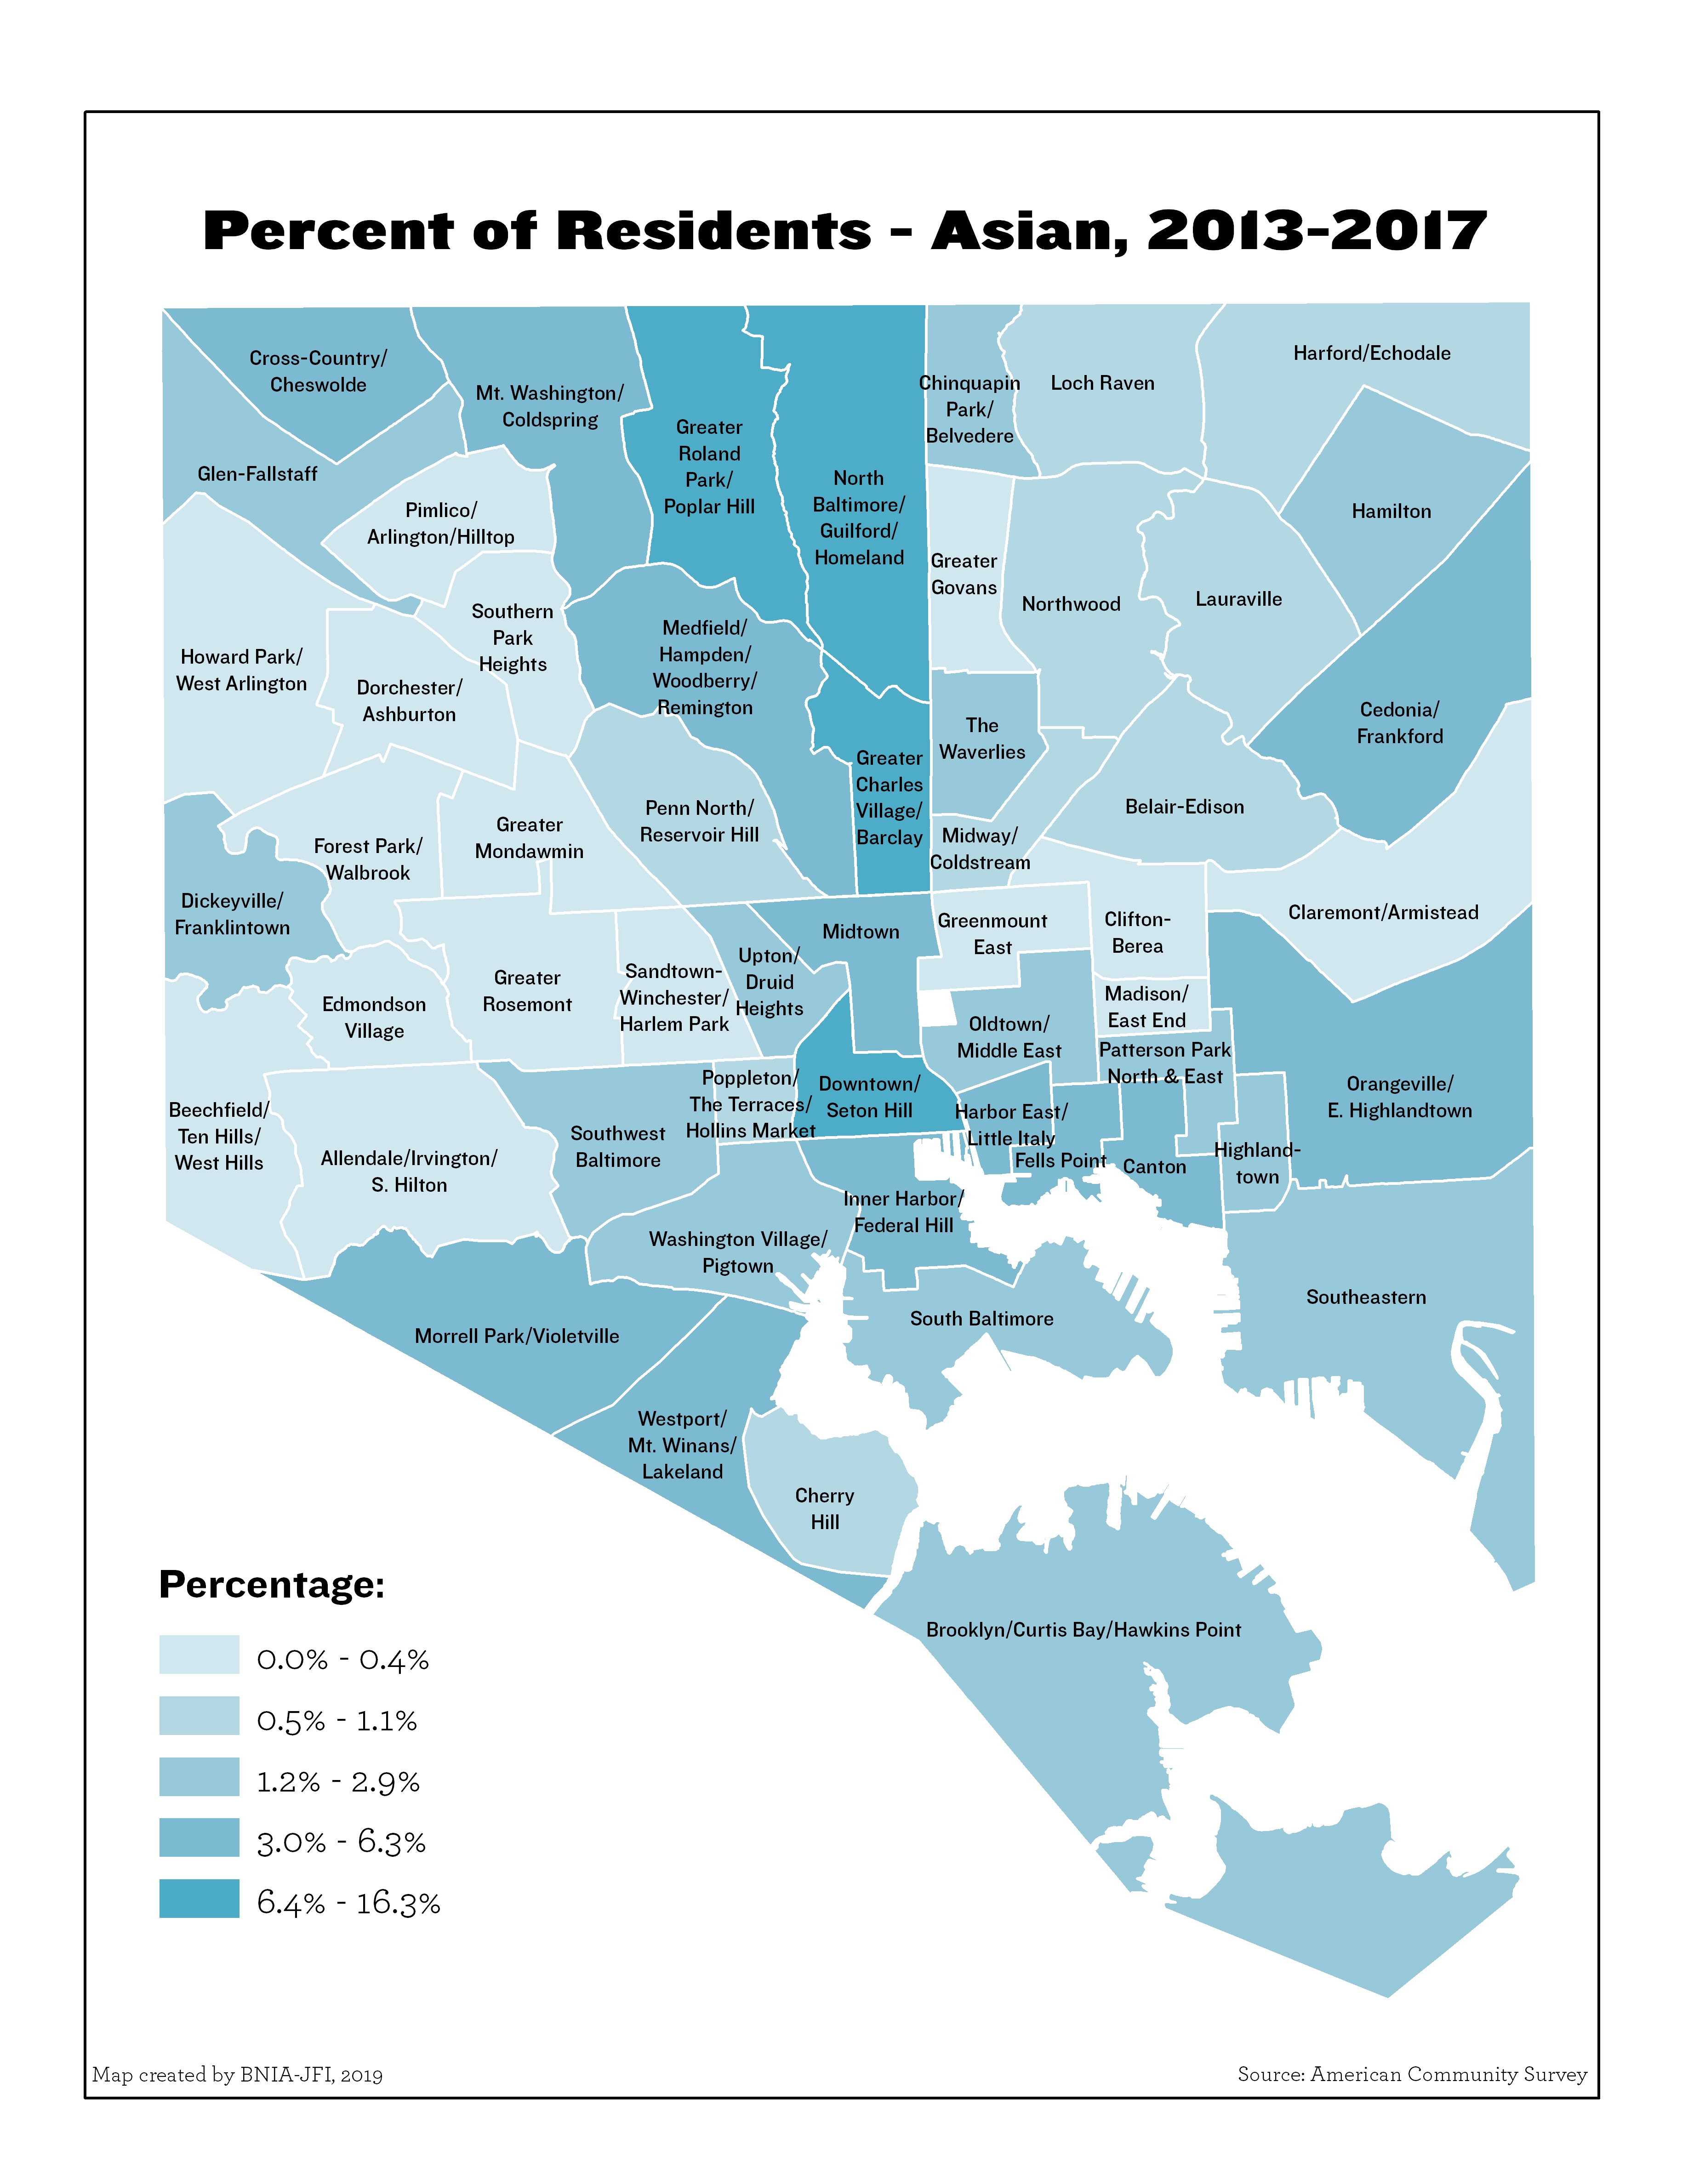
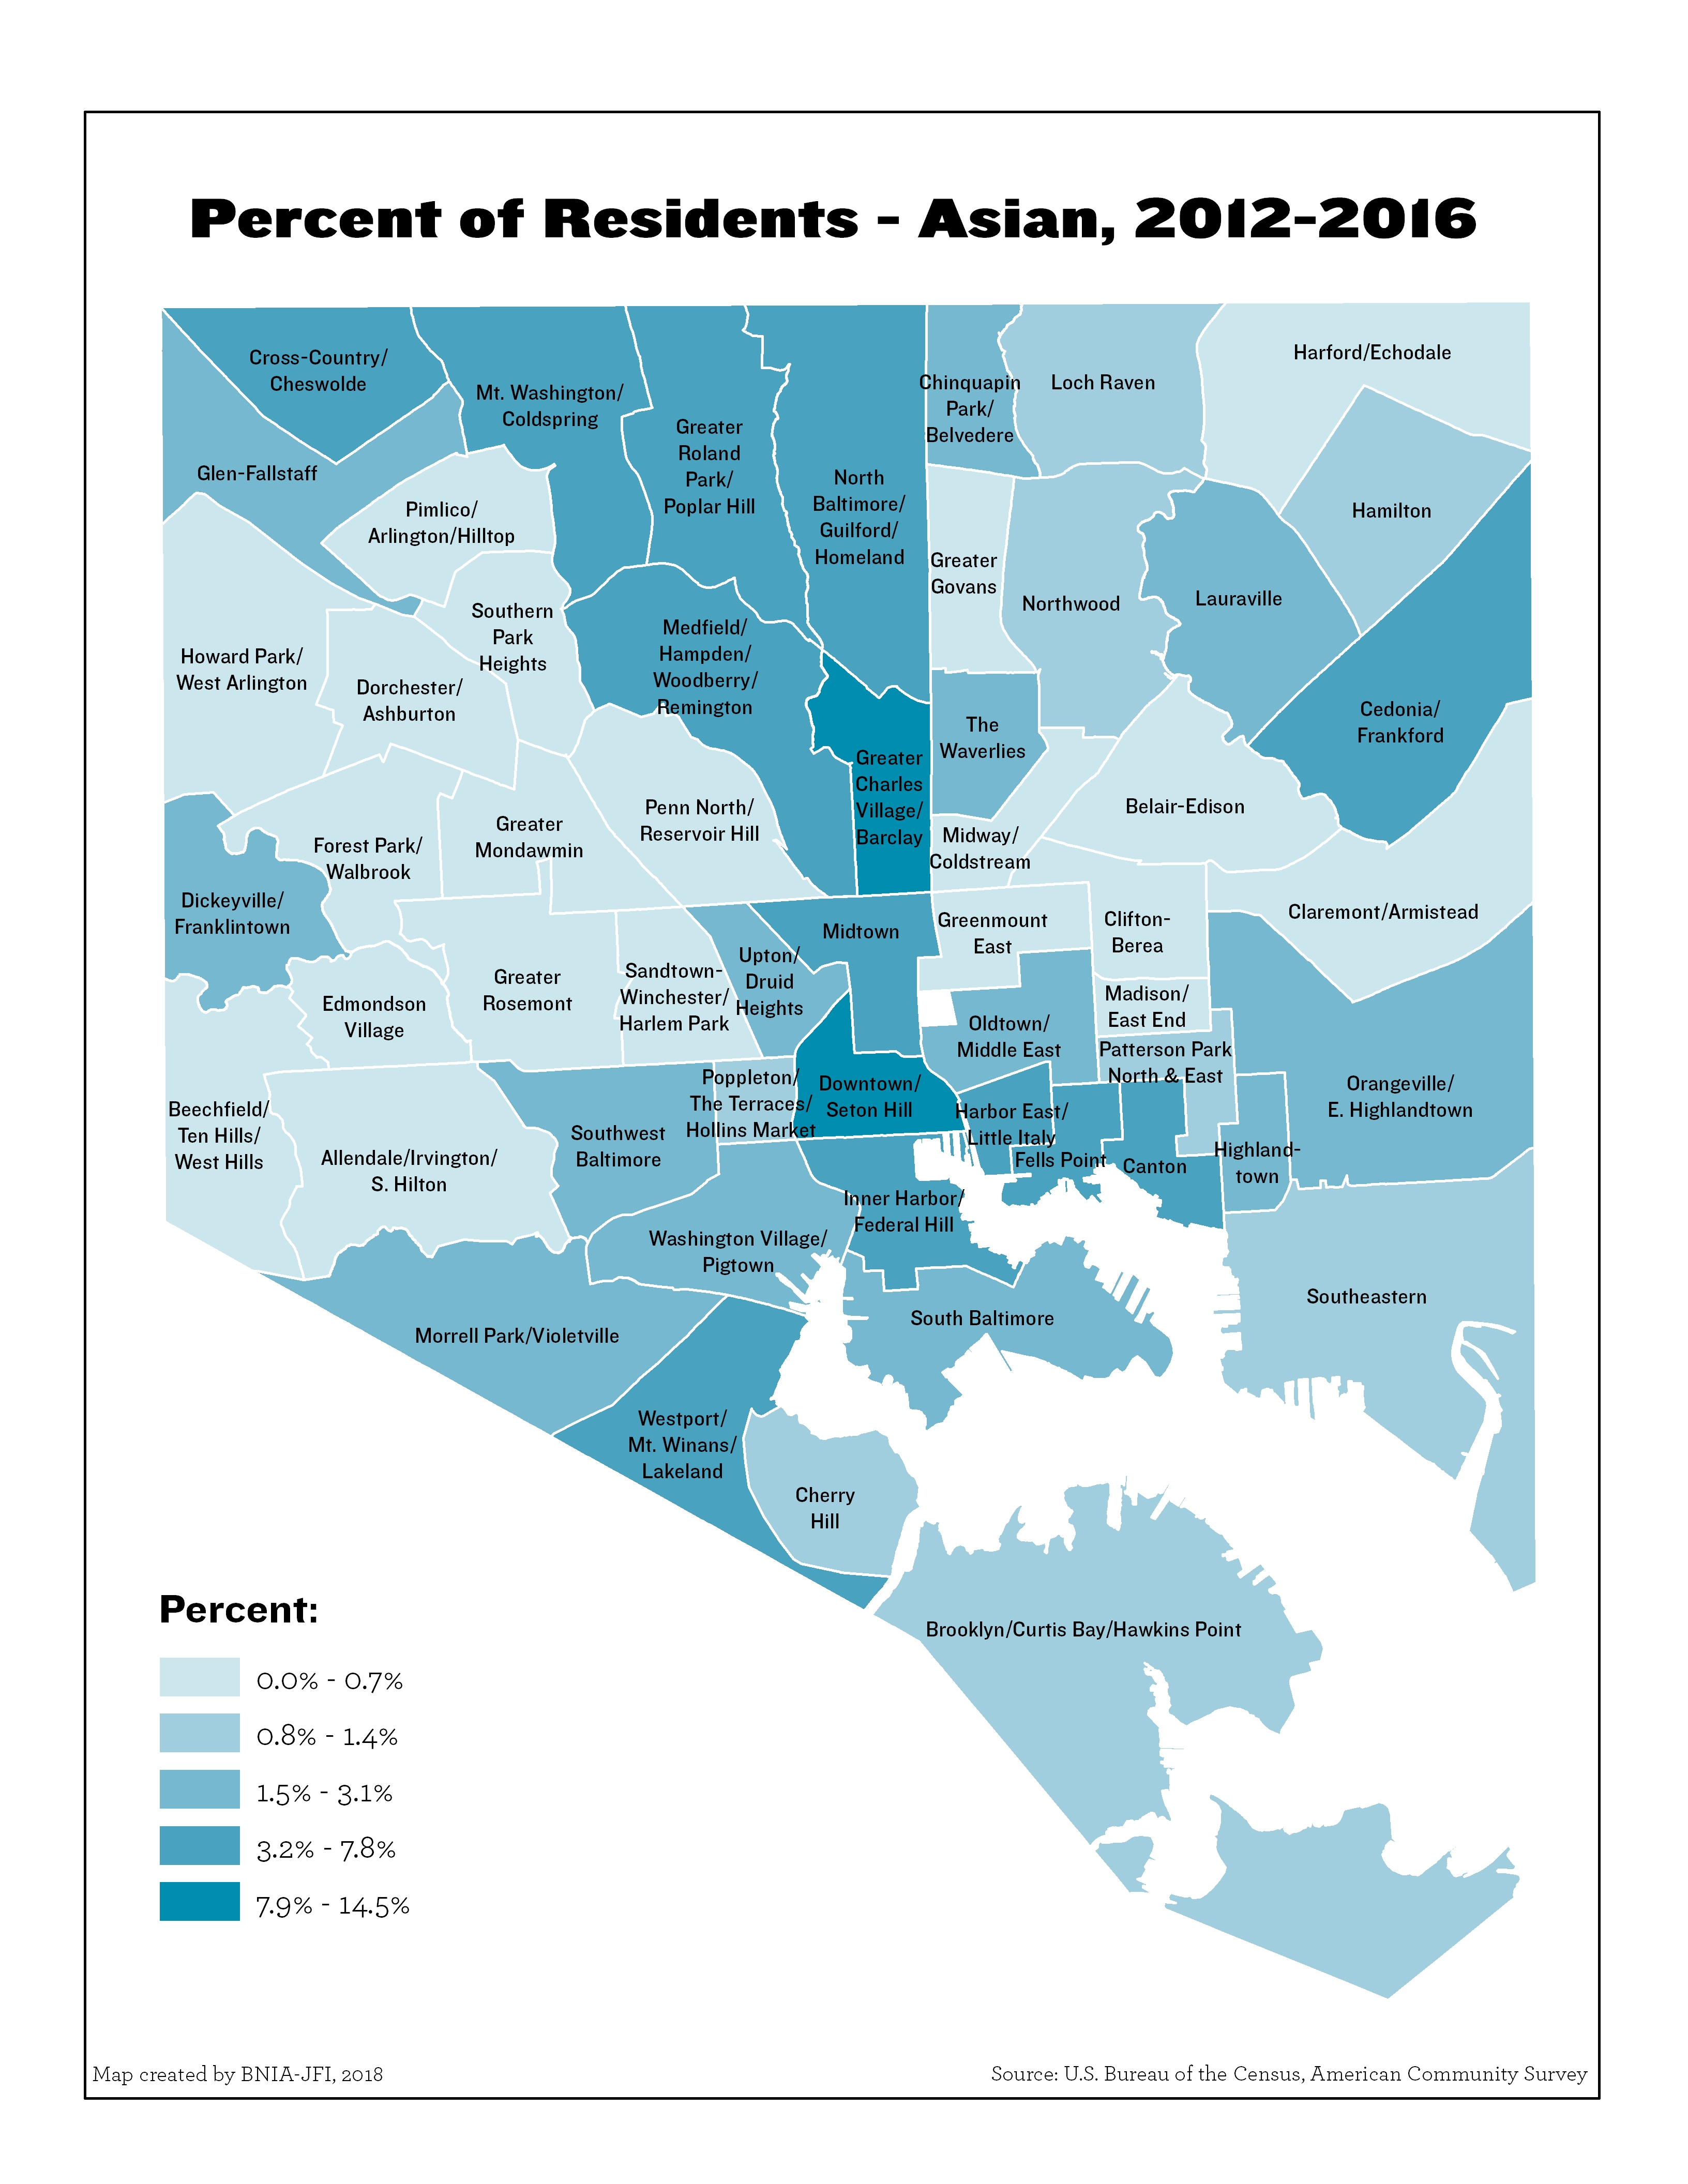
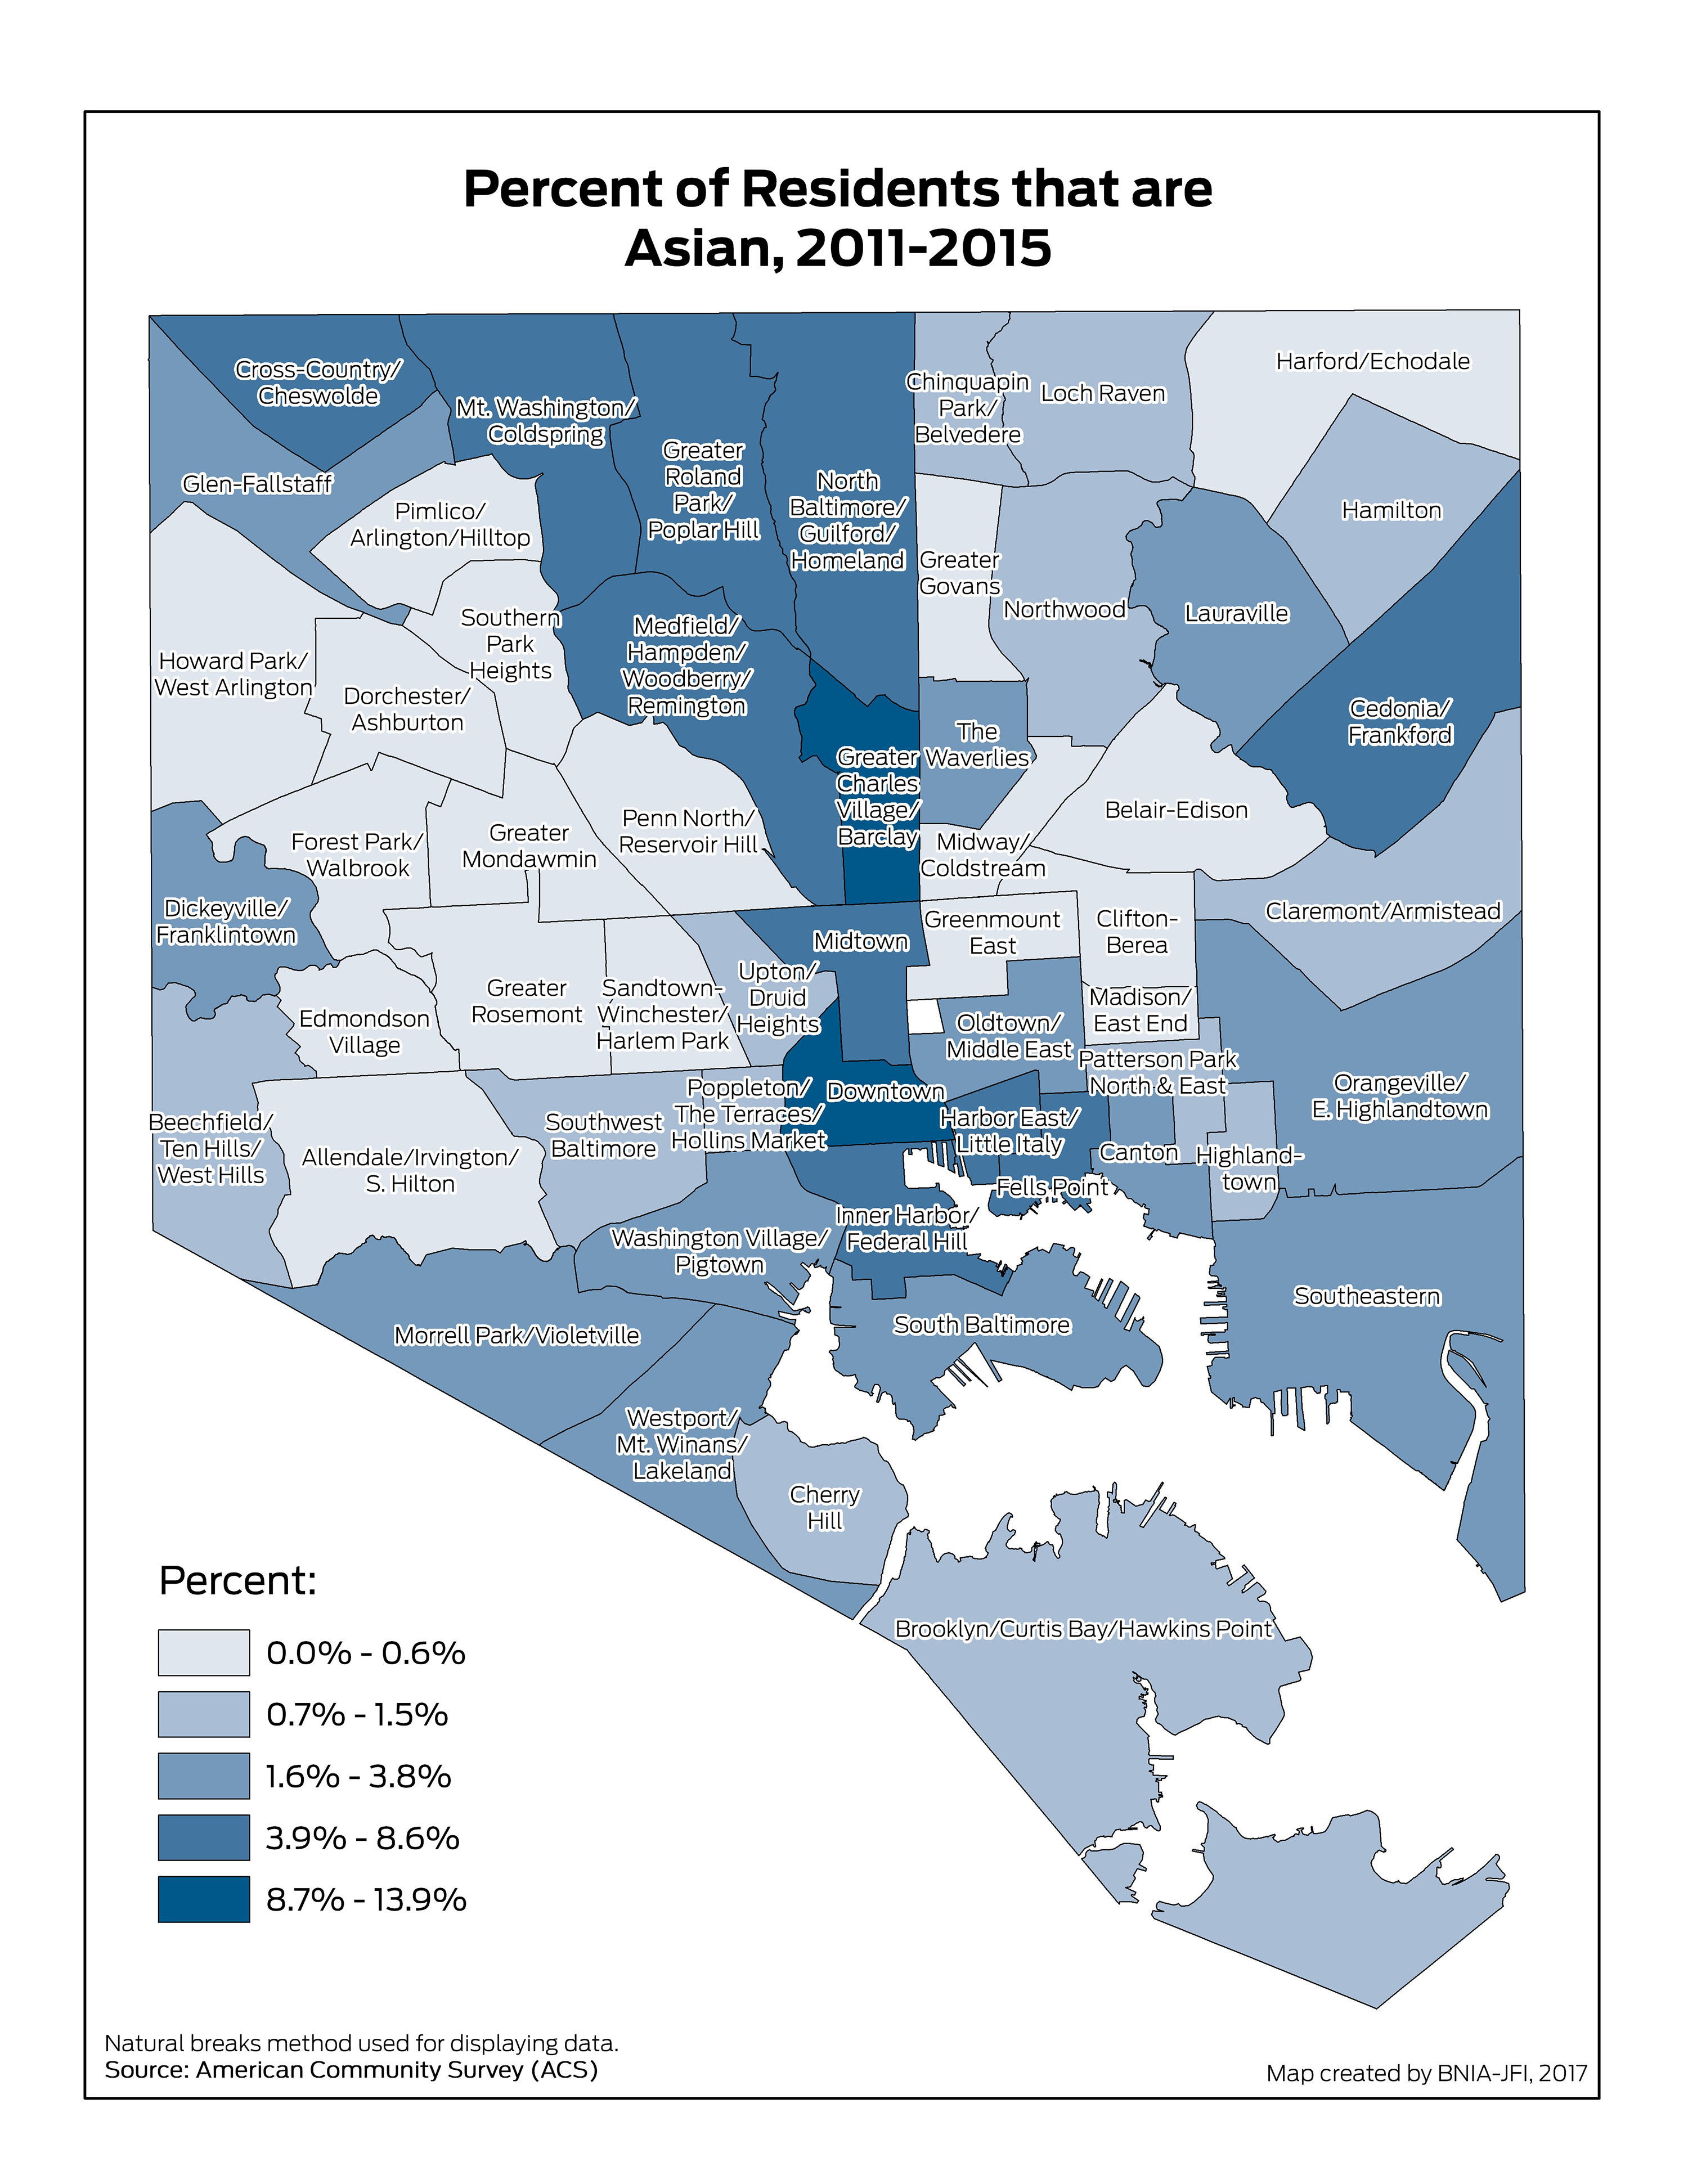
Percent of Residents – Asian (Non-Hispanic)
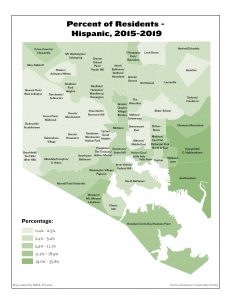
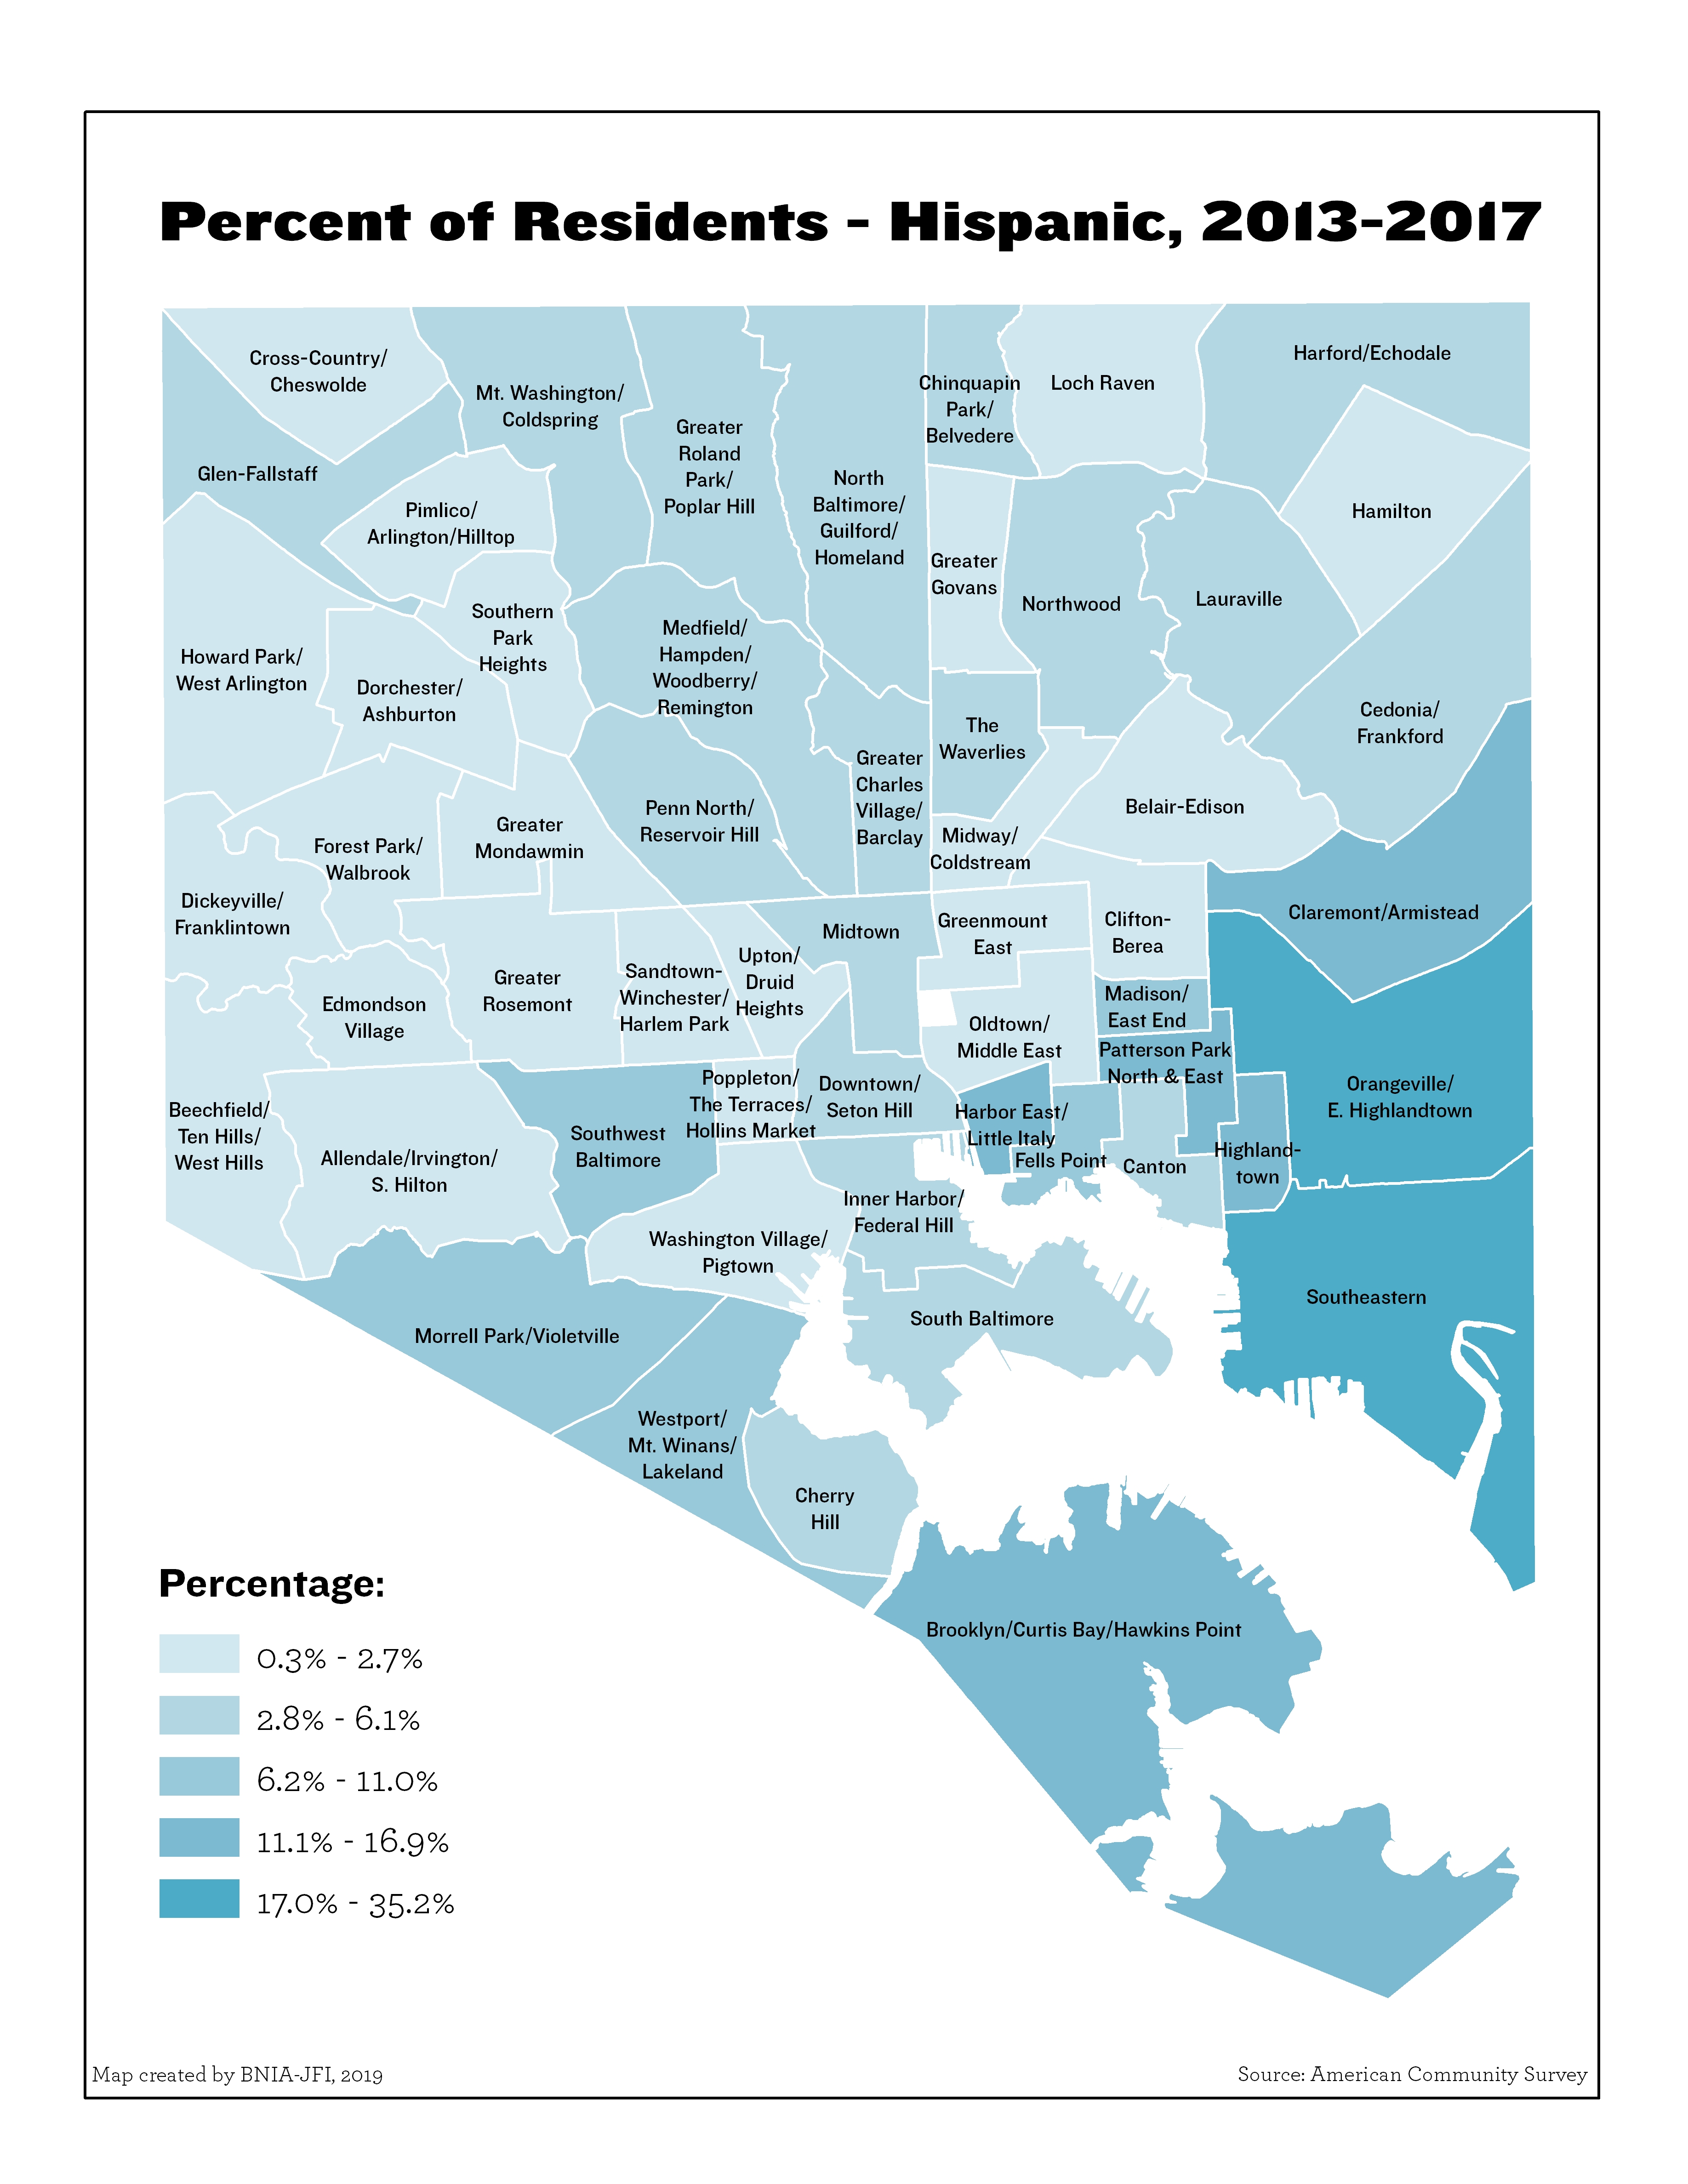
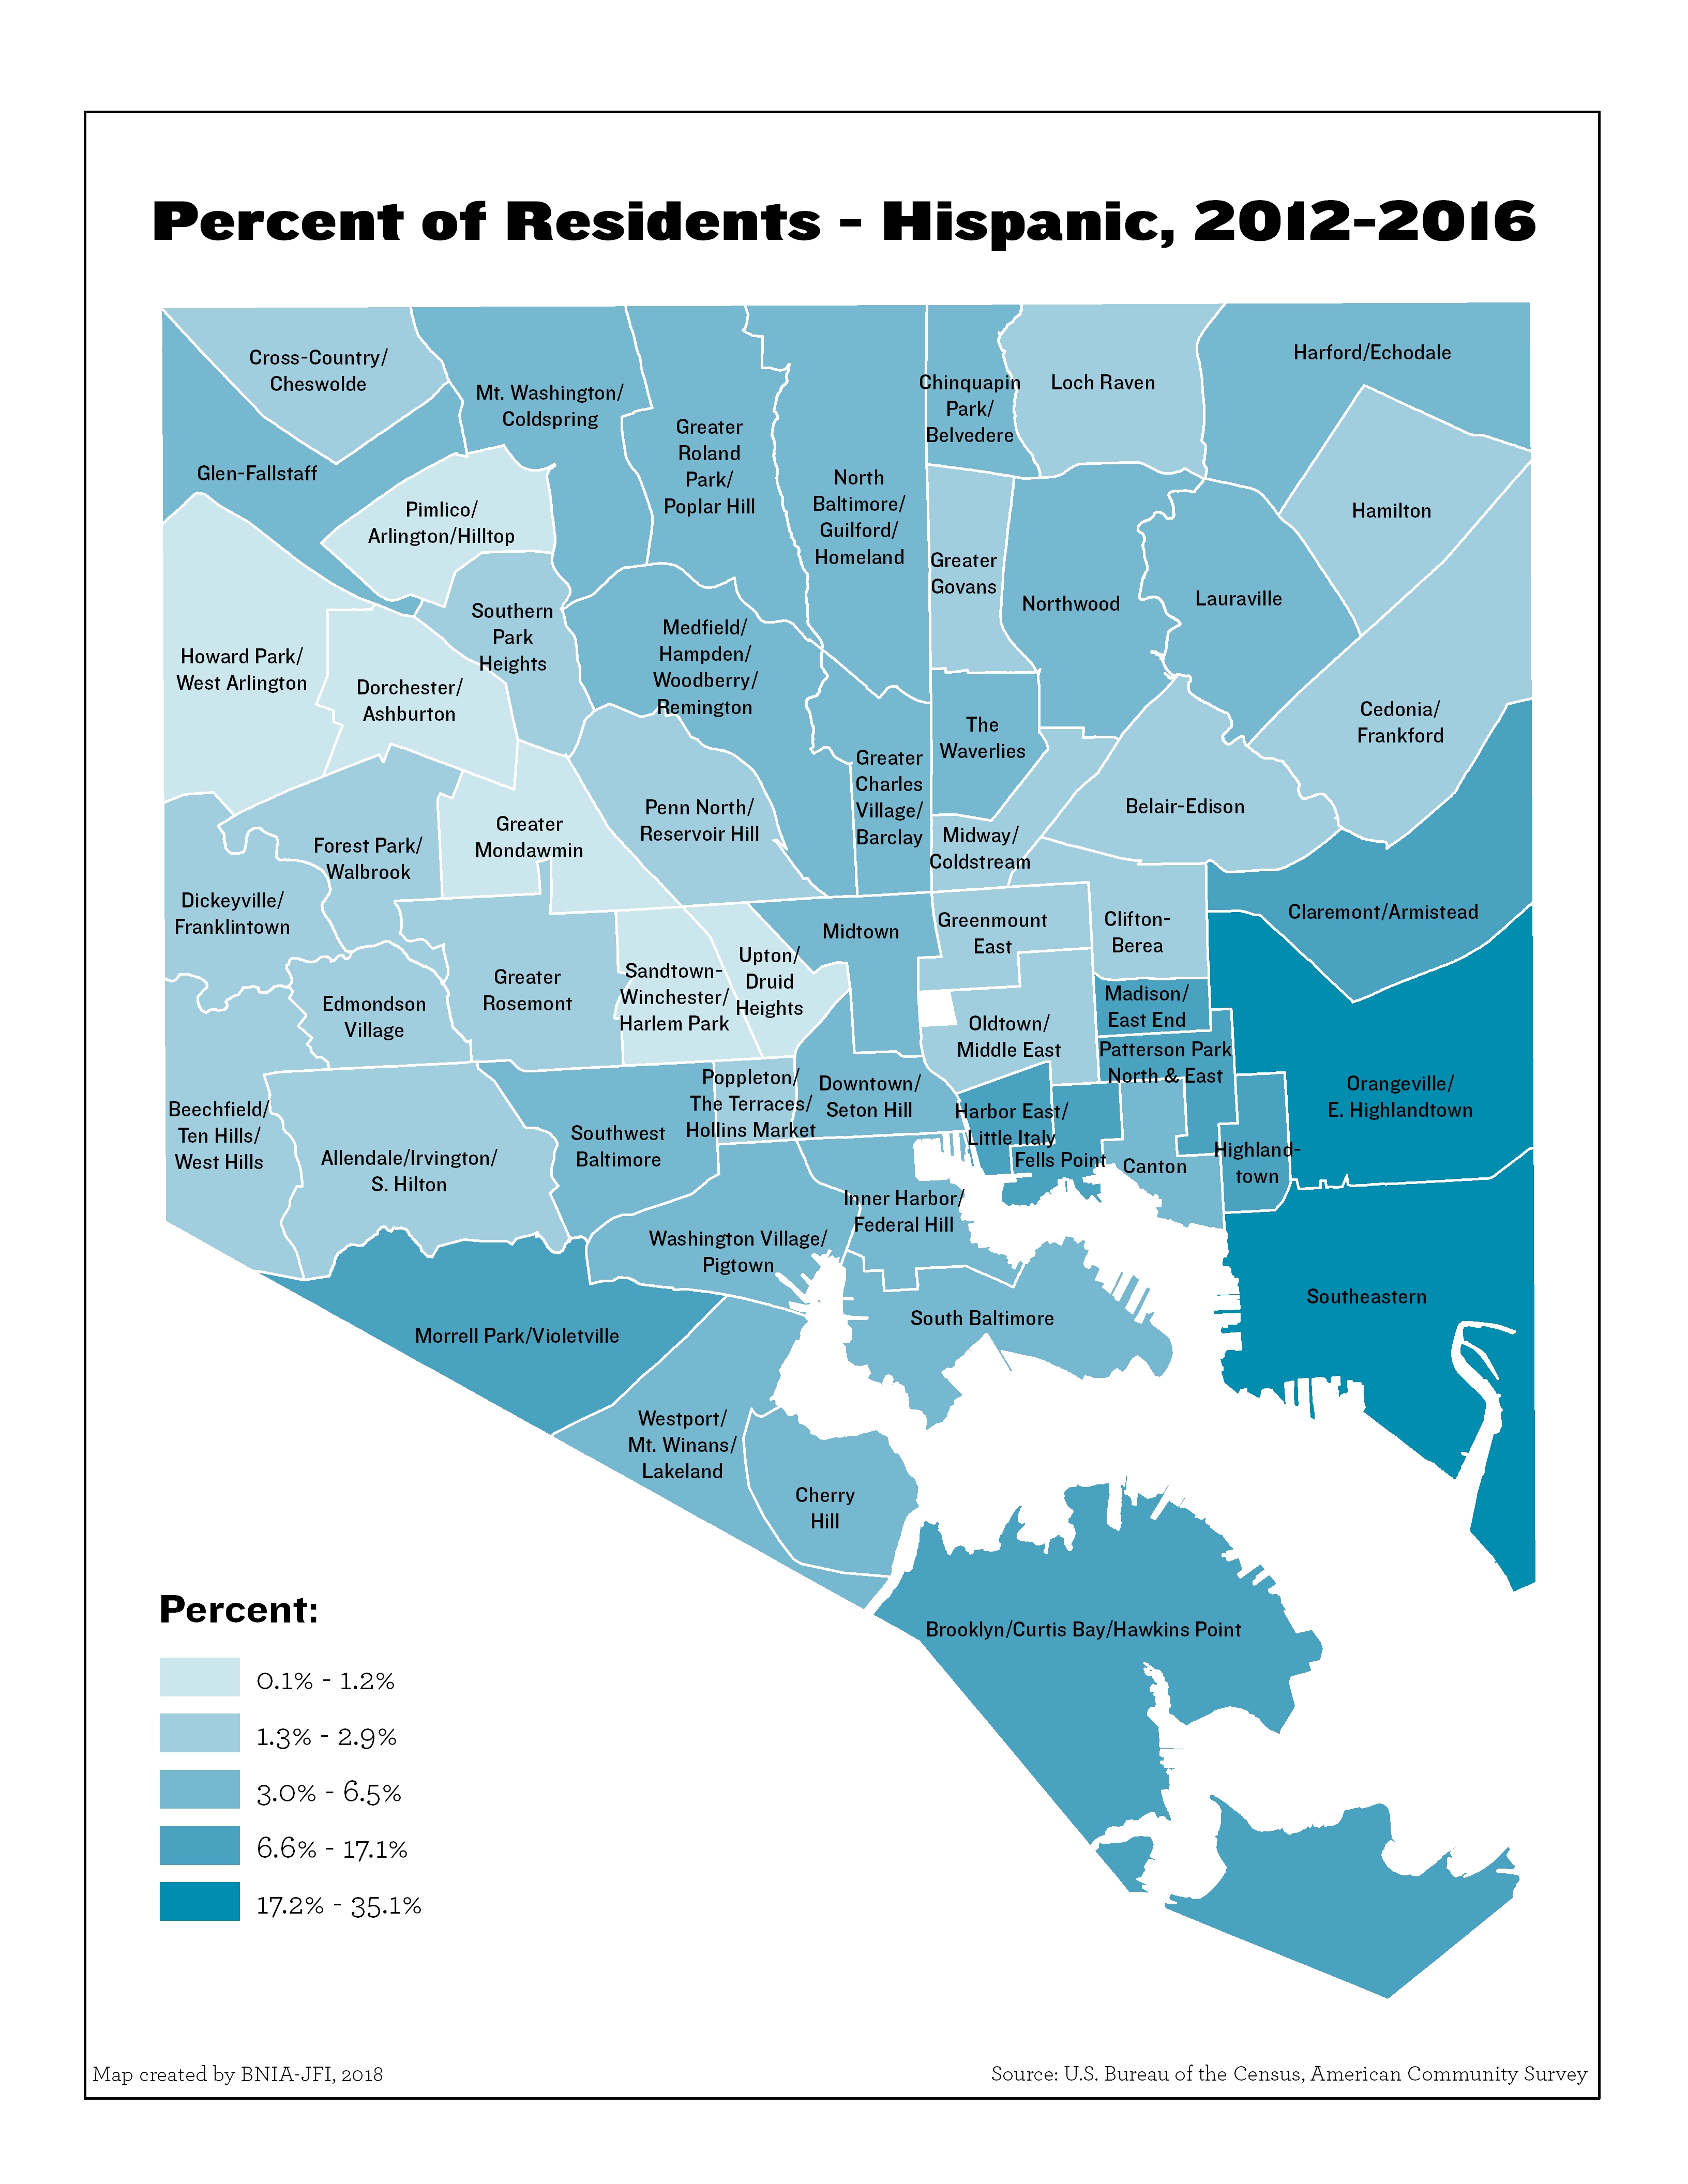
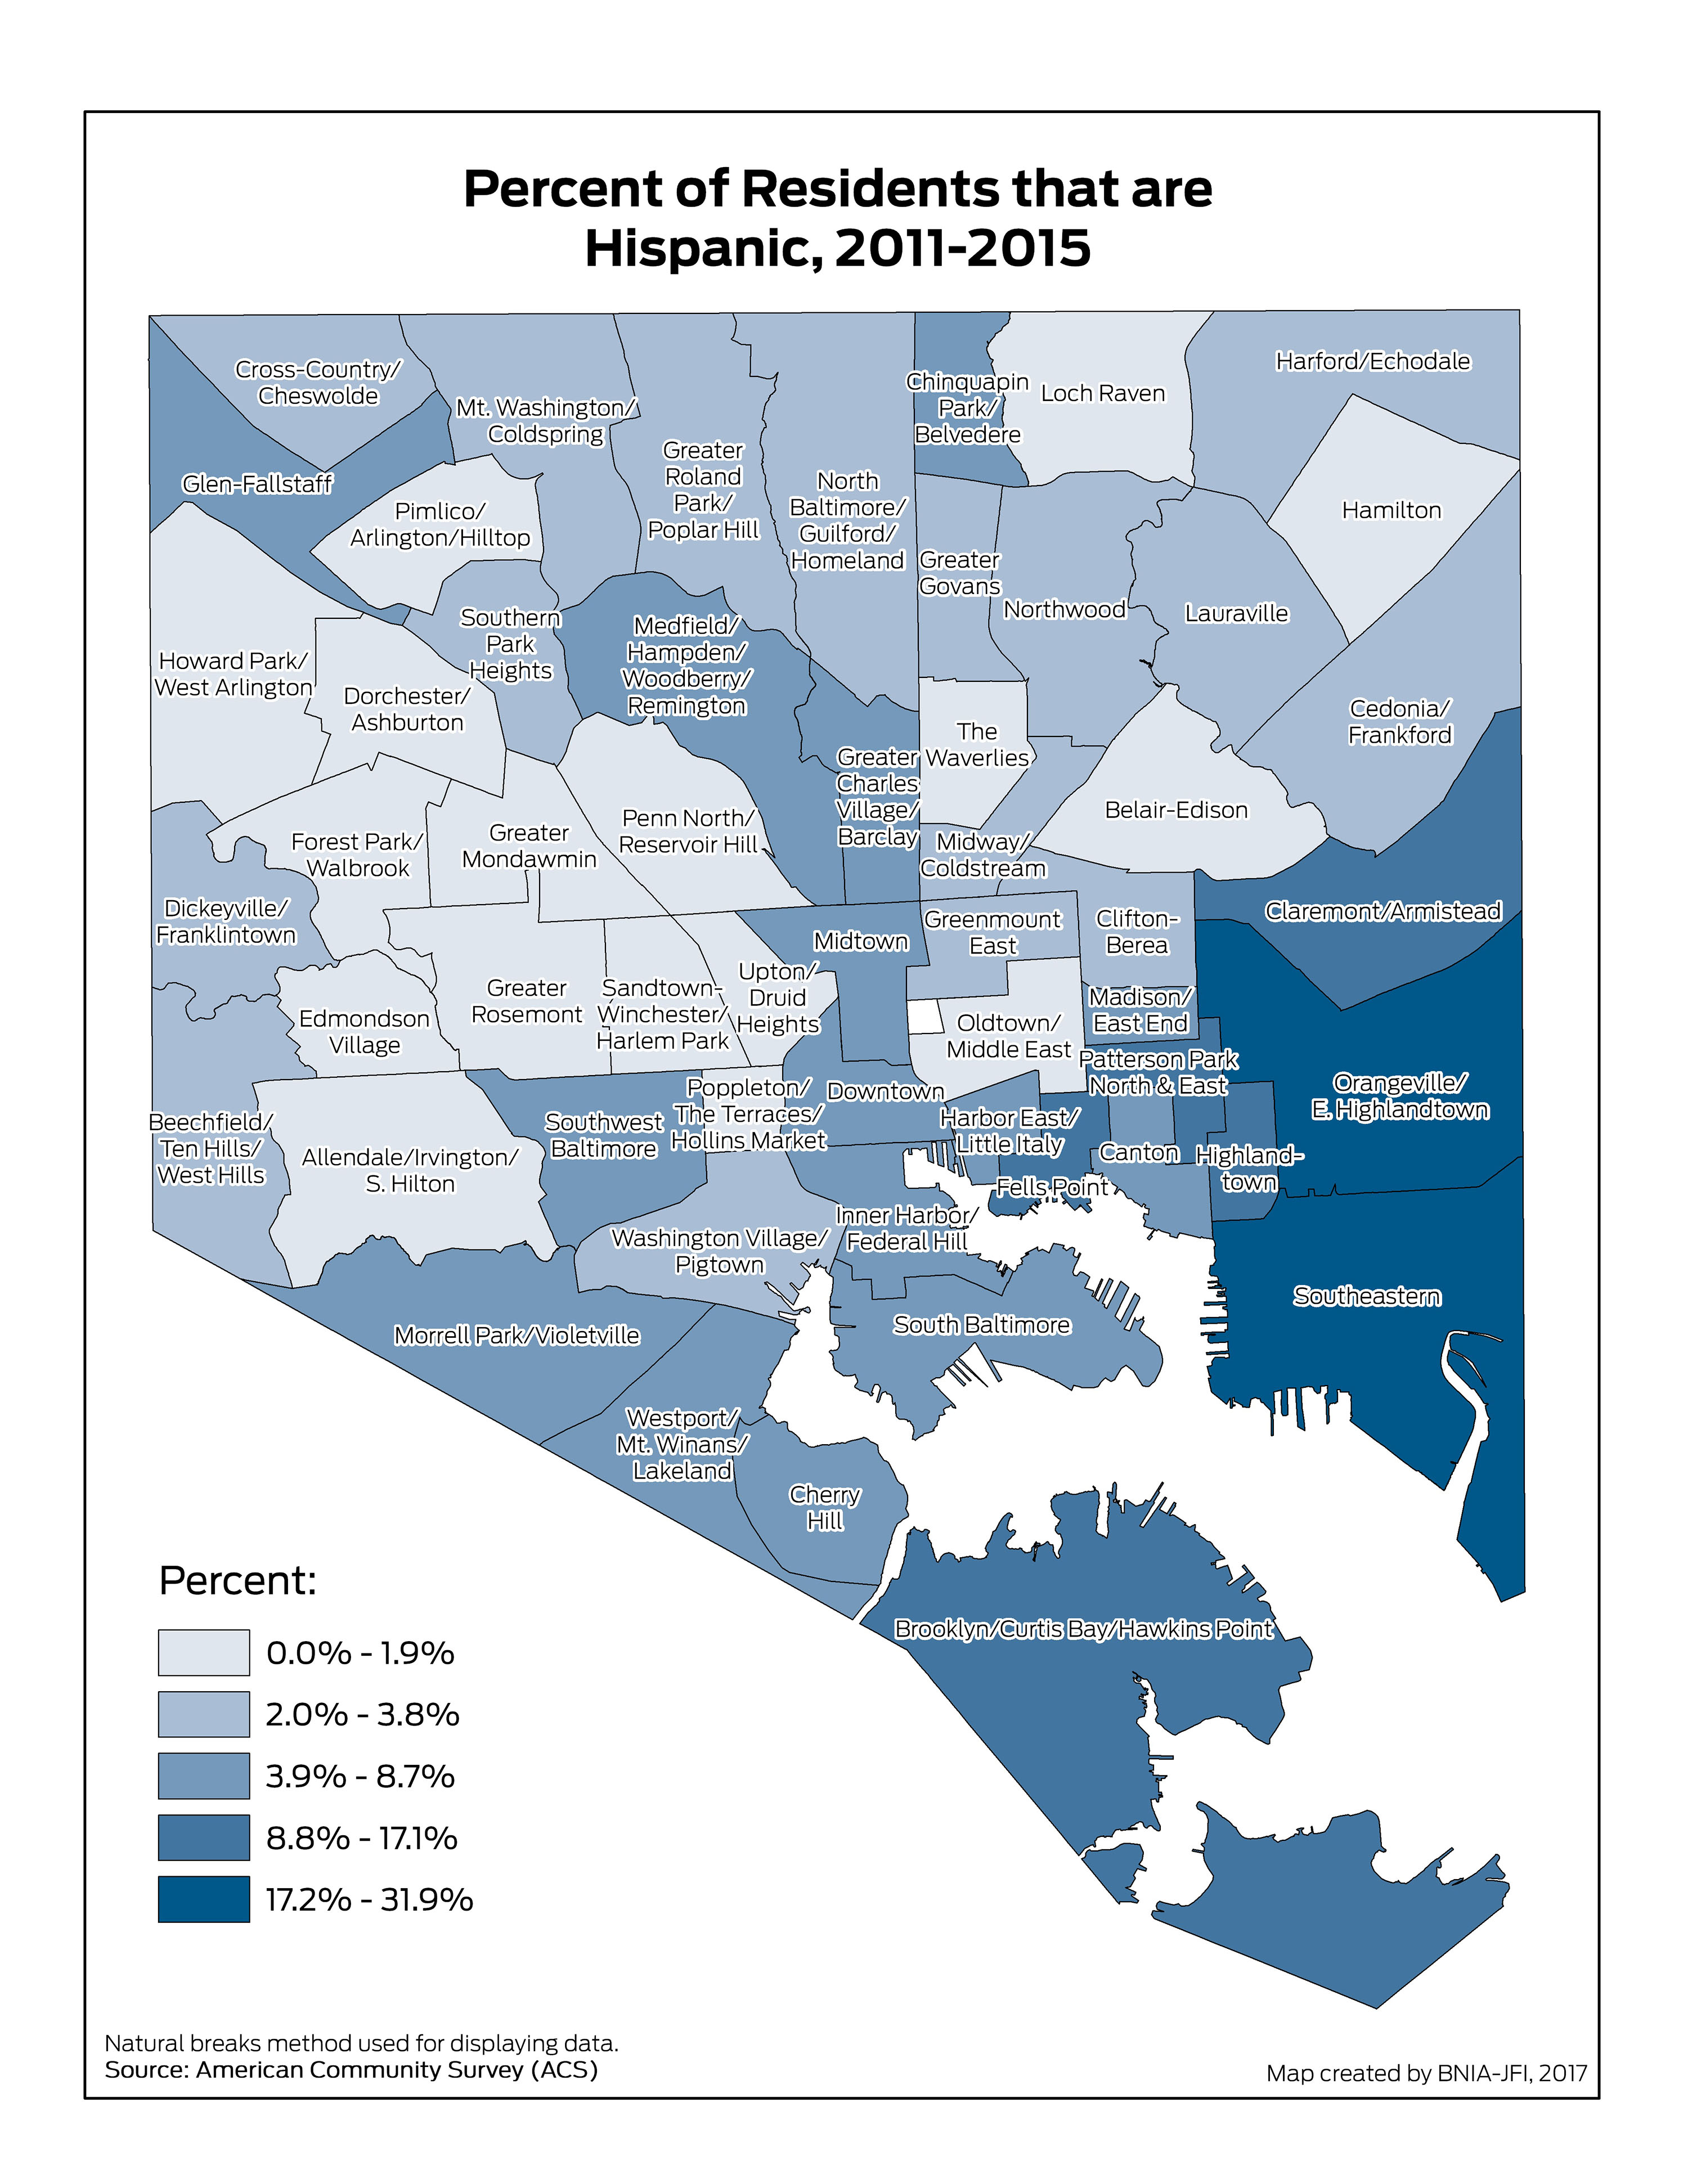
Percent of Residents – Hispanic
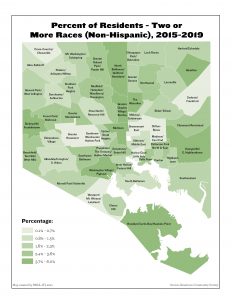
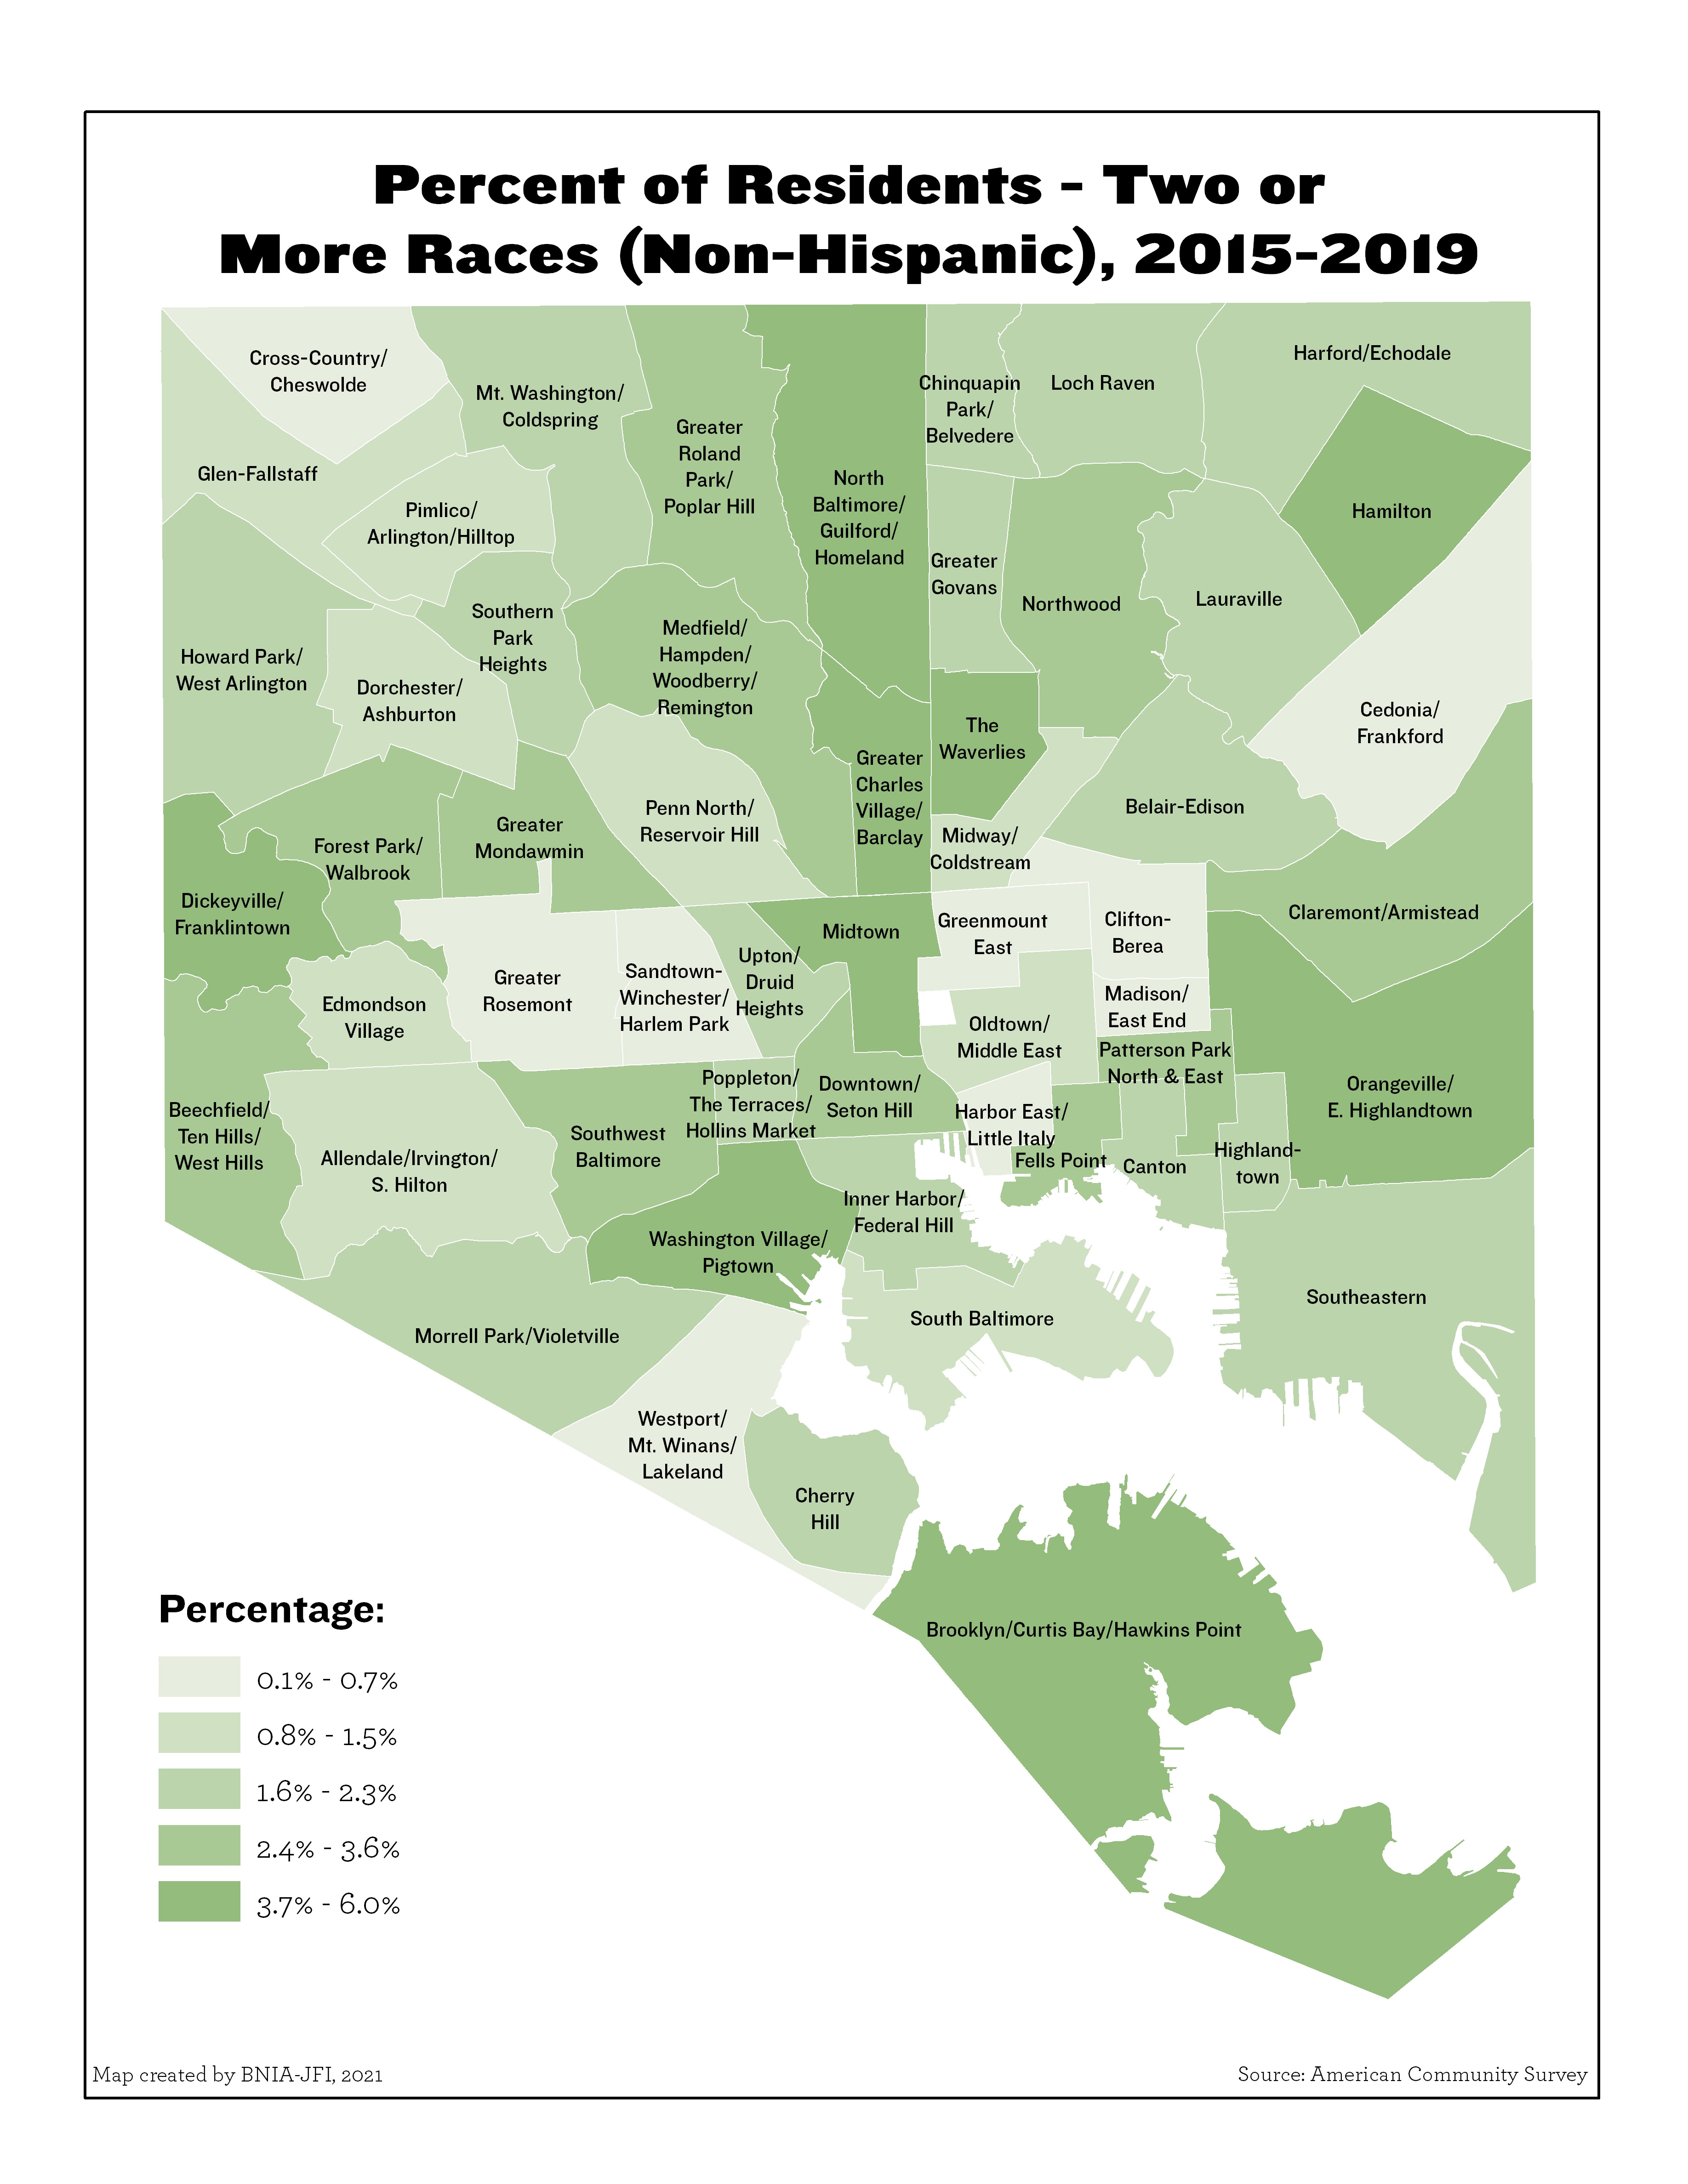
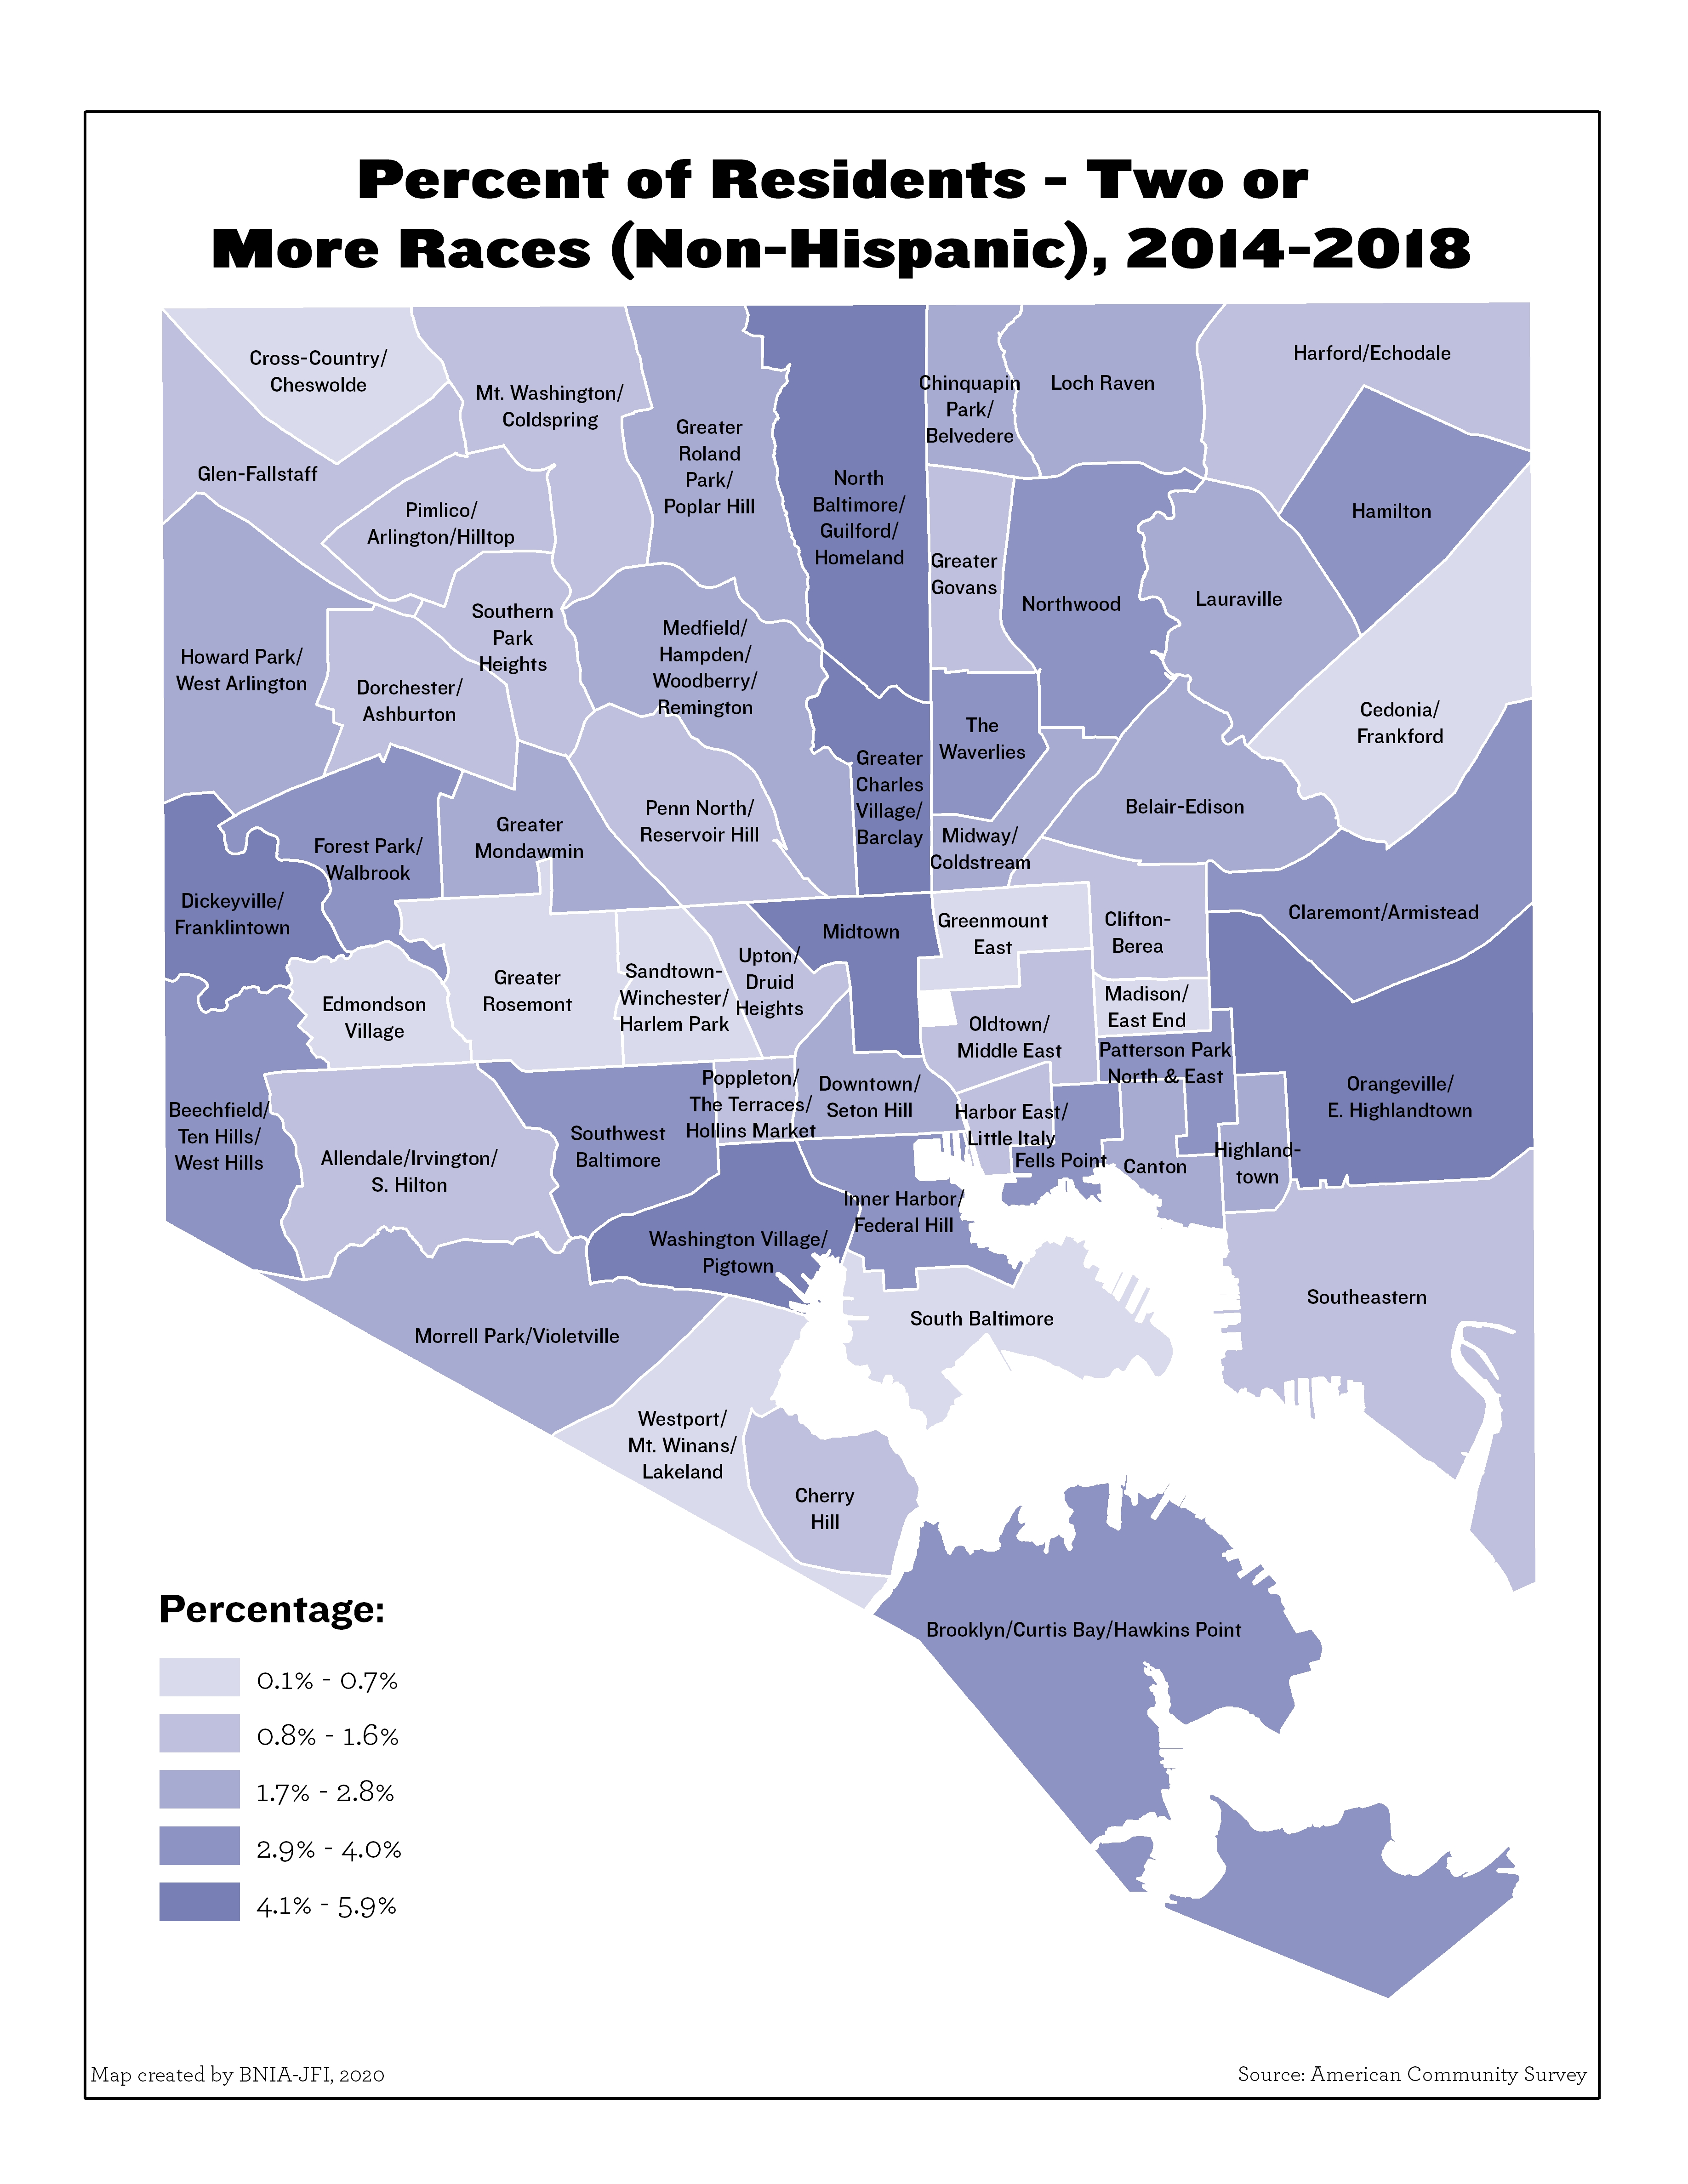
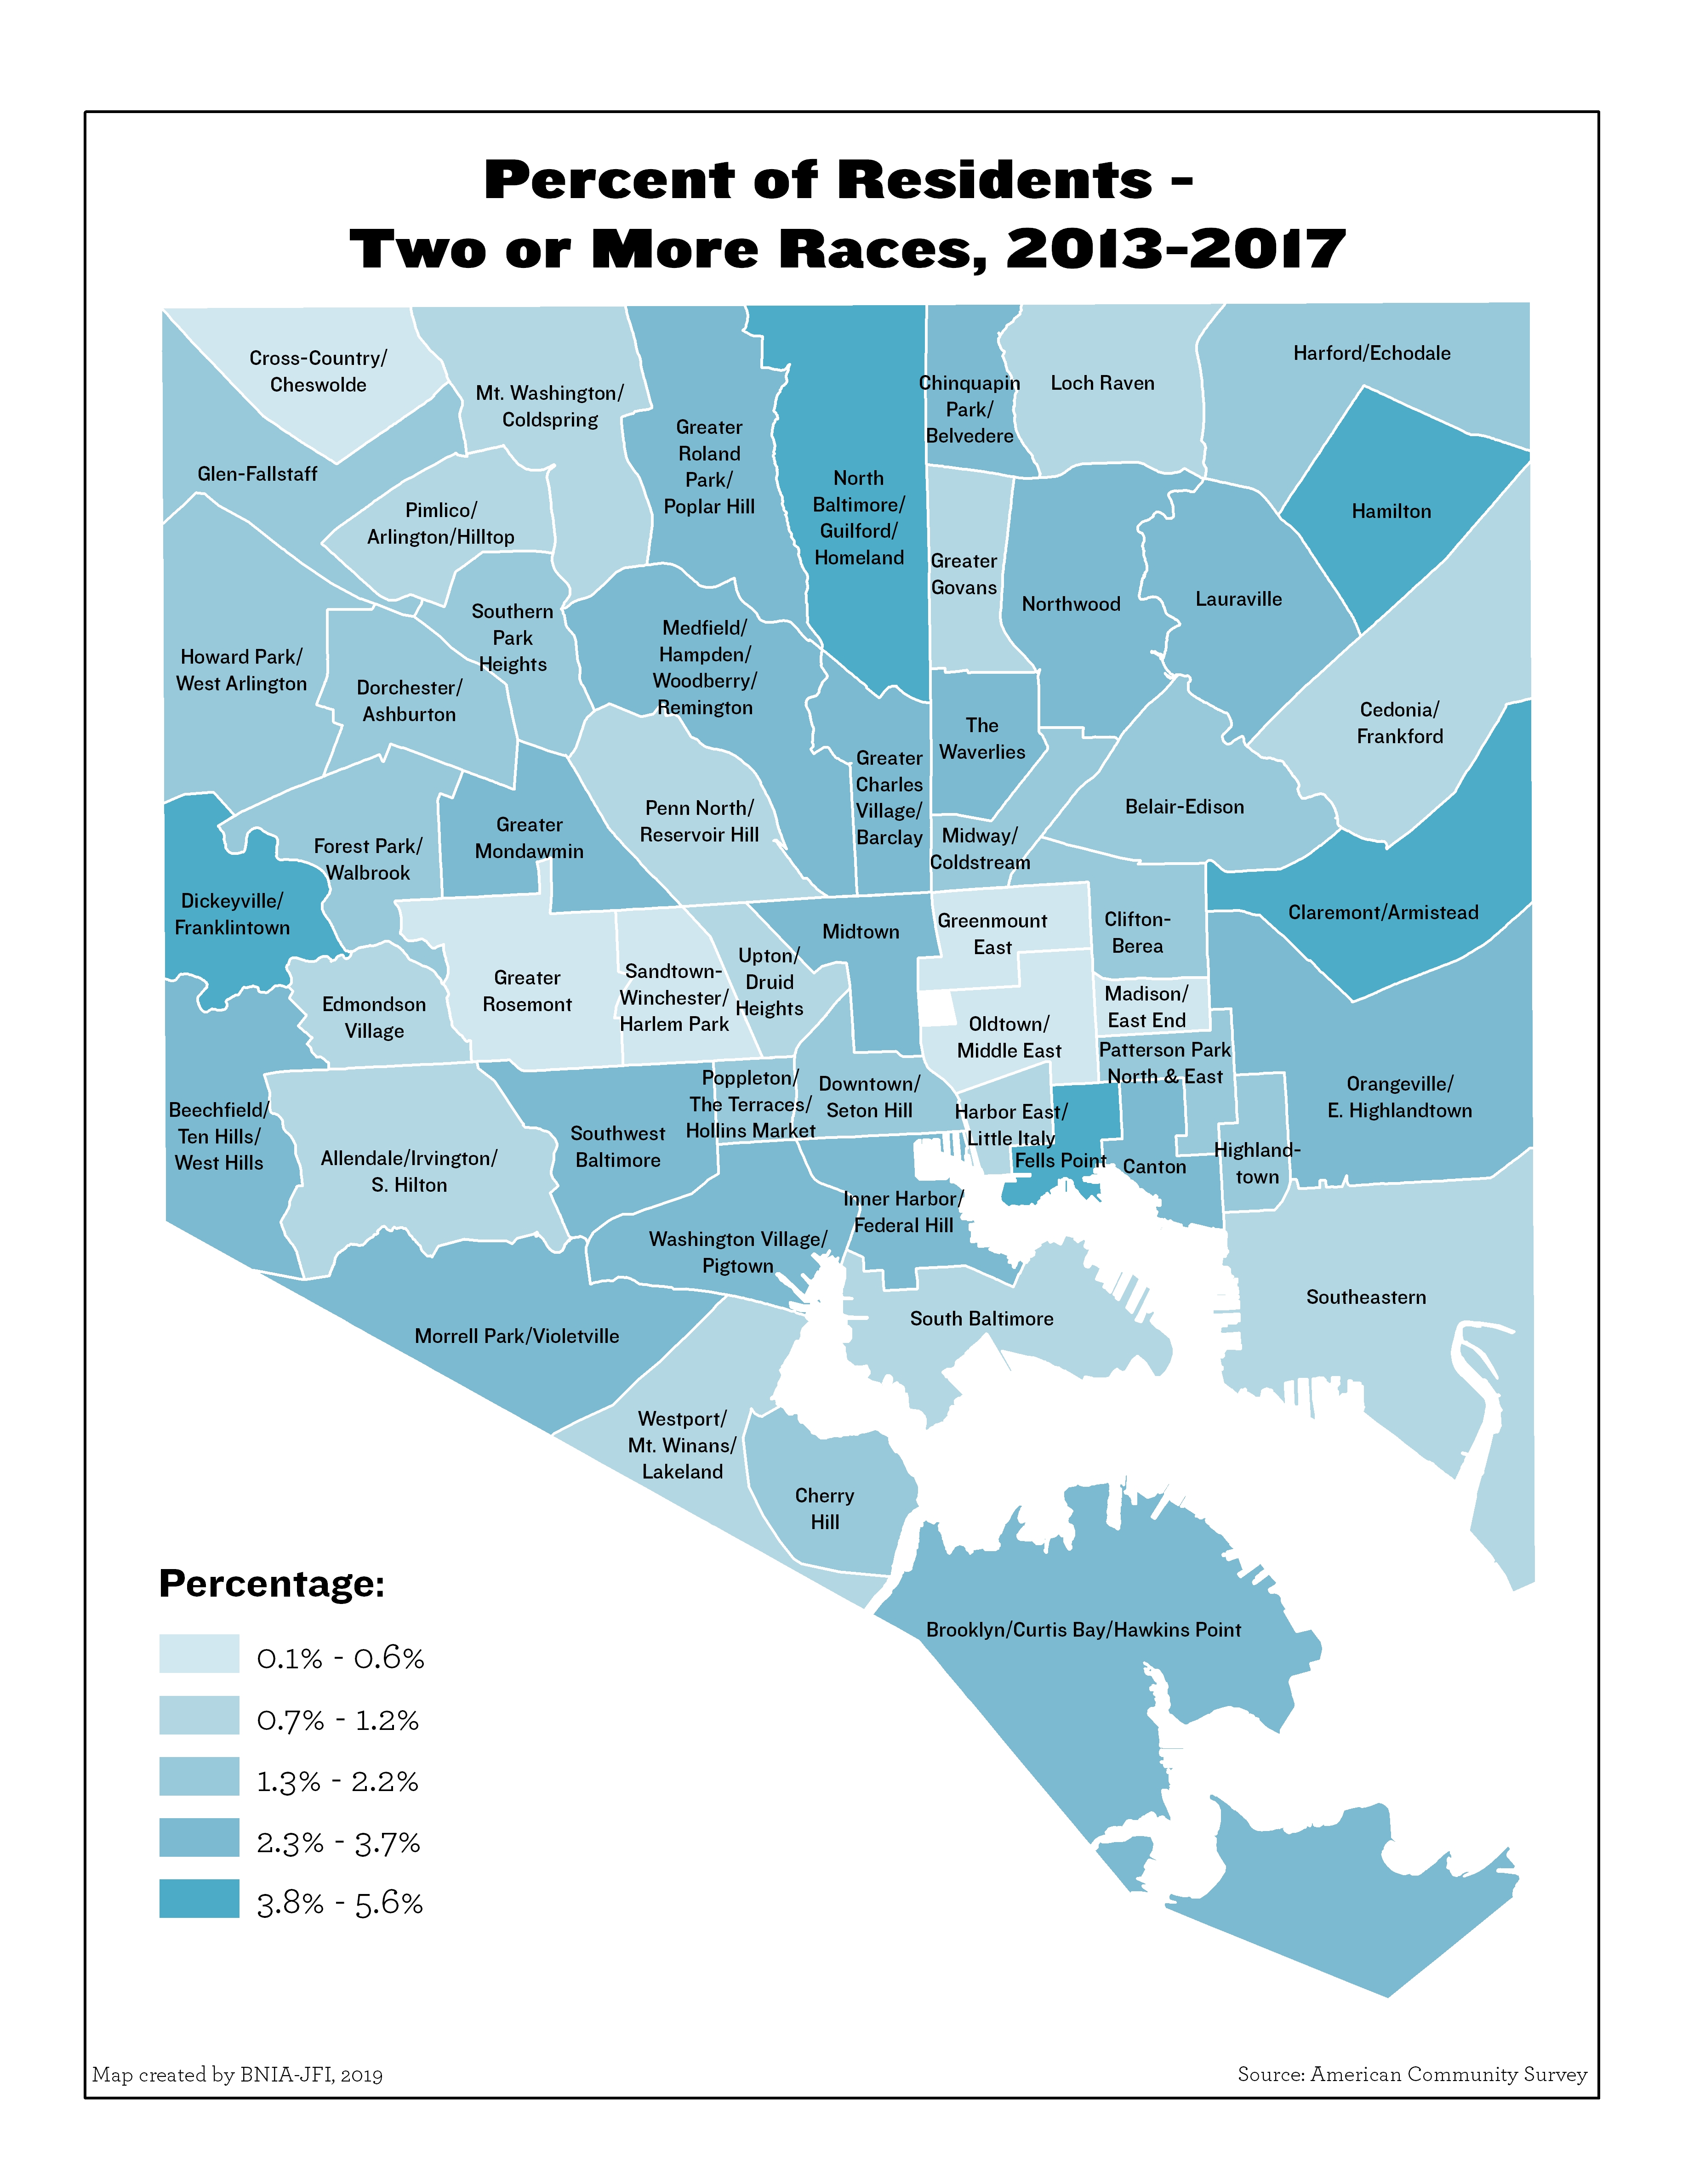
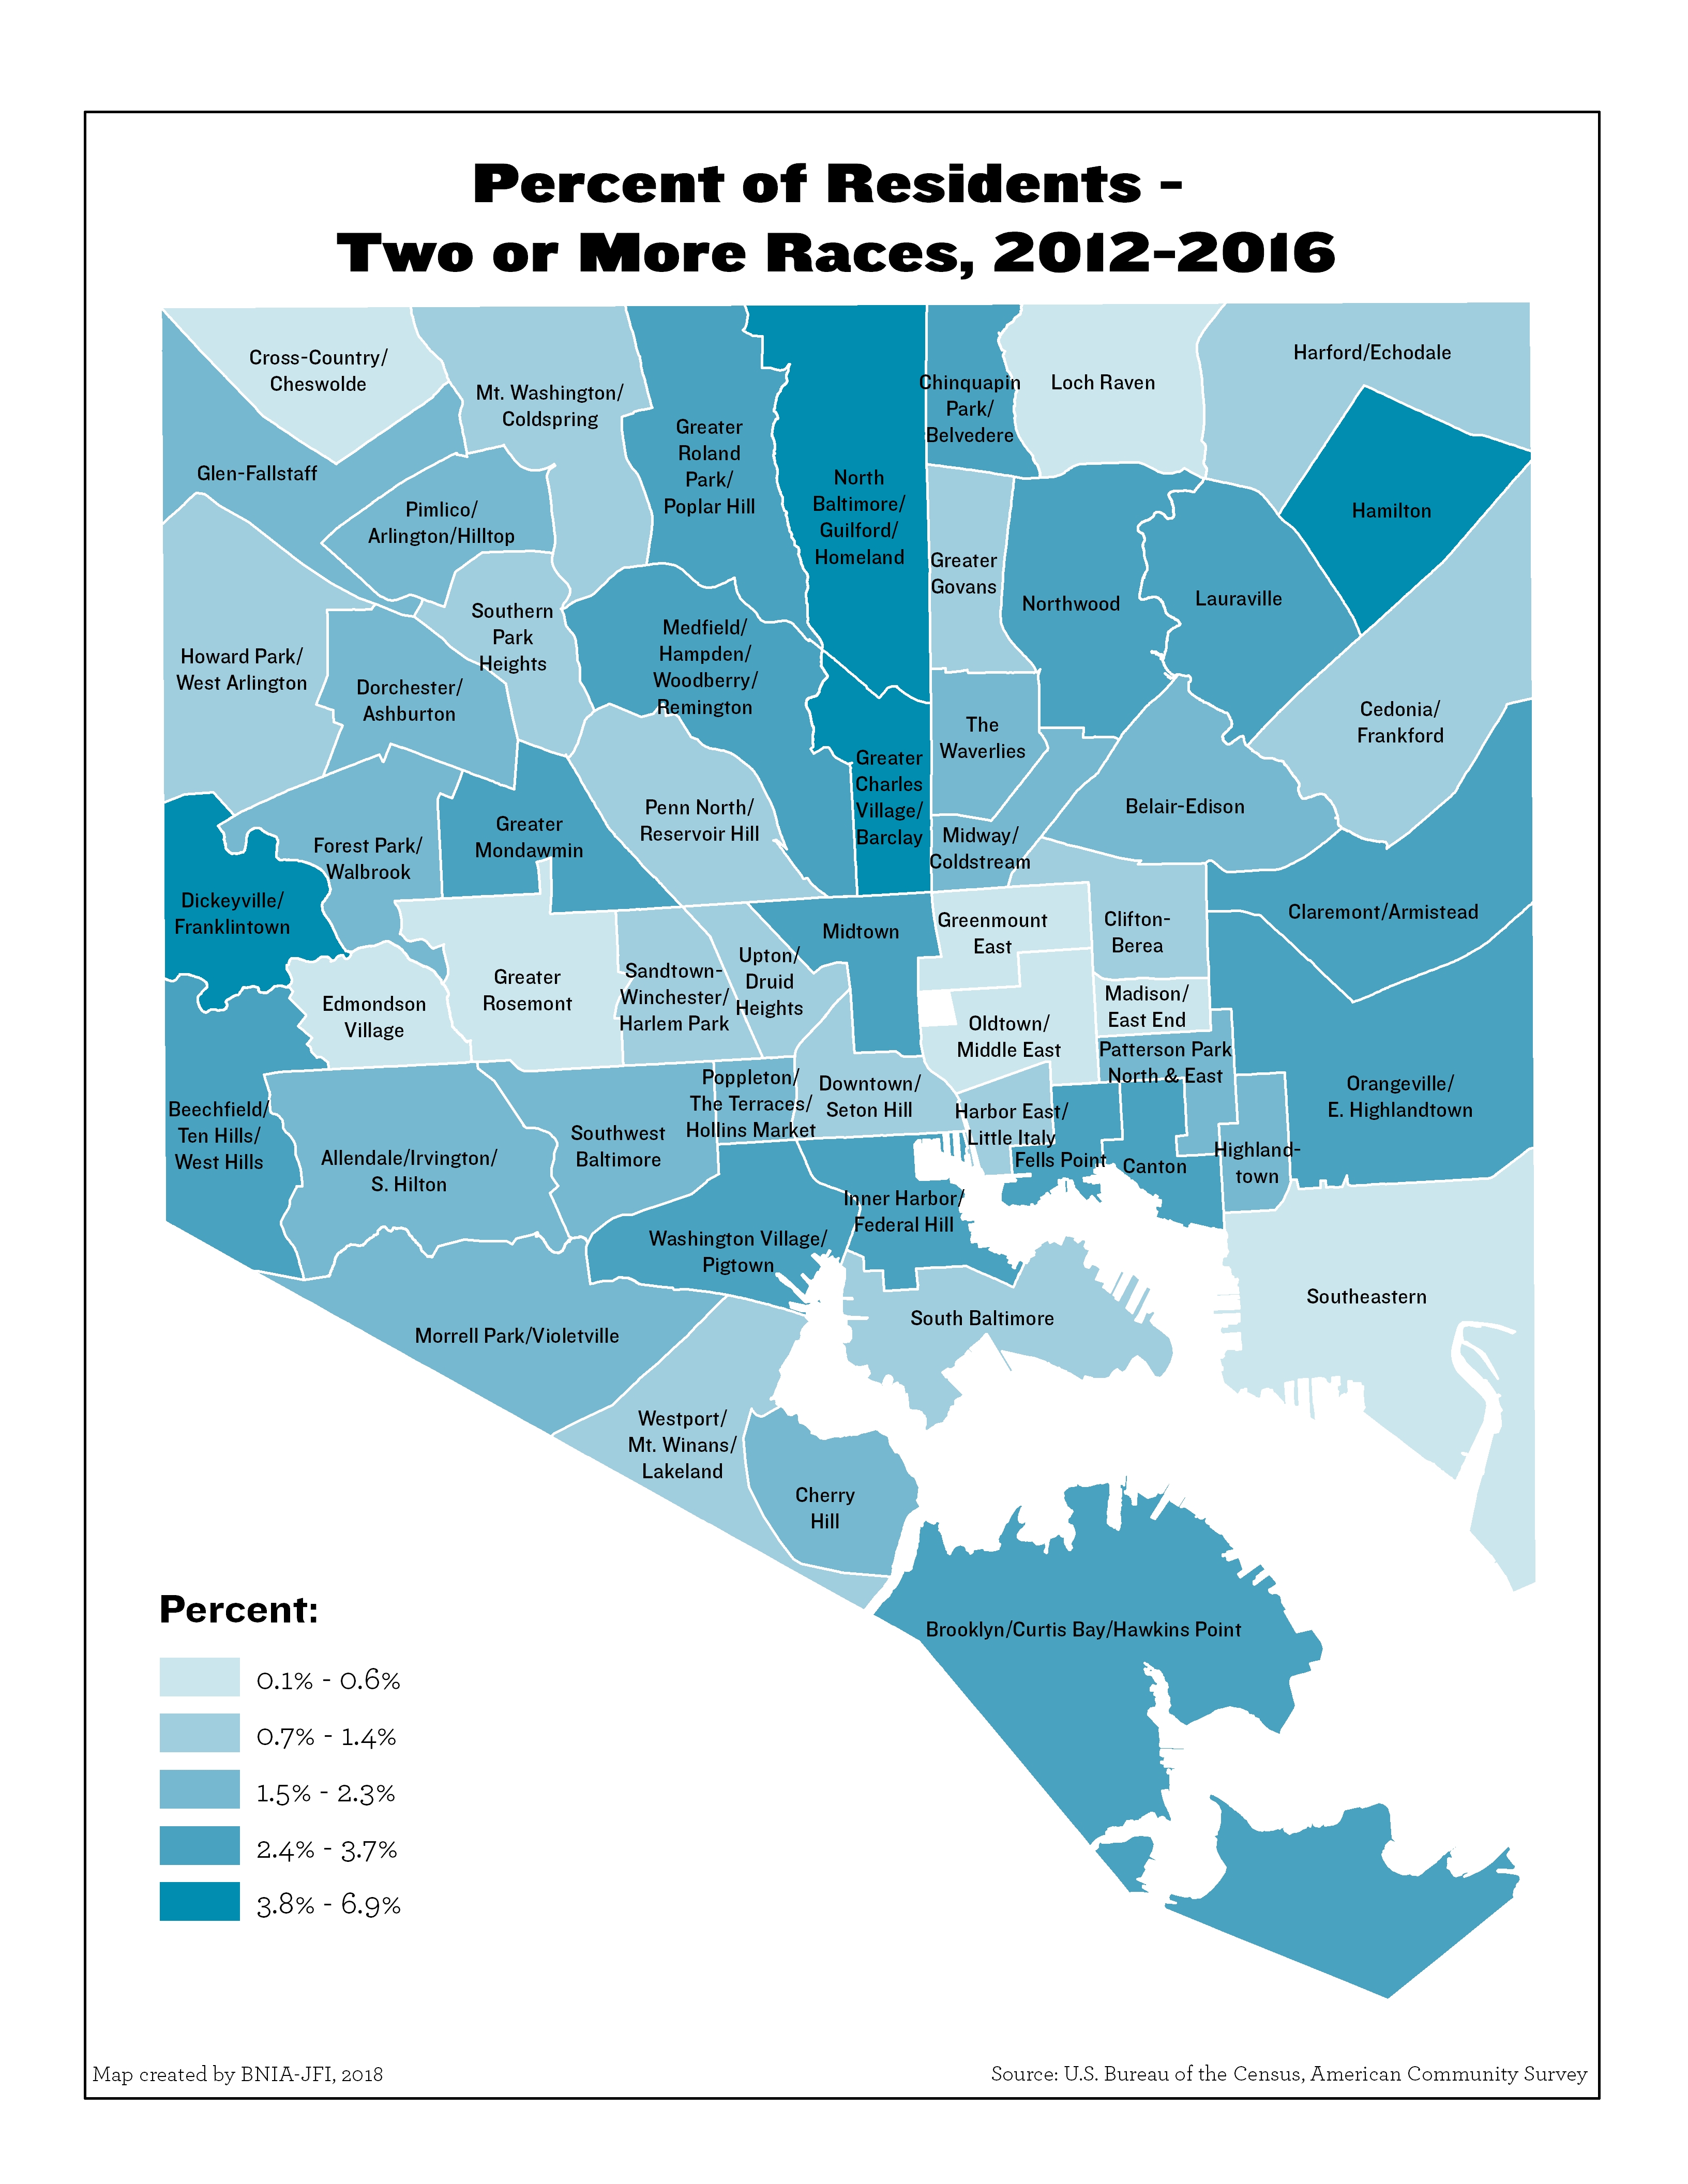
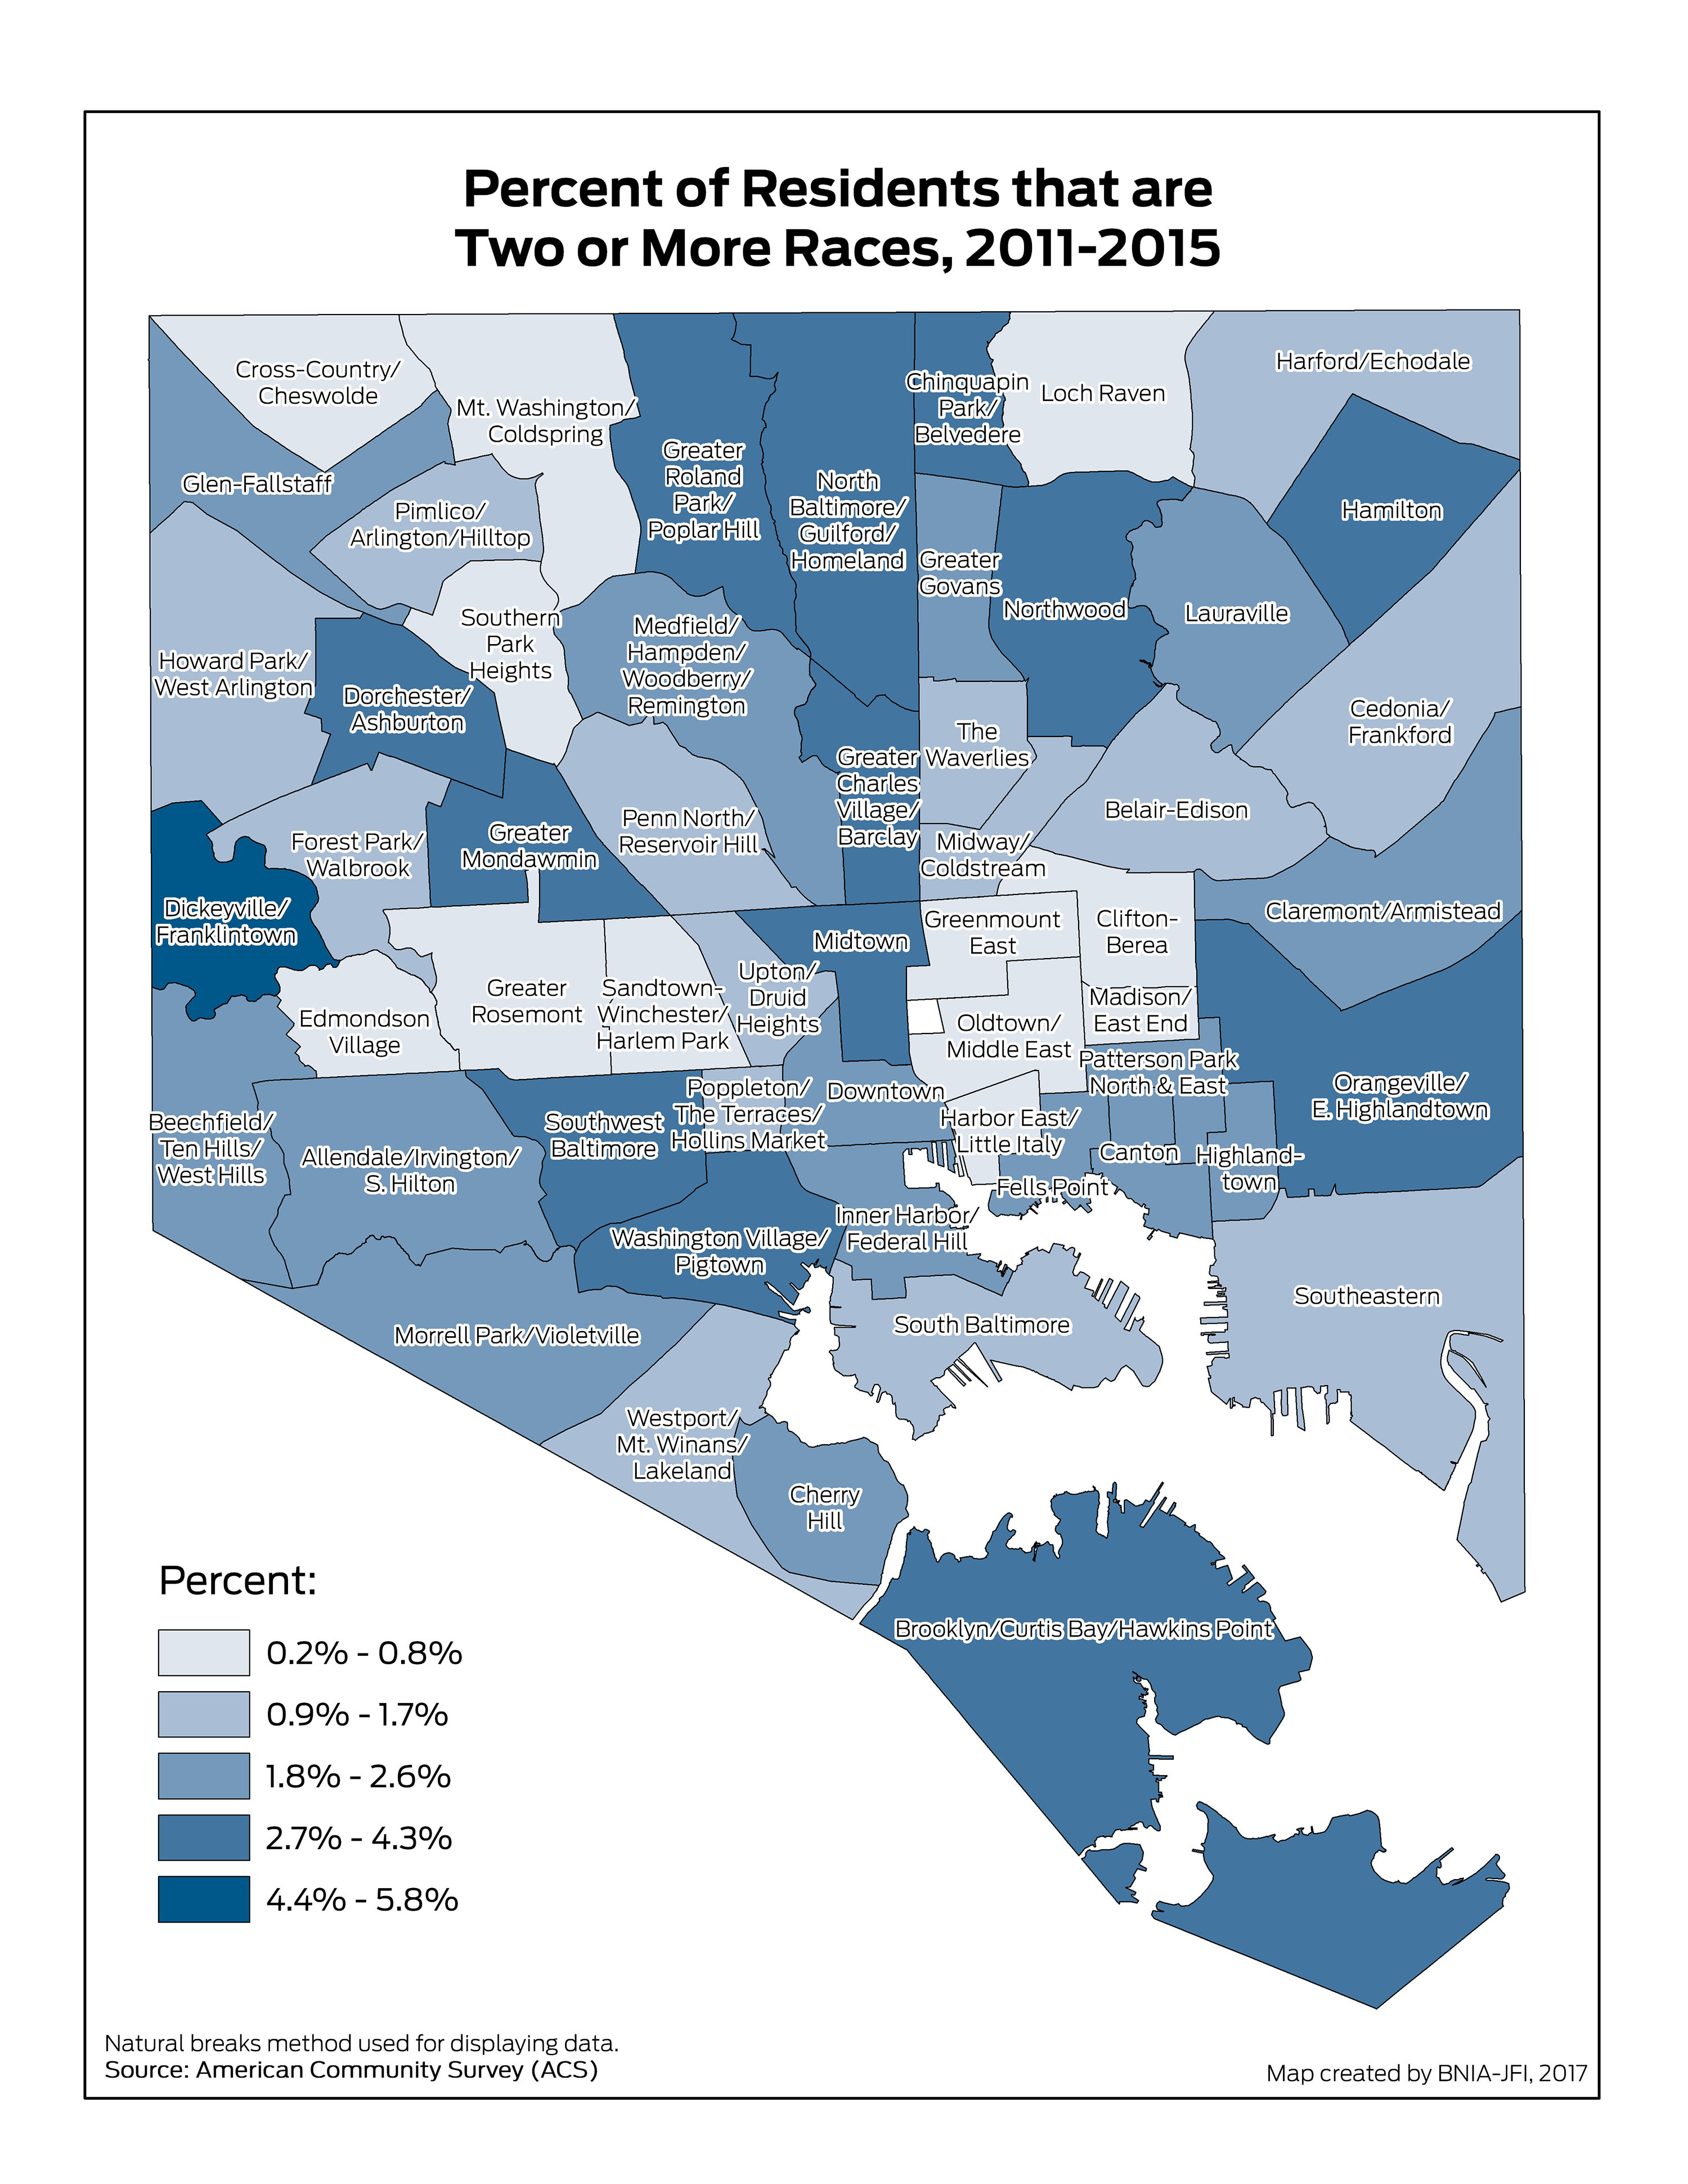
Percent of Residents – Two or More Races (Non-Hispanic)
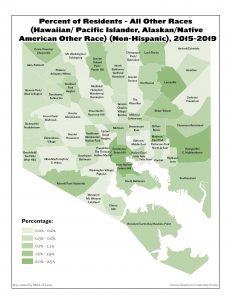
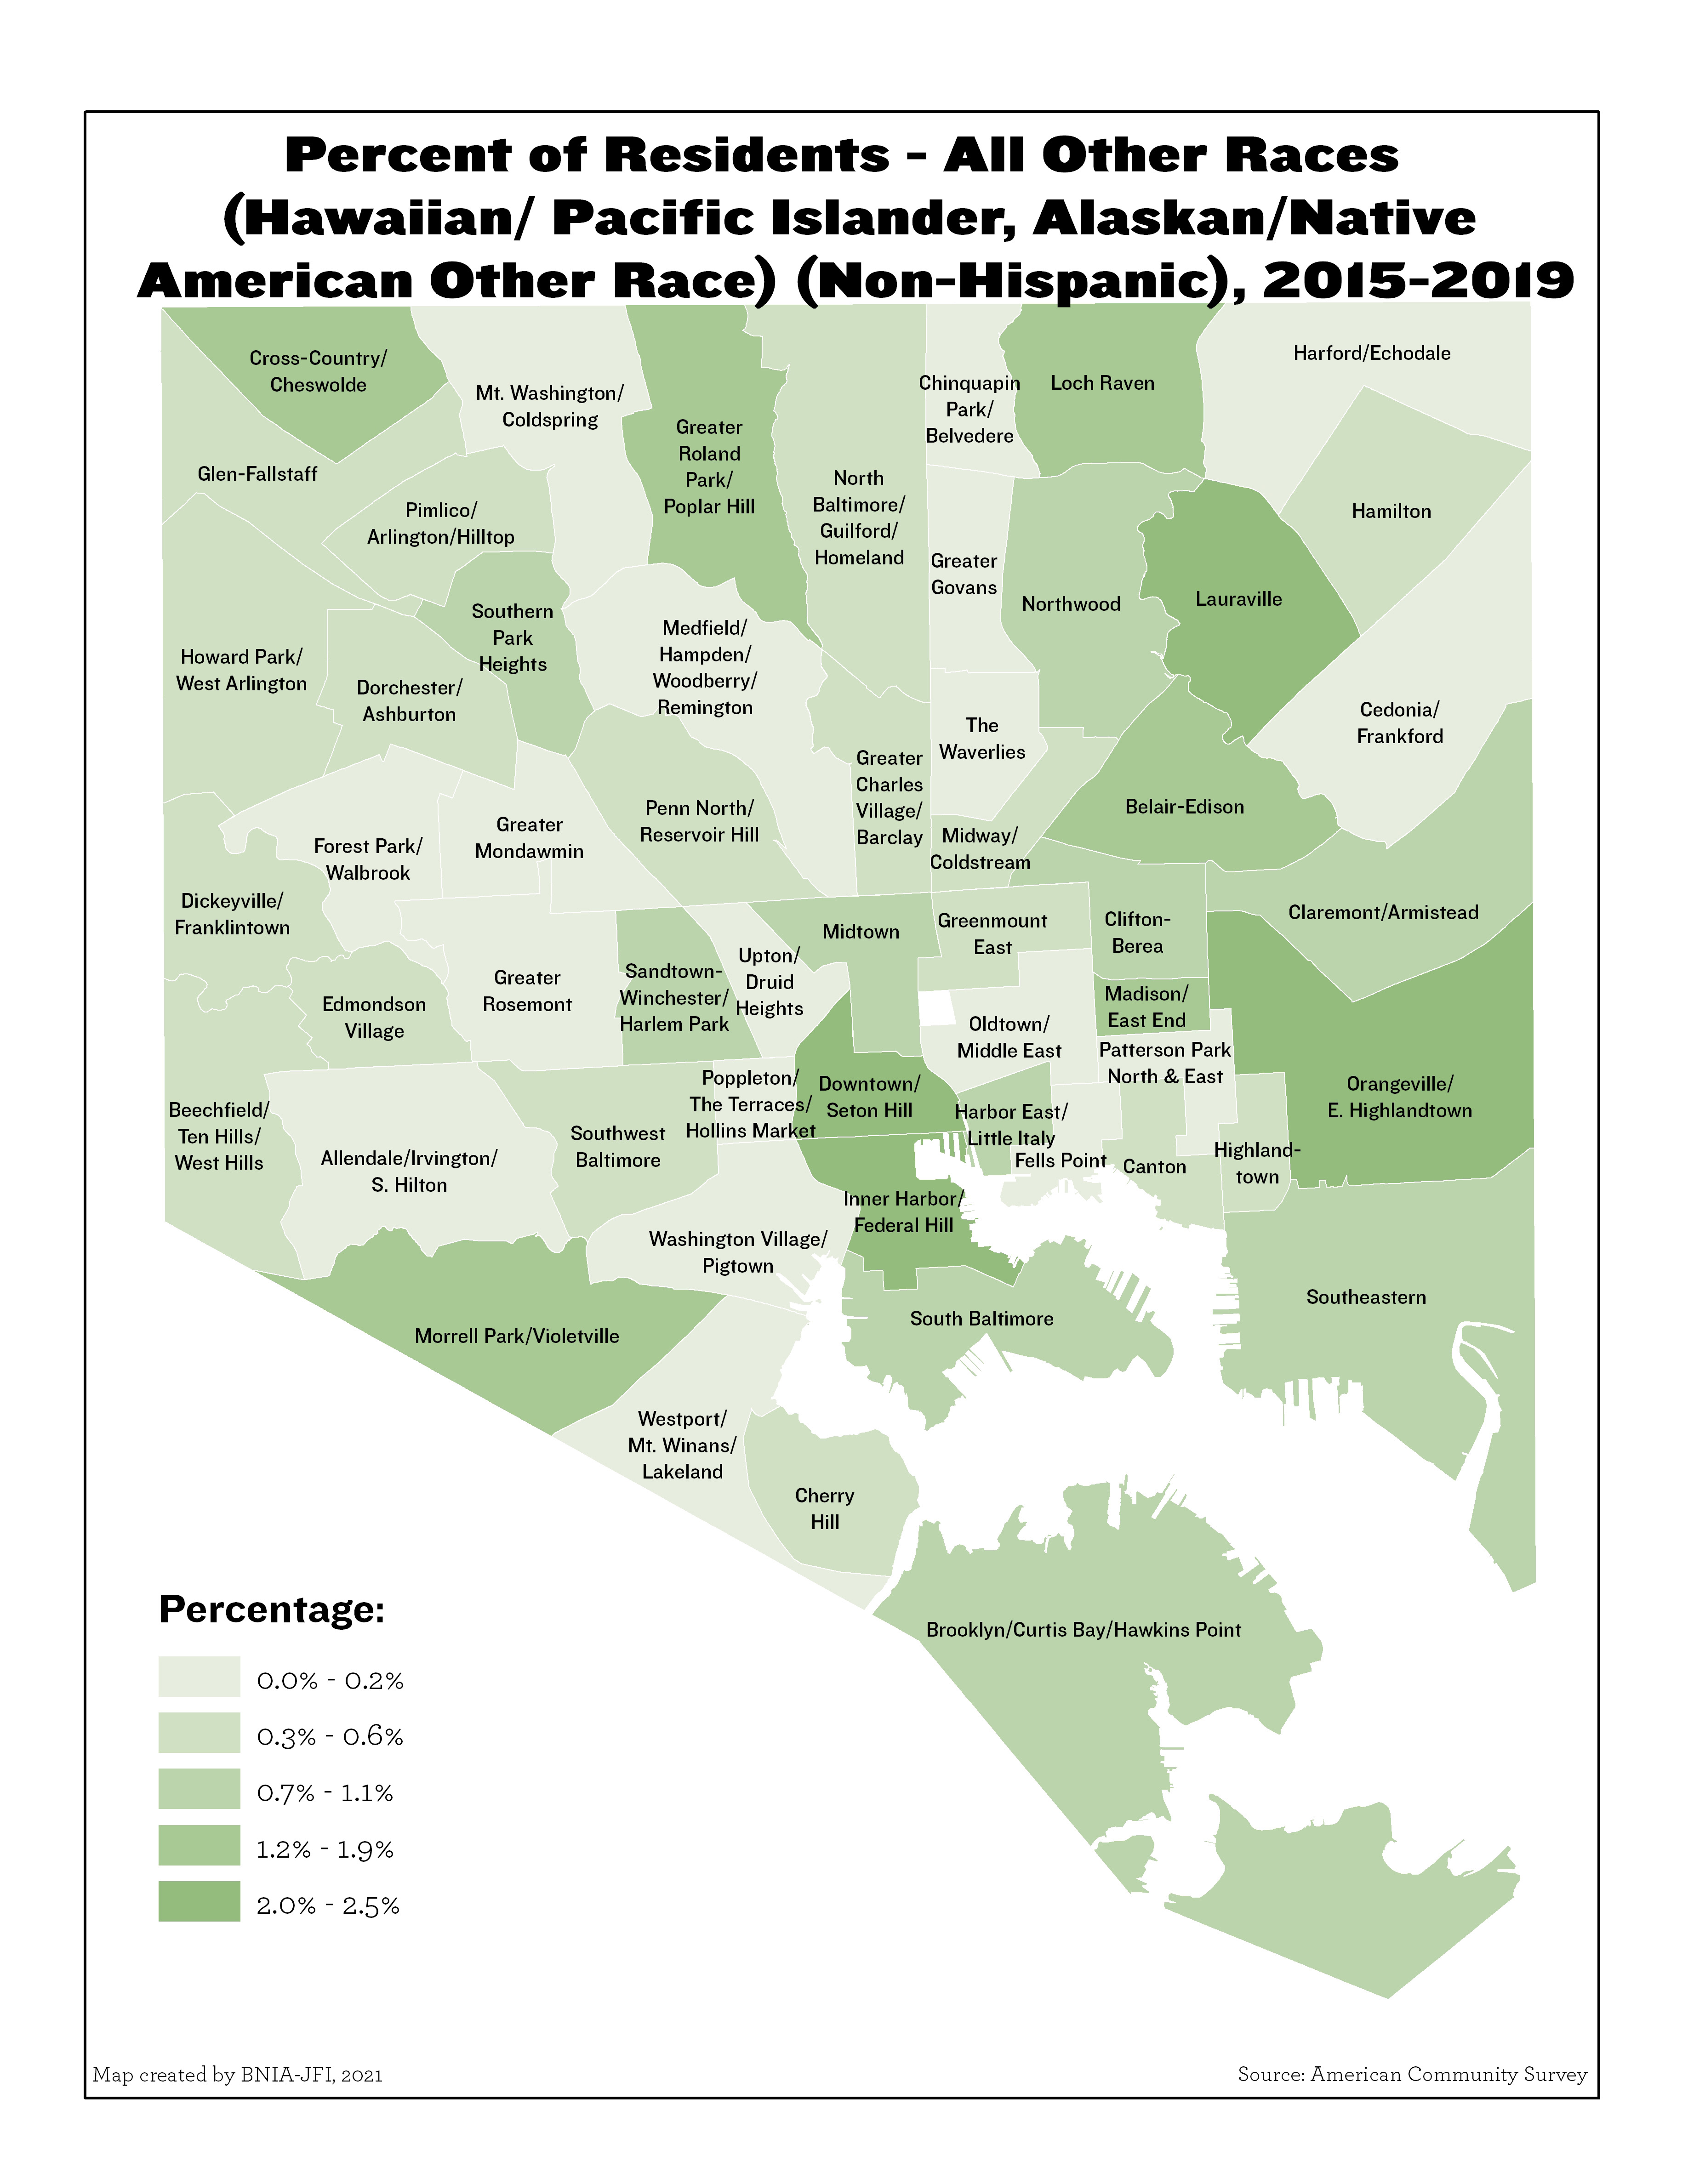
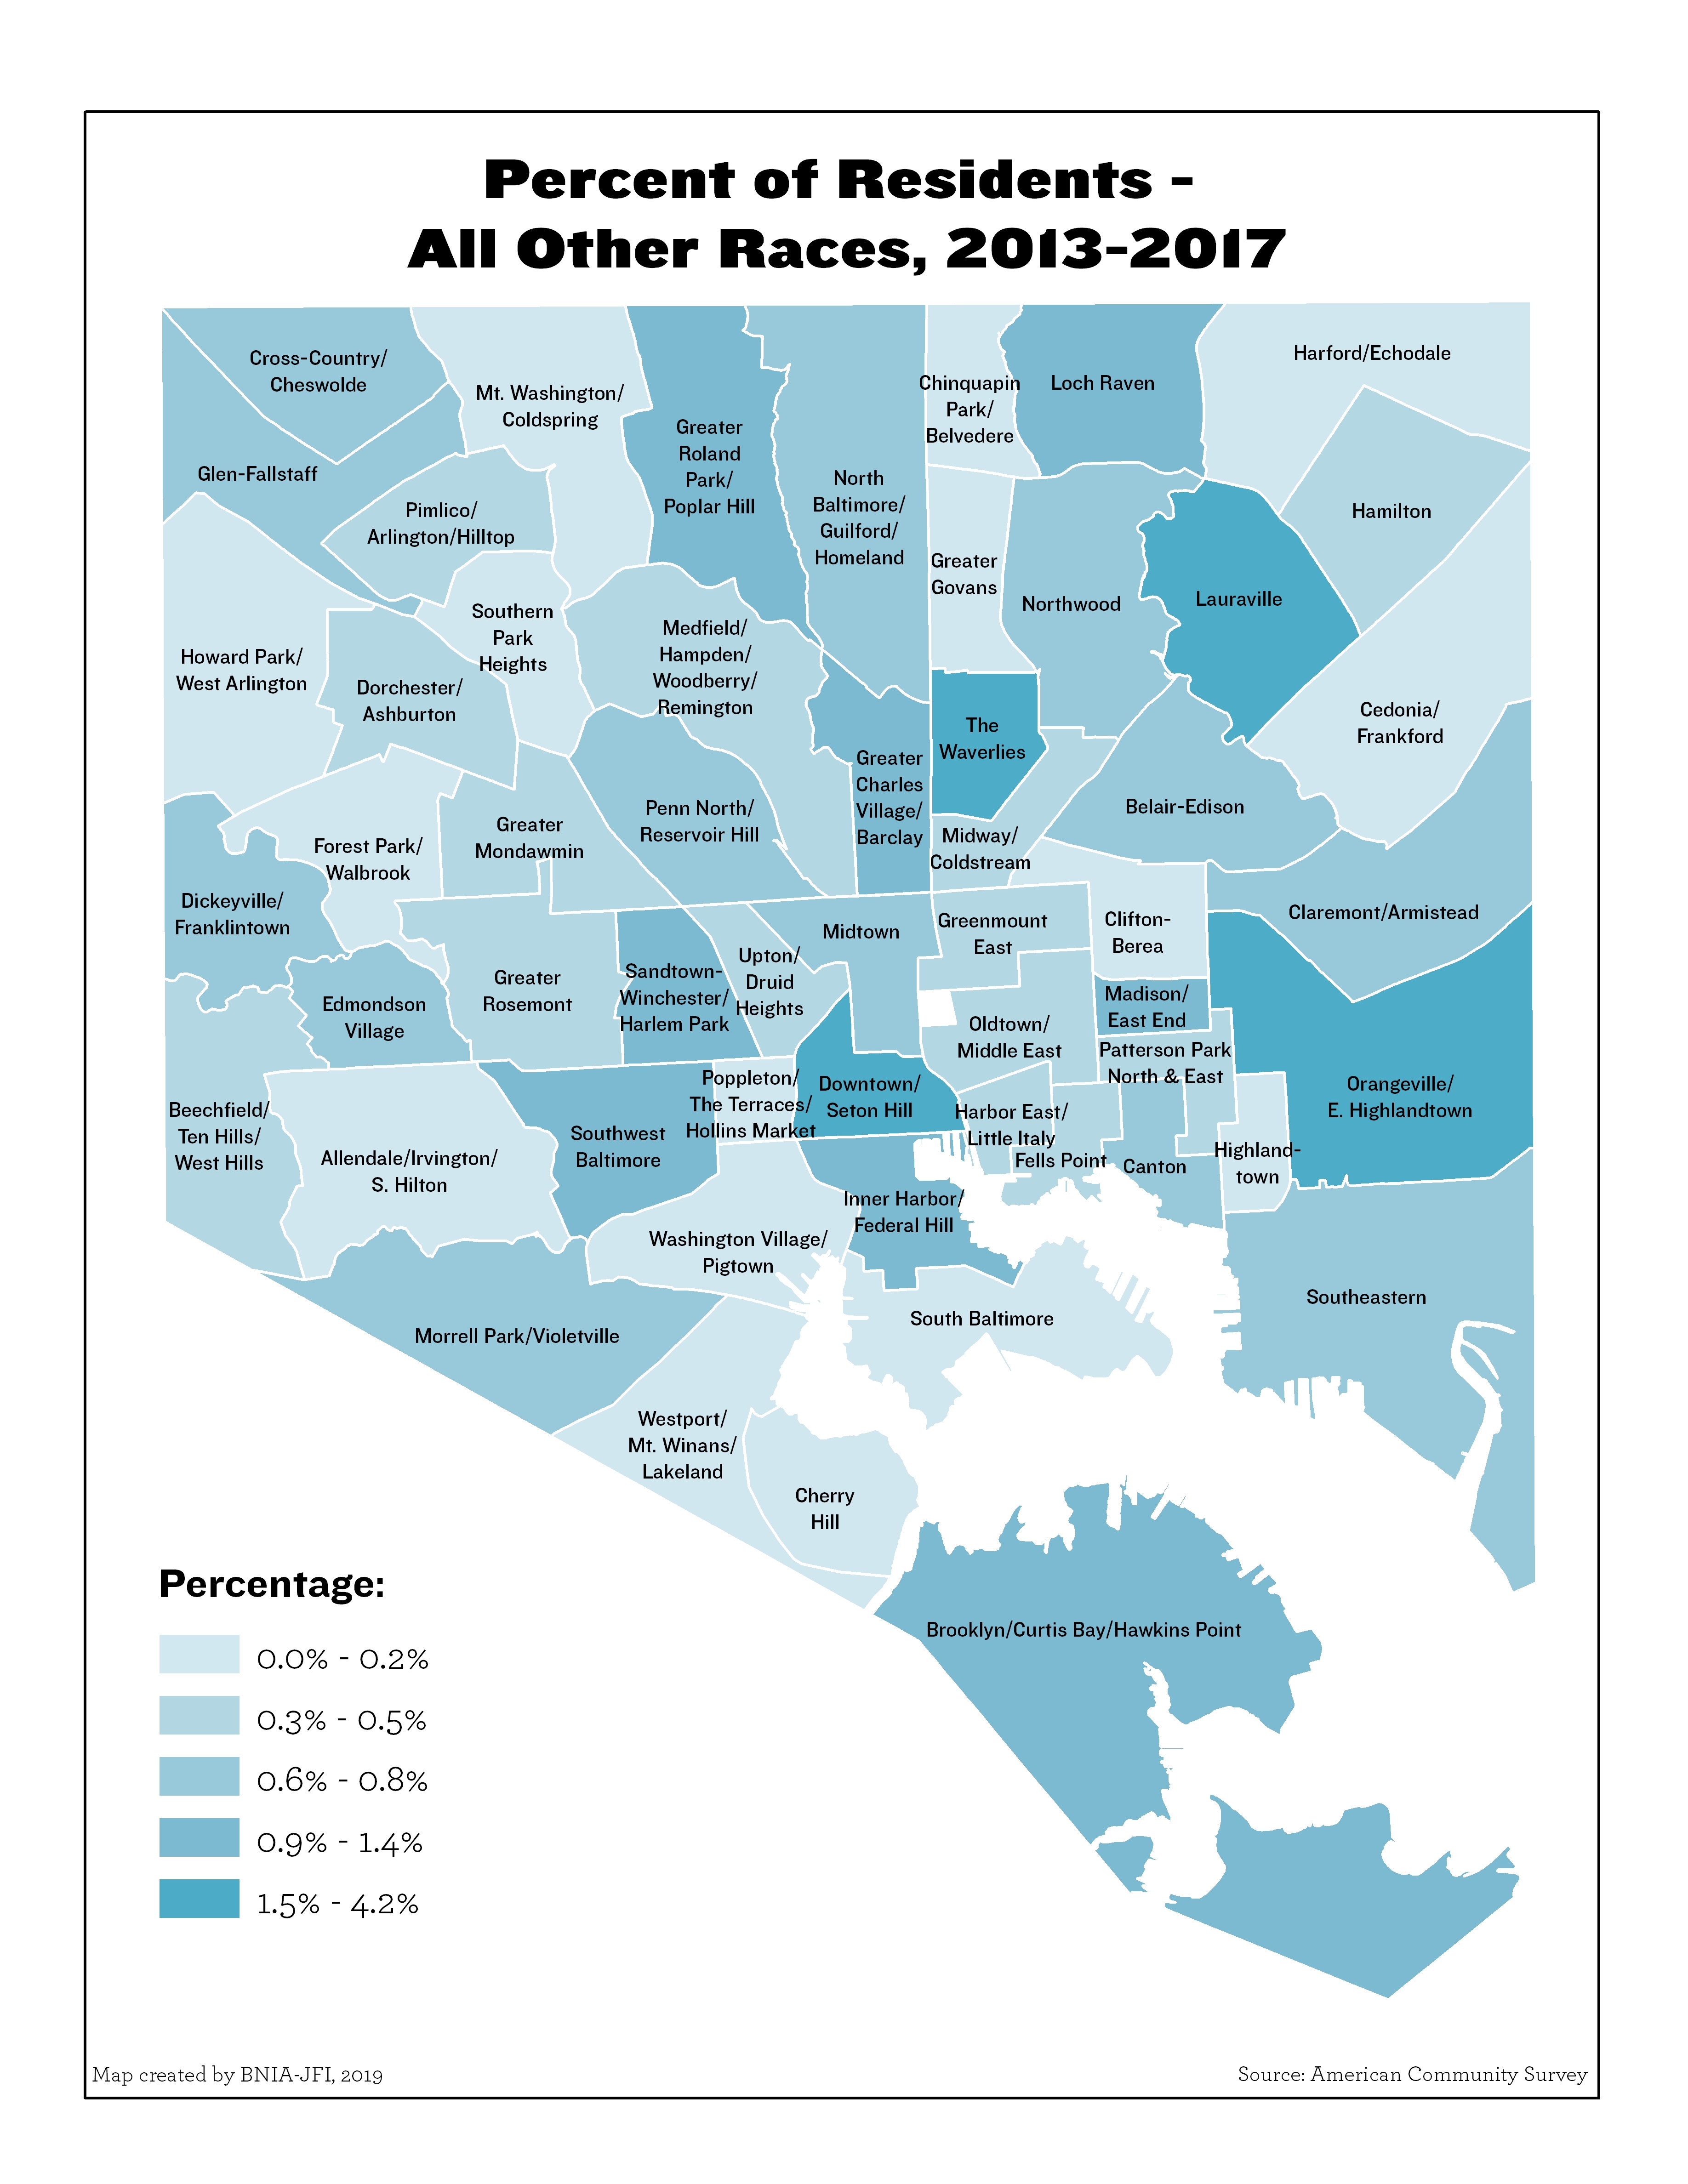
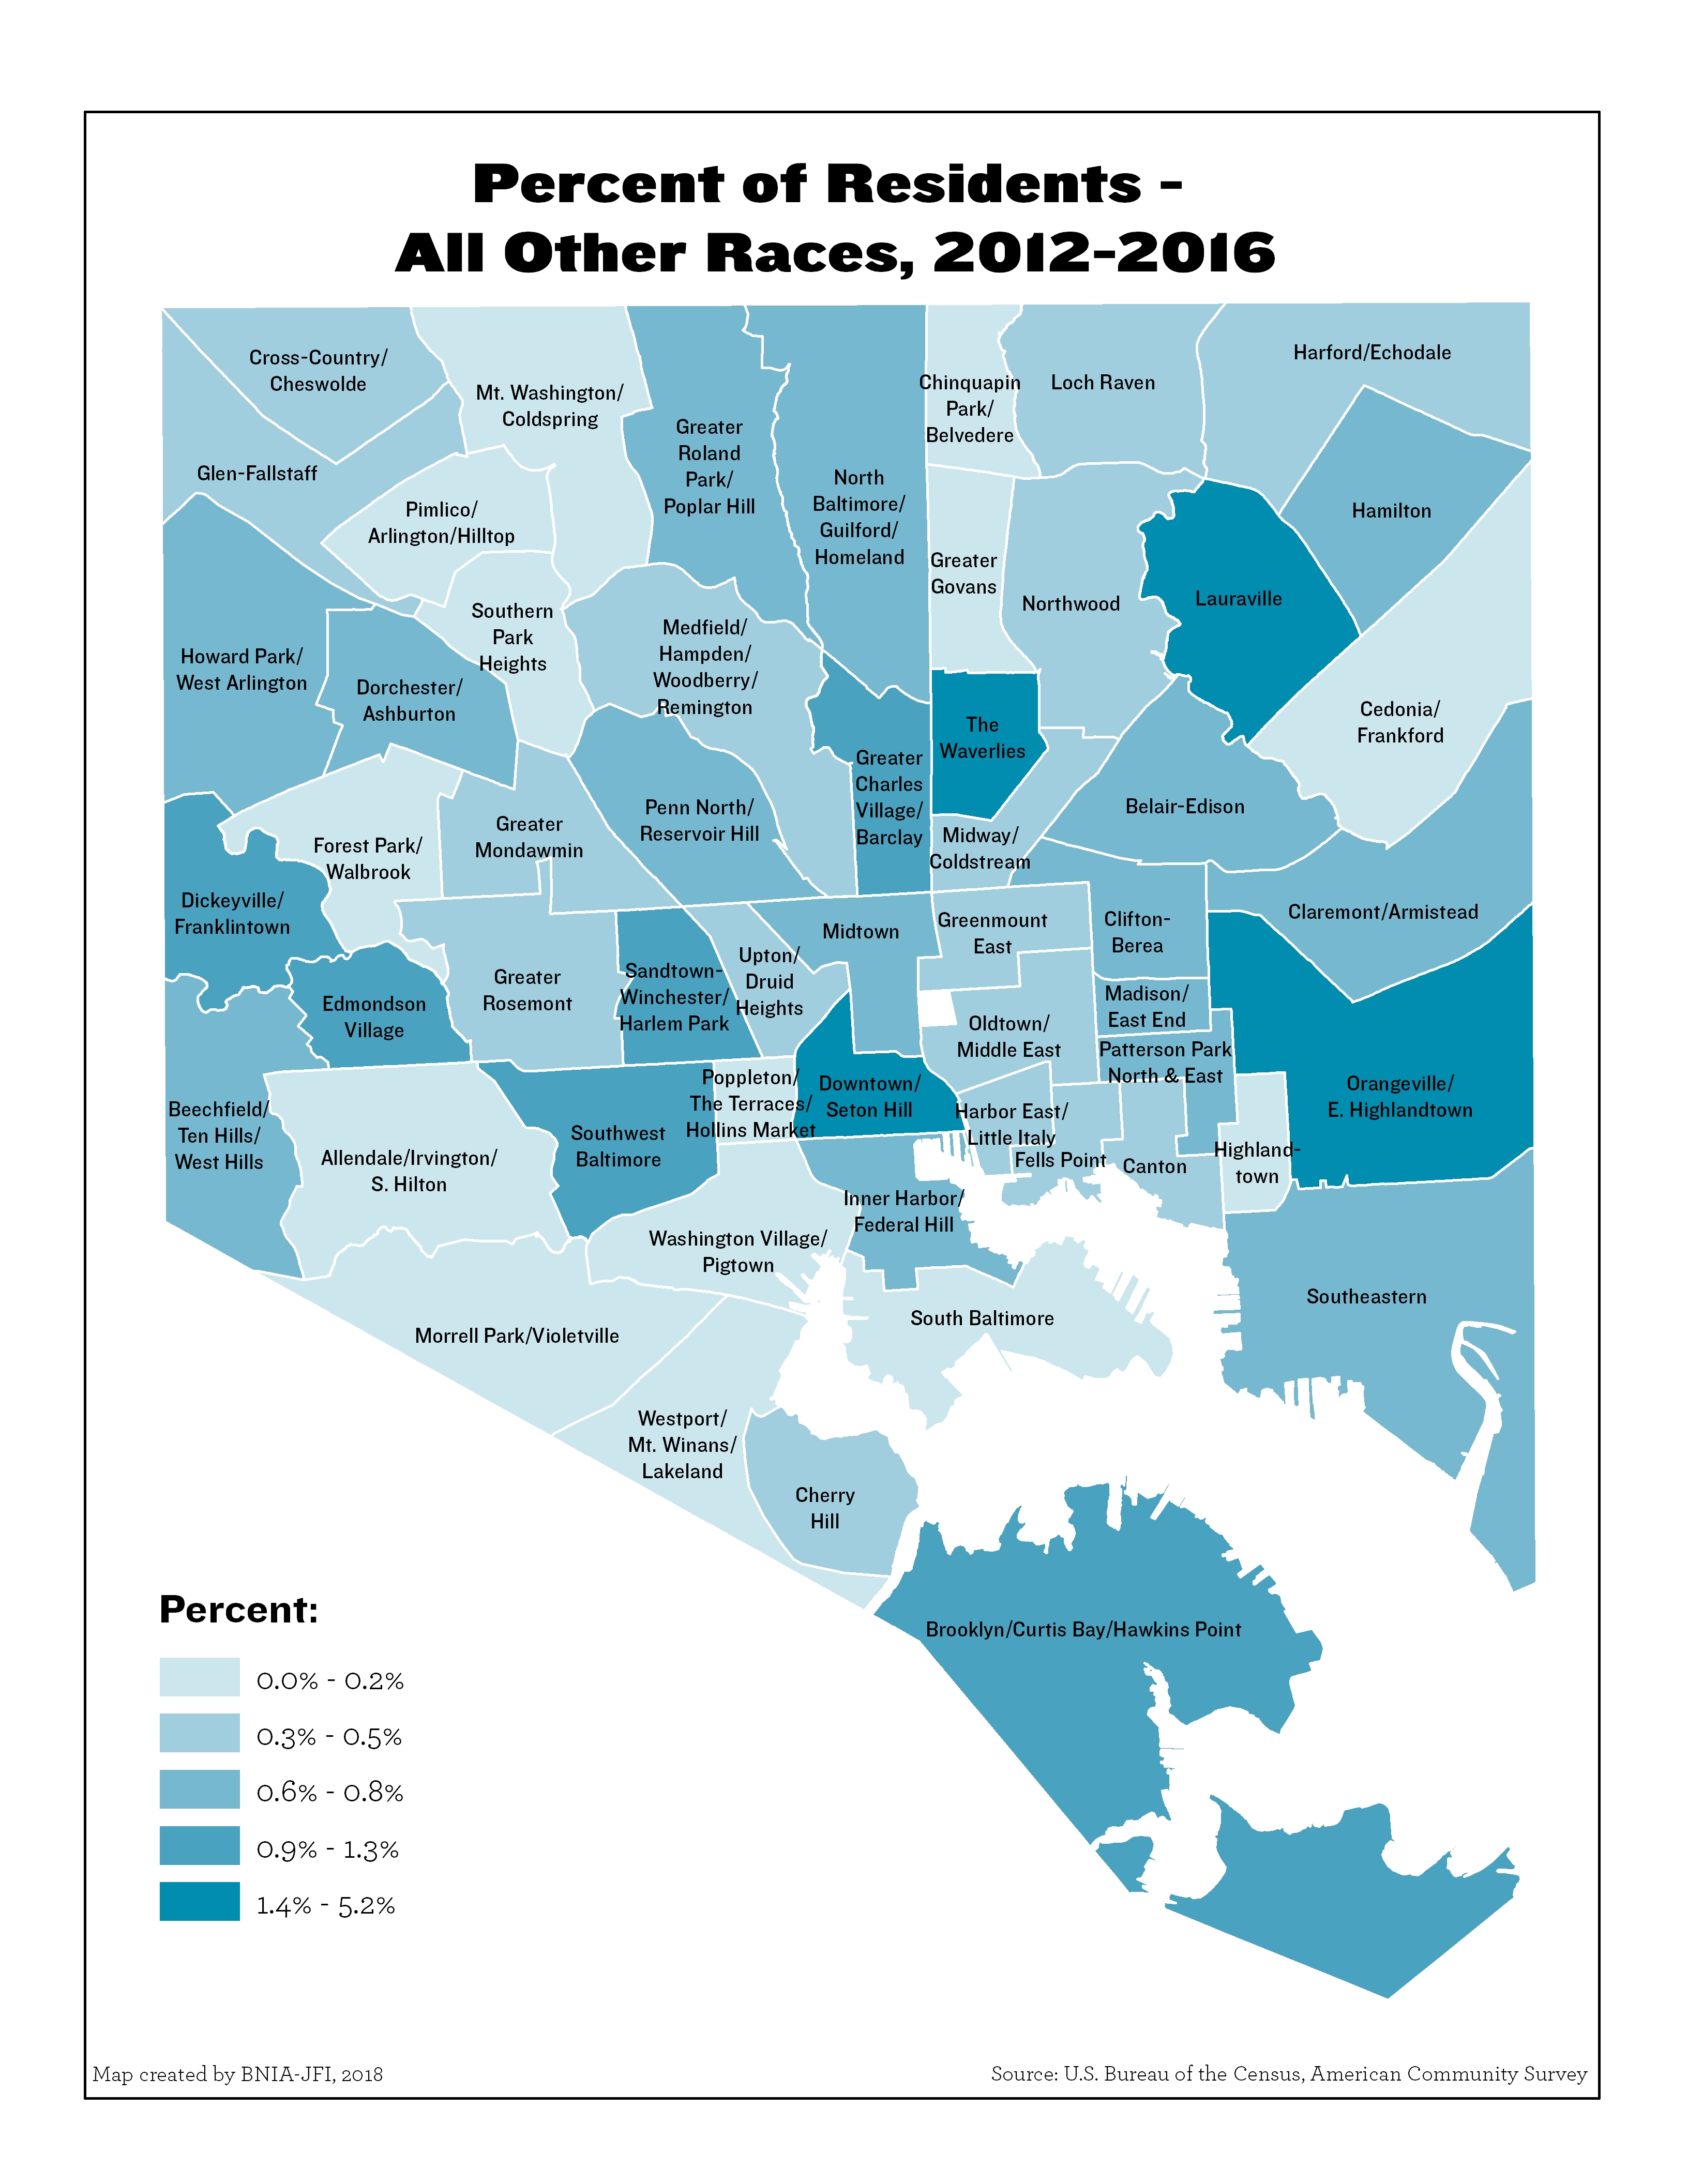
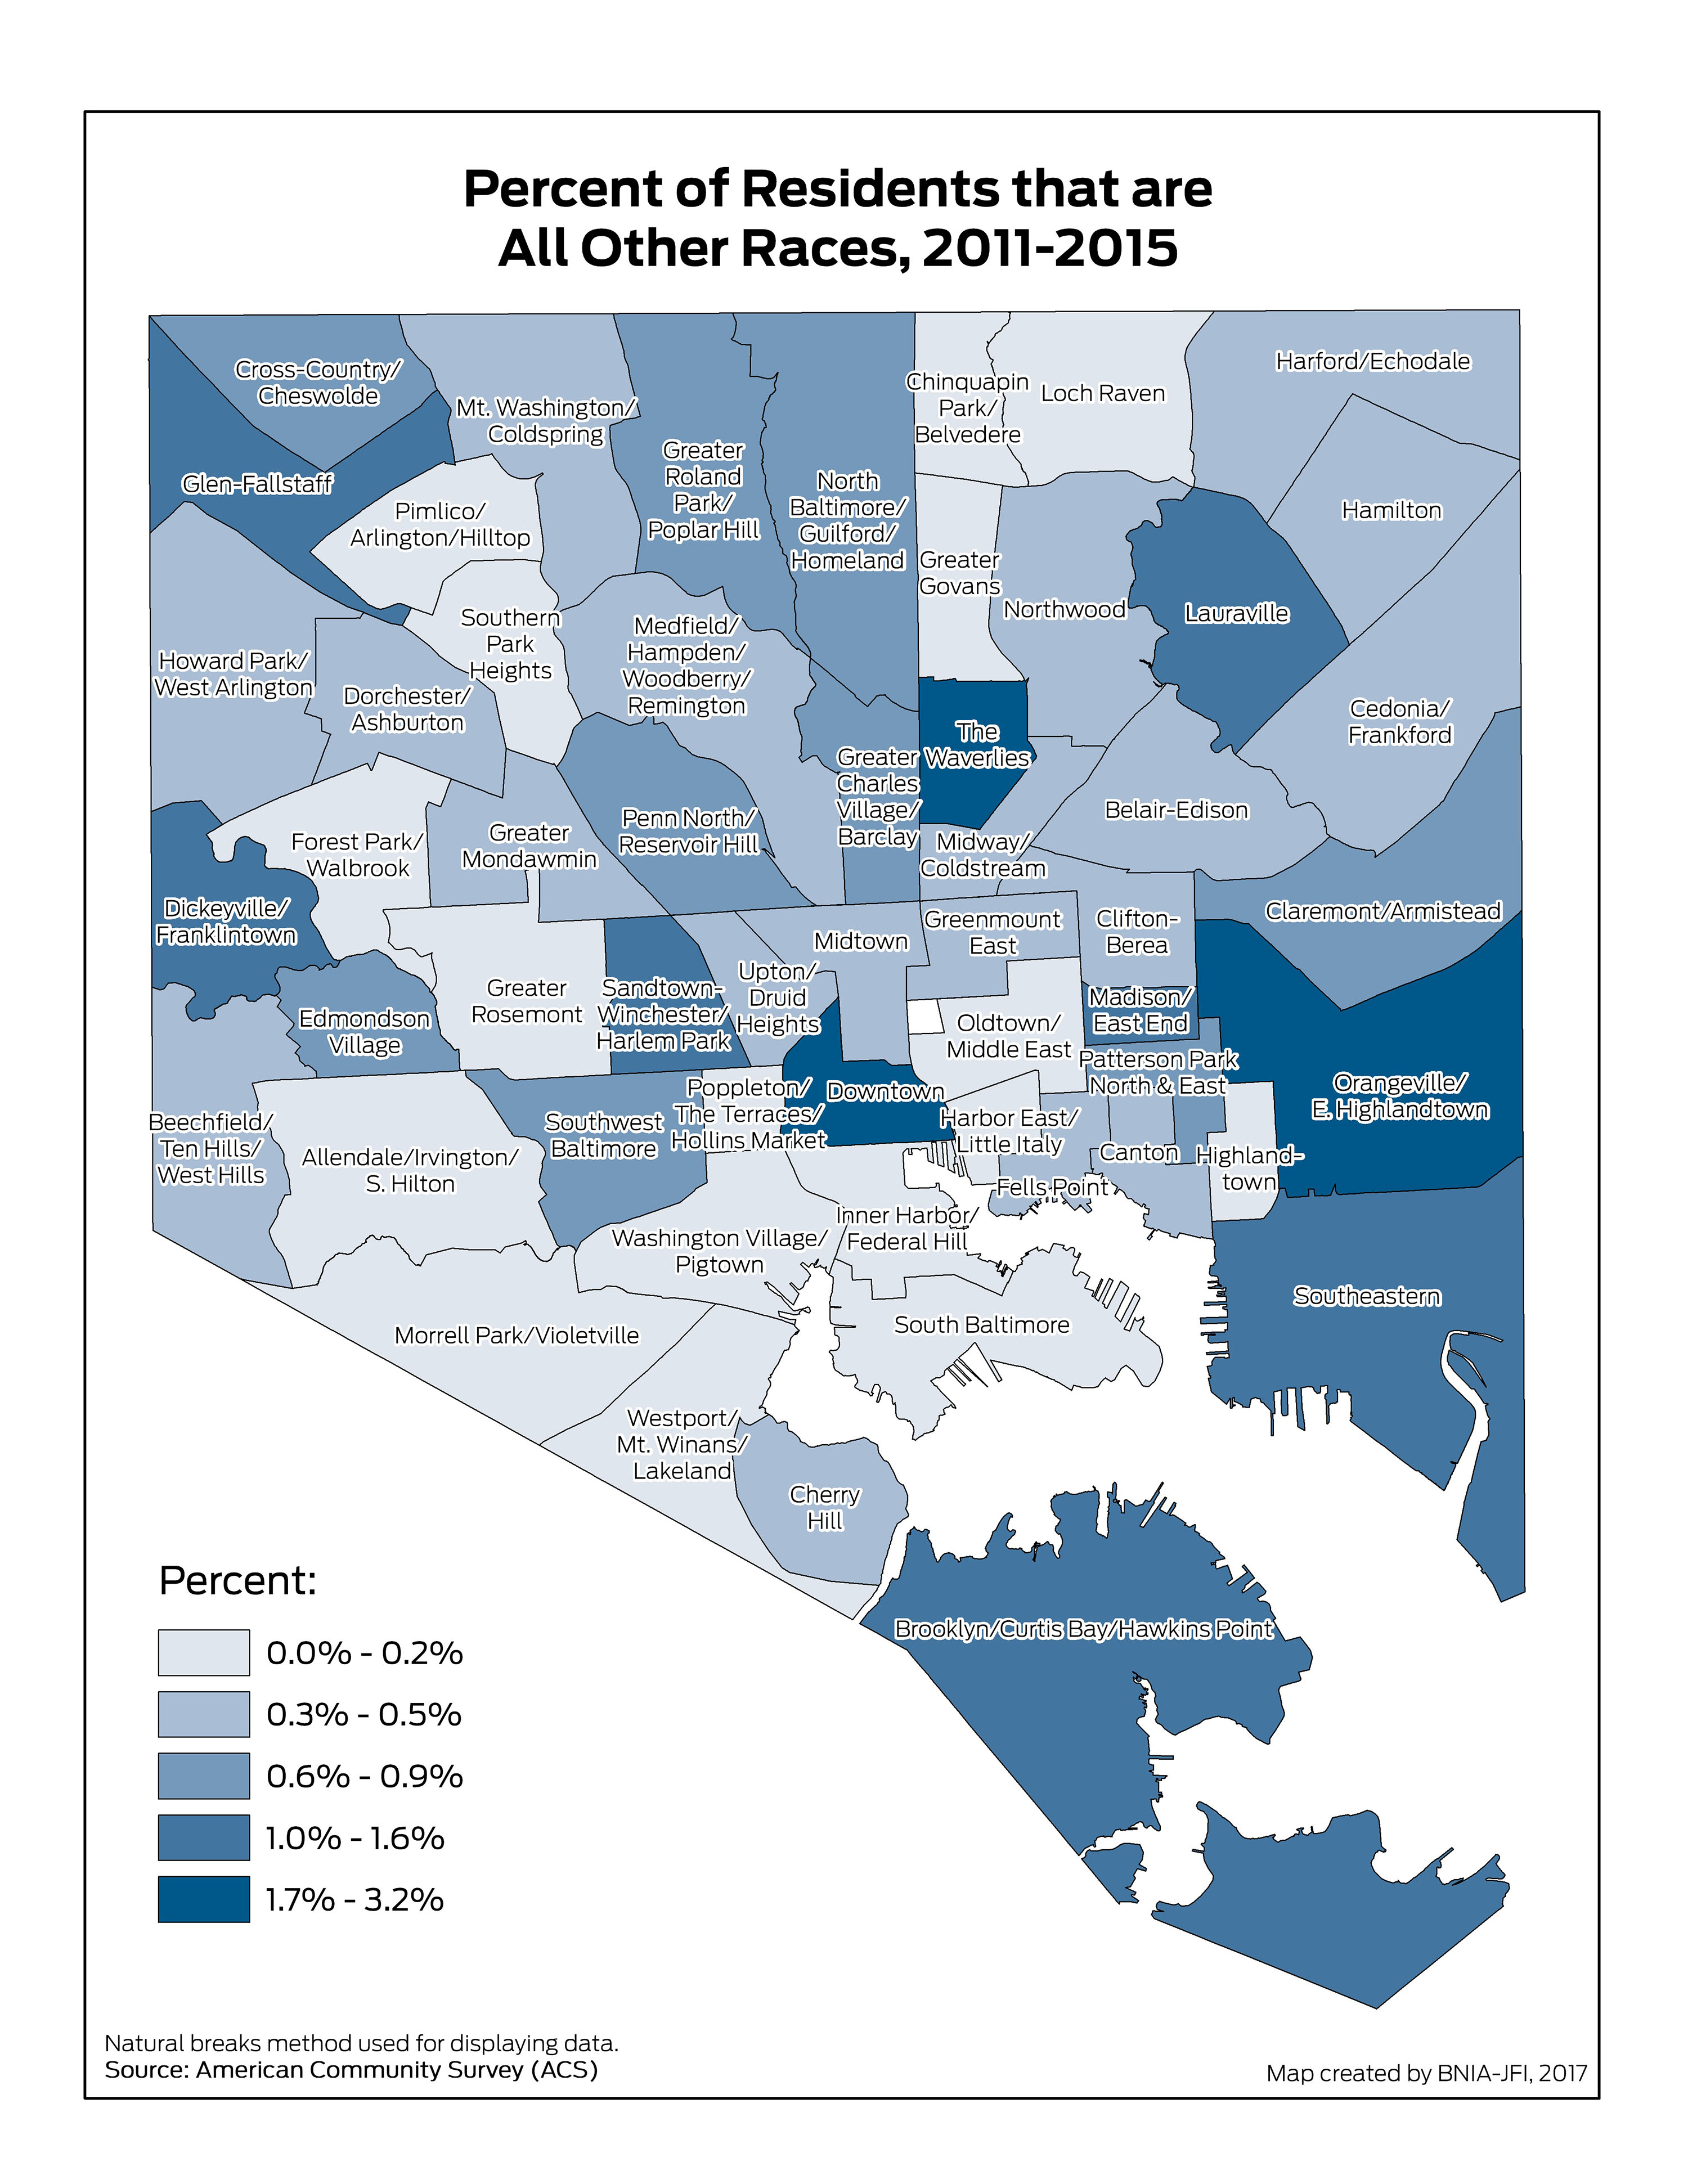
Percent of Residents – All Other Races (Hawaiian/Pacific Islander, Alaskan/Native American, Other Race)(Non-Hispanic)
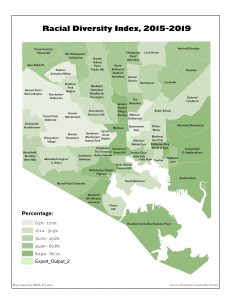
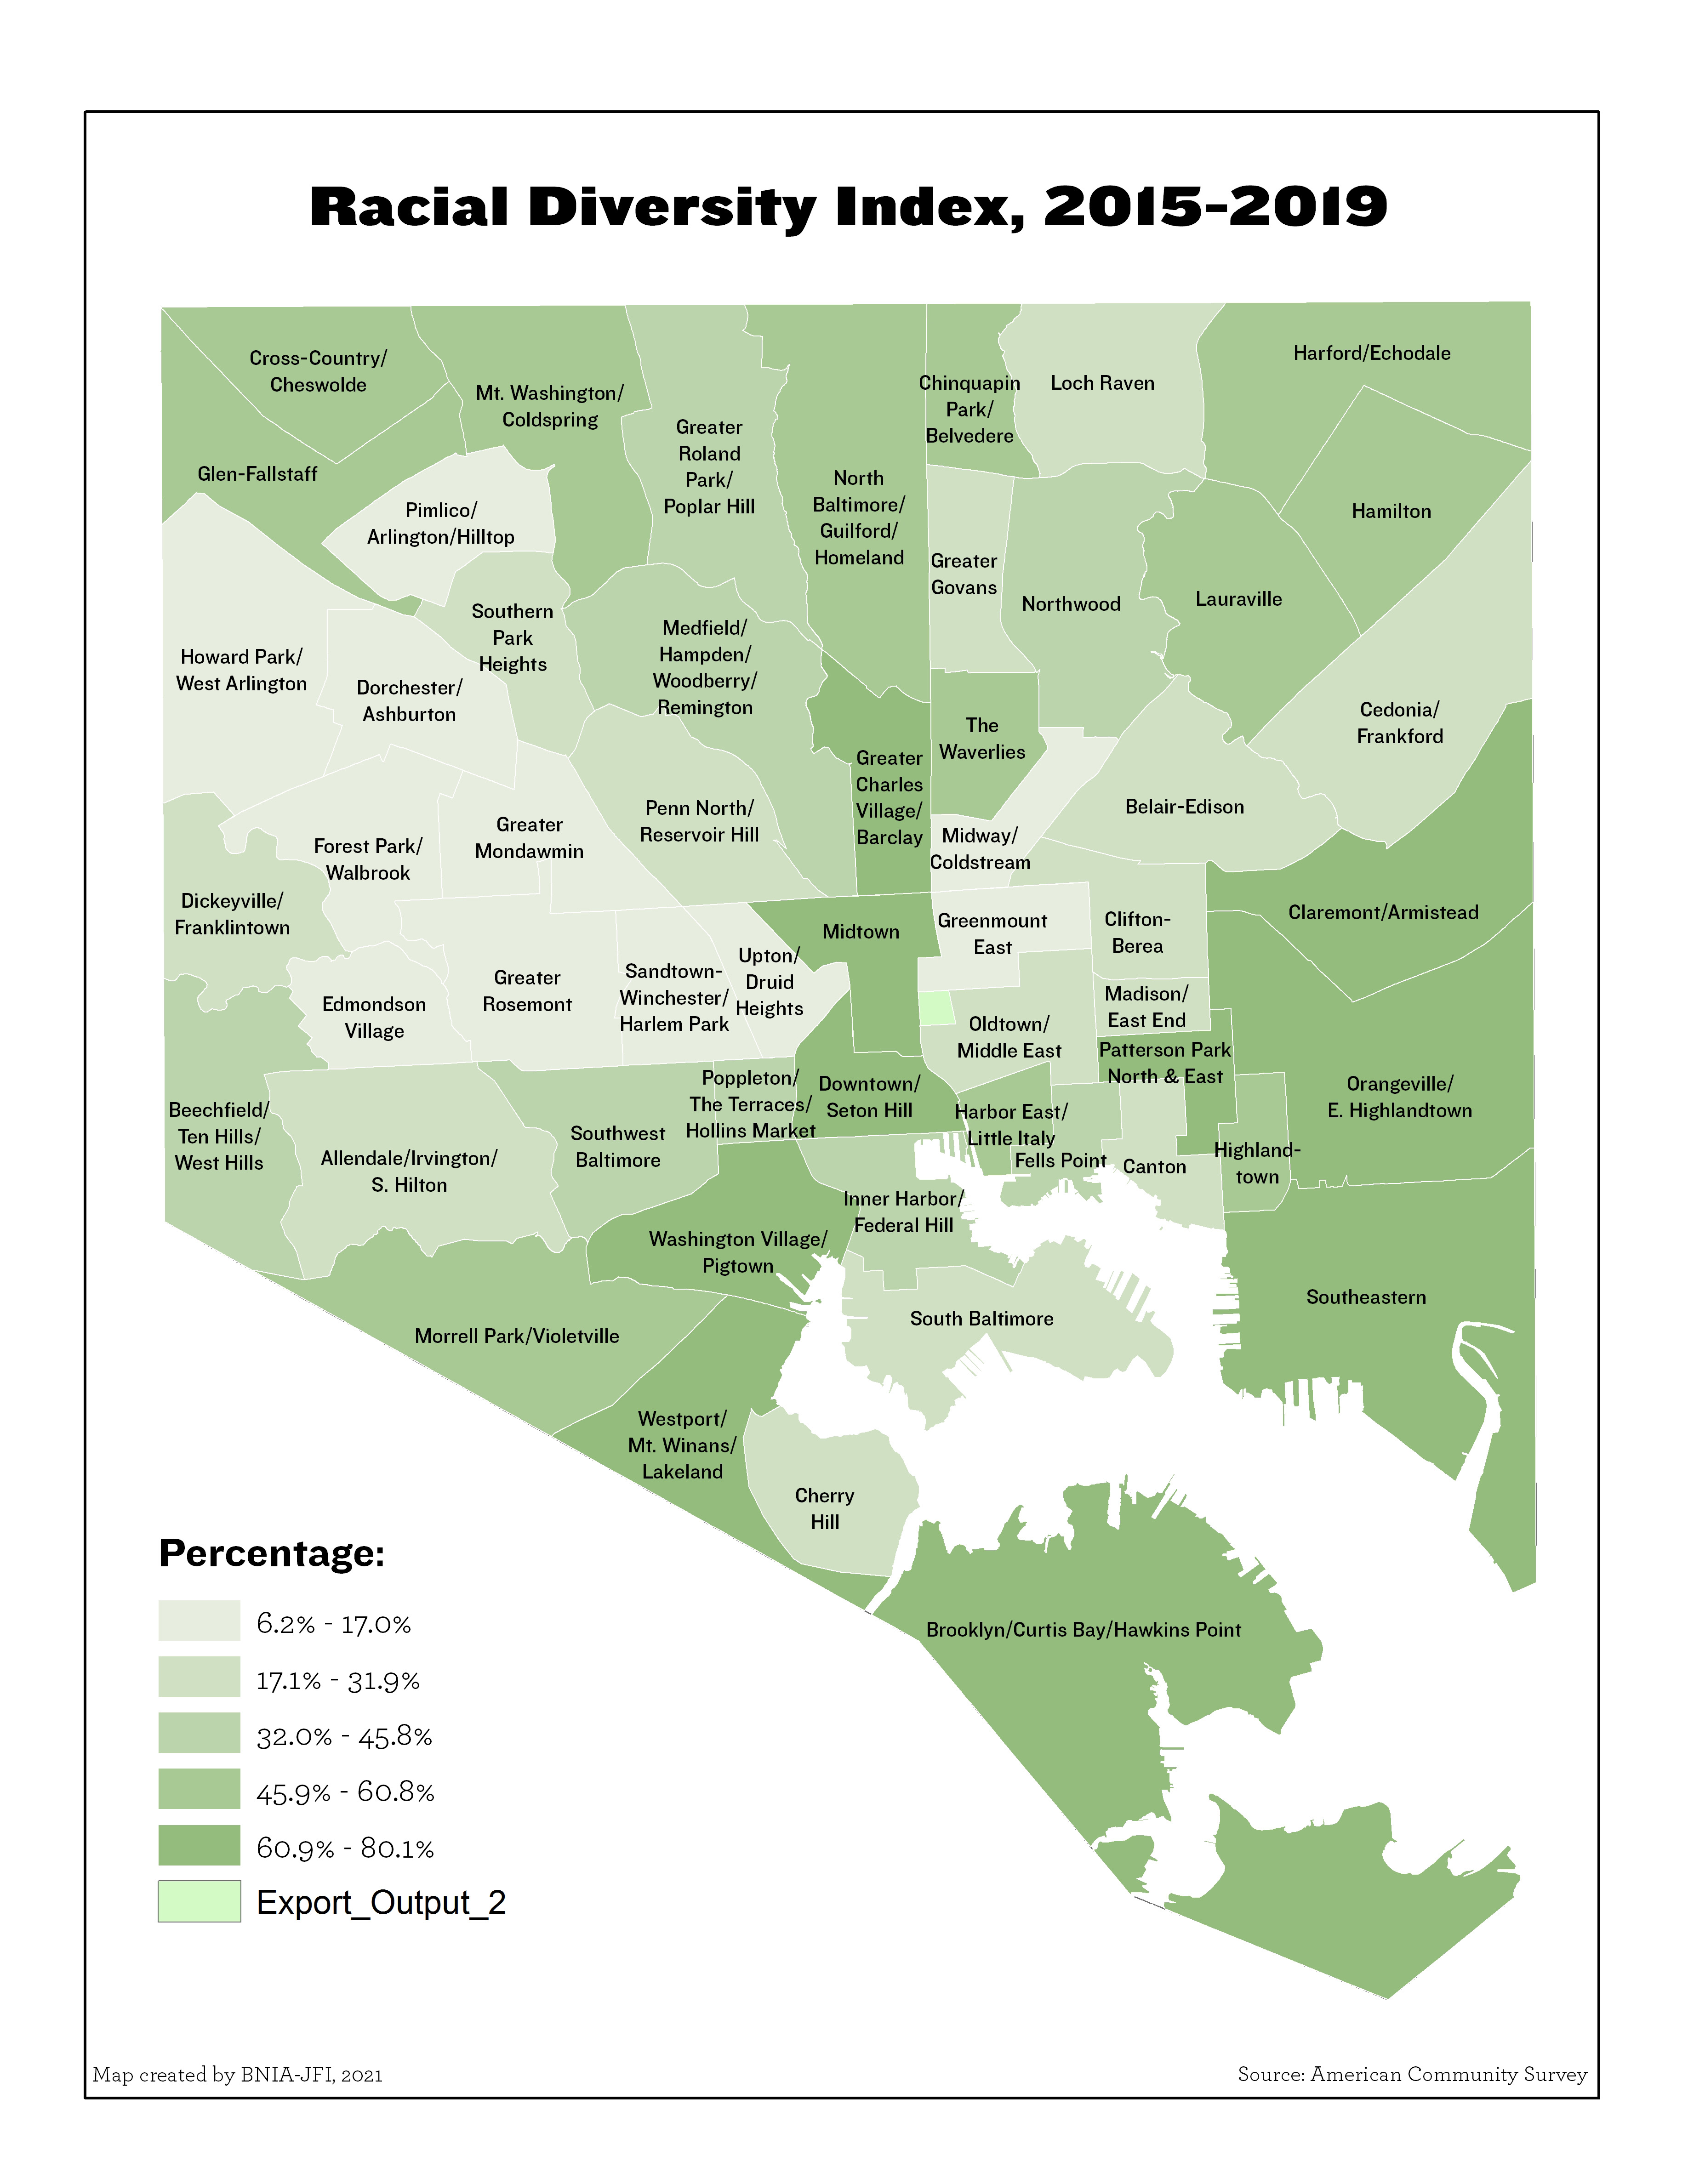
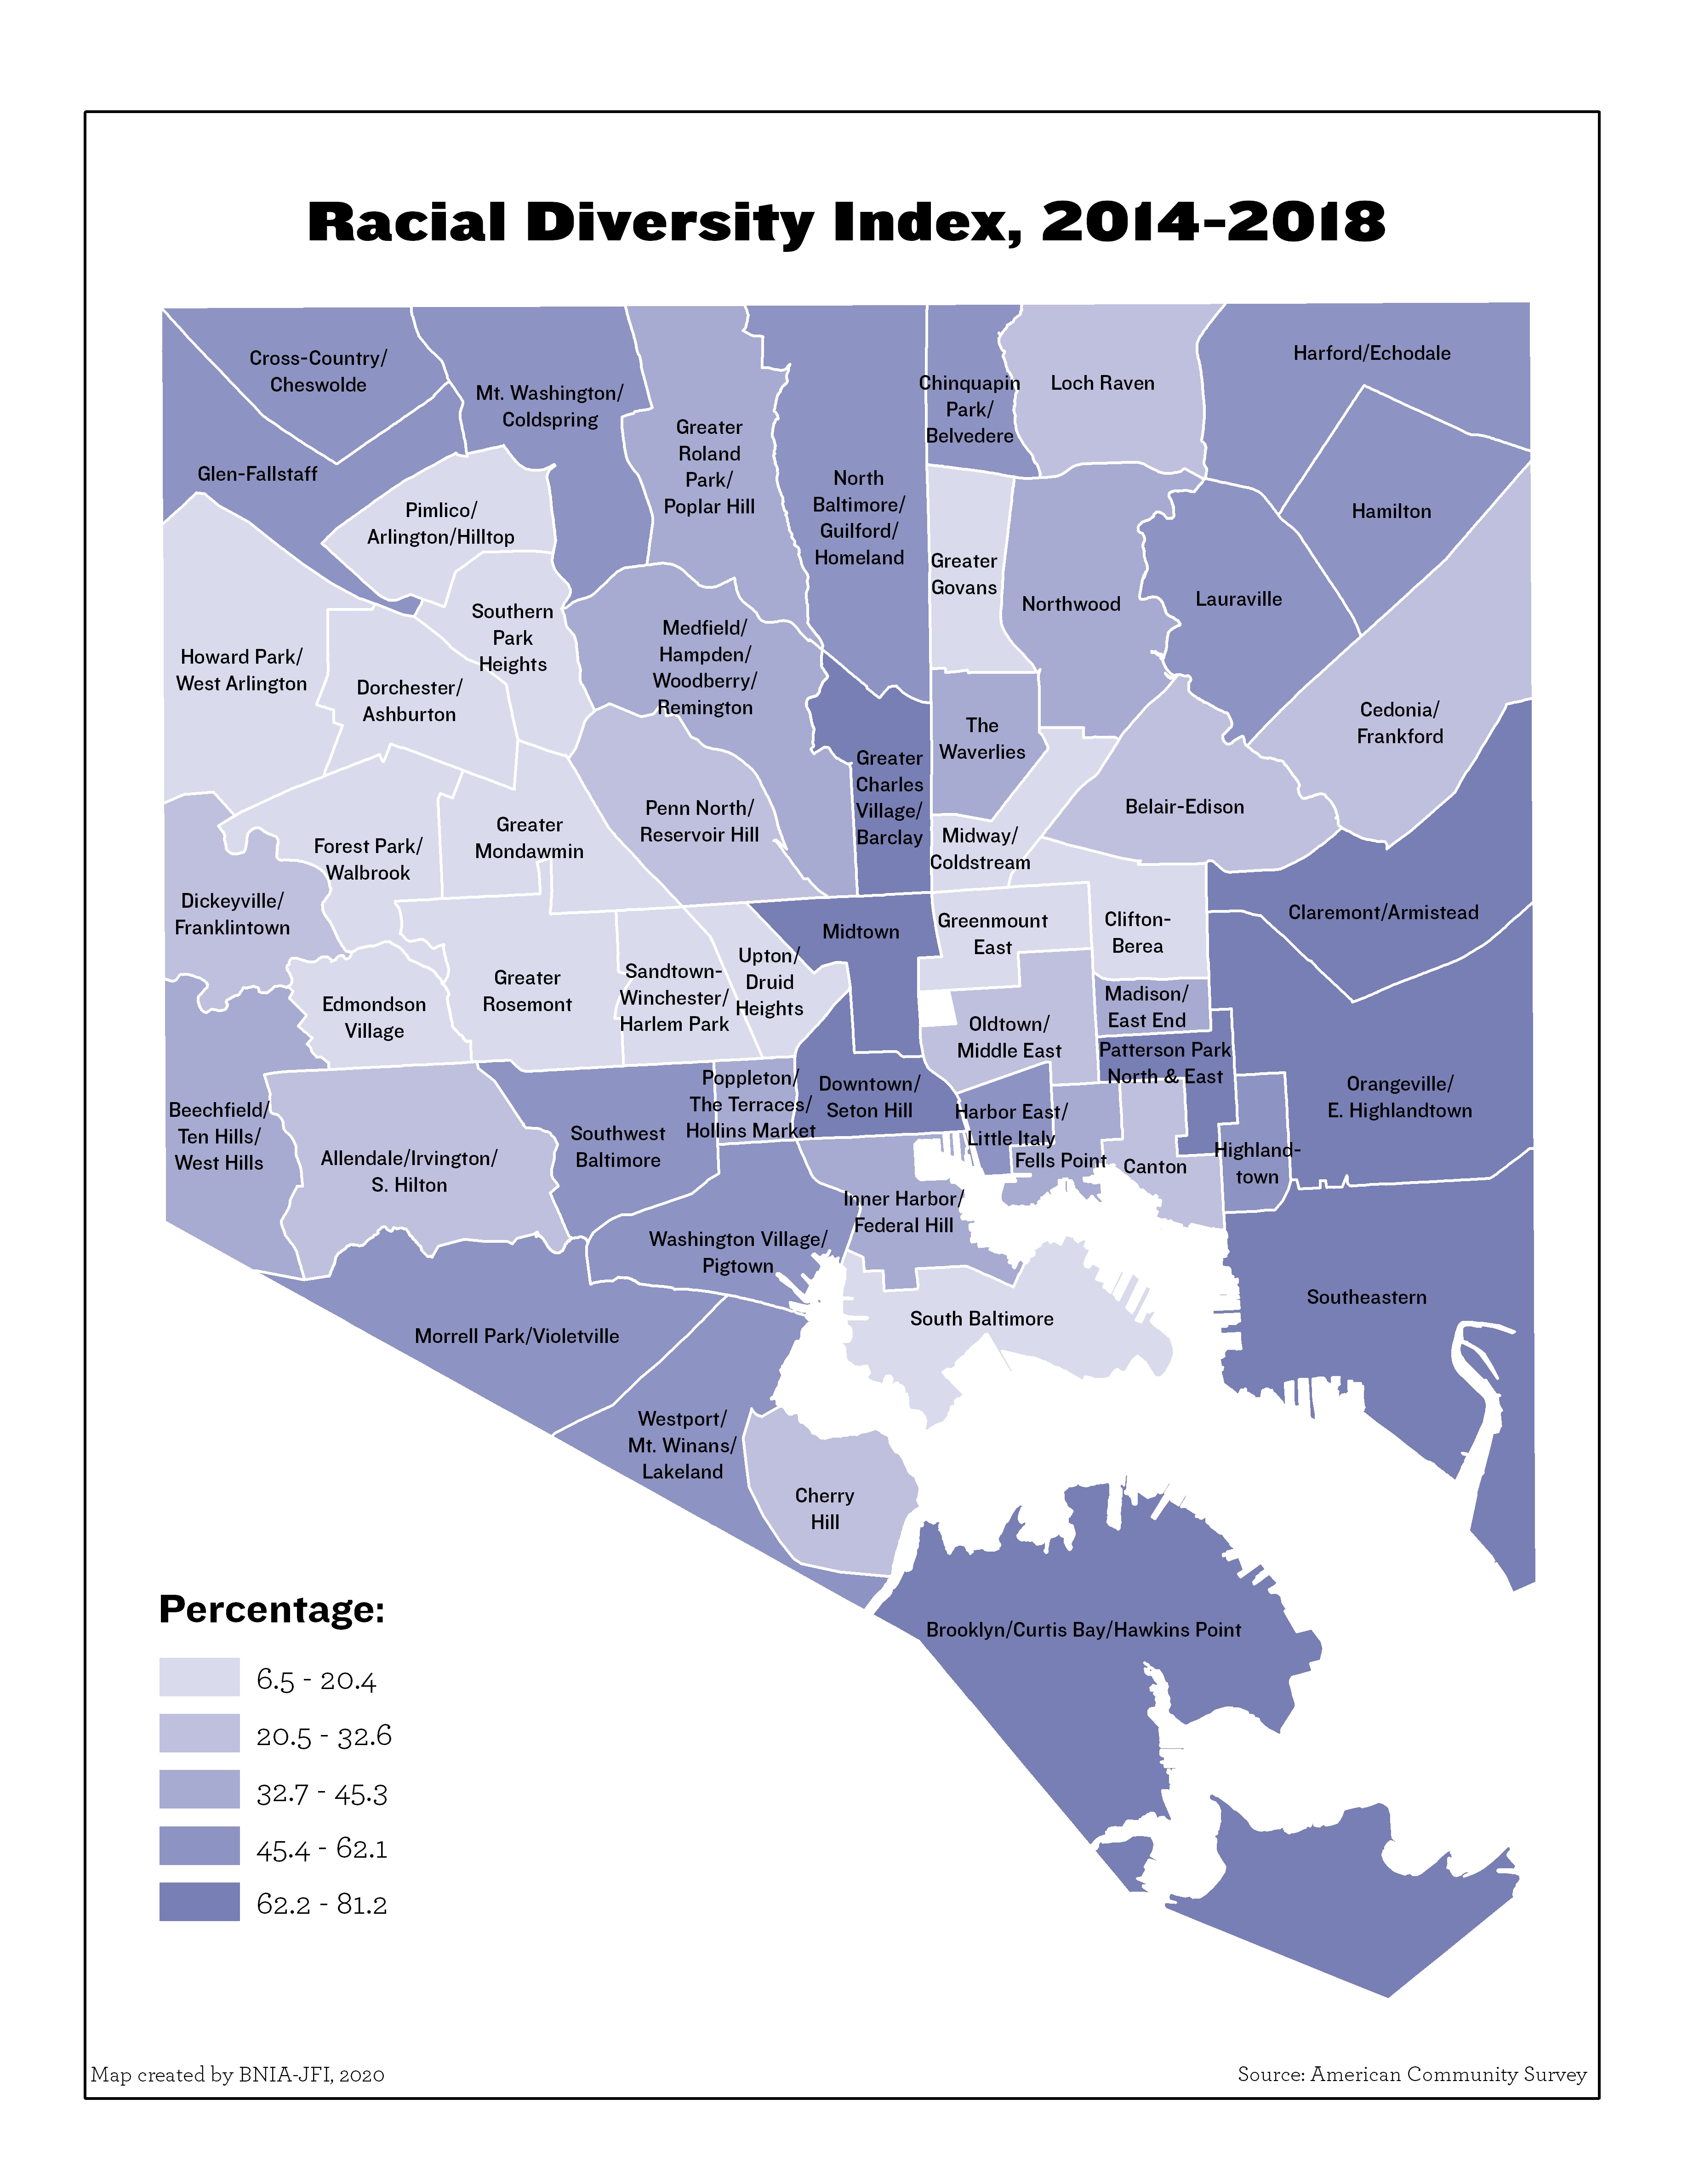
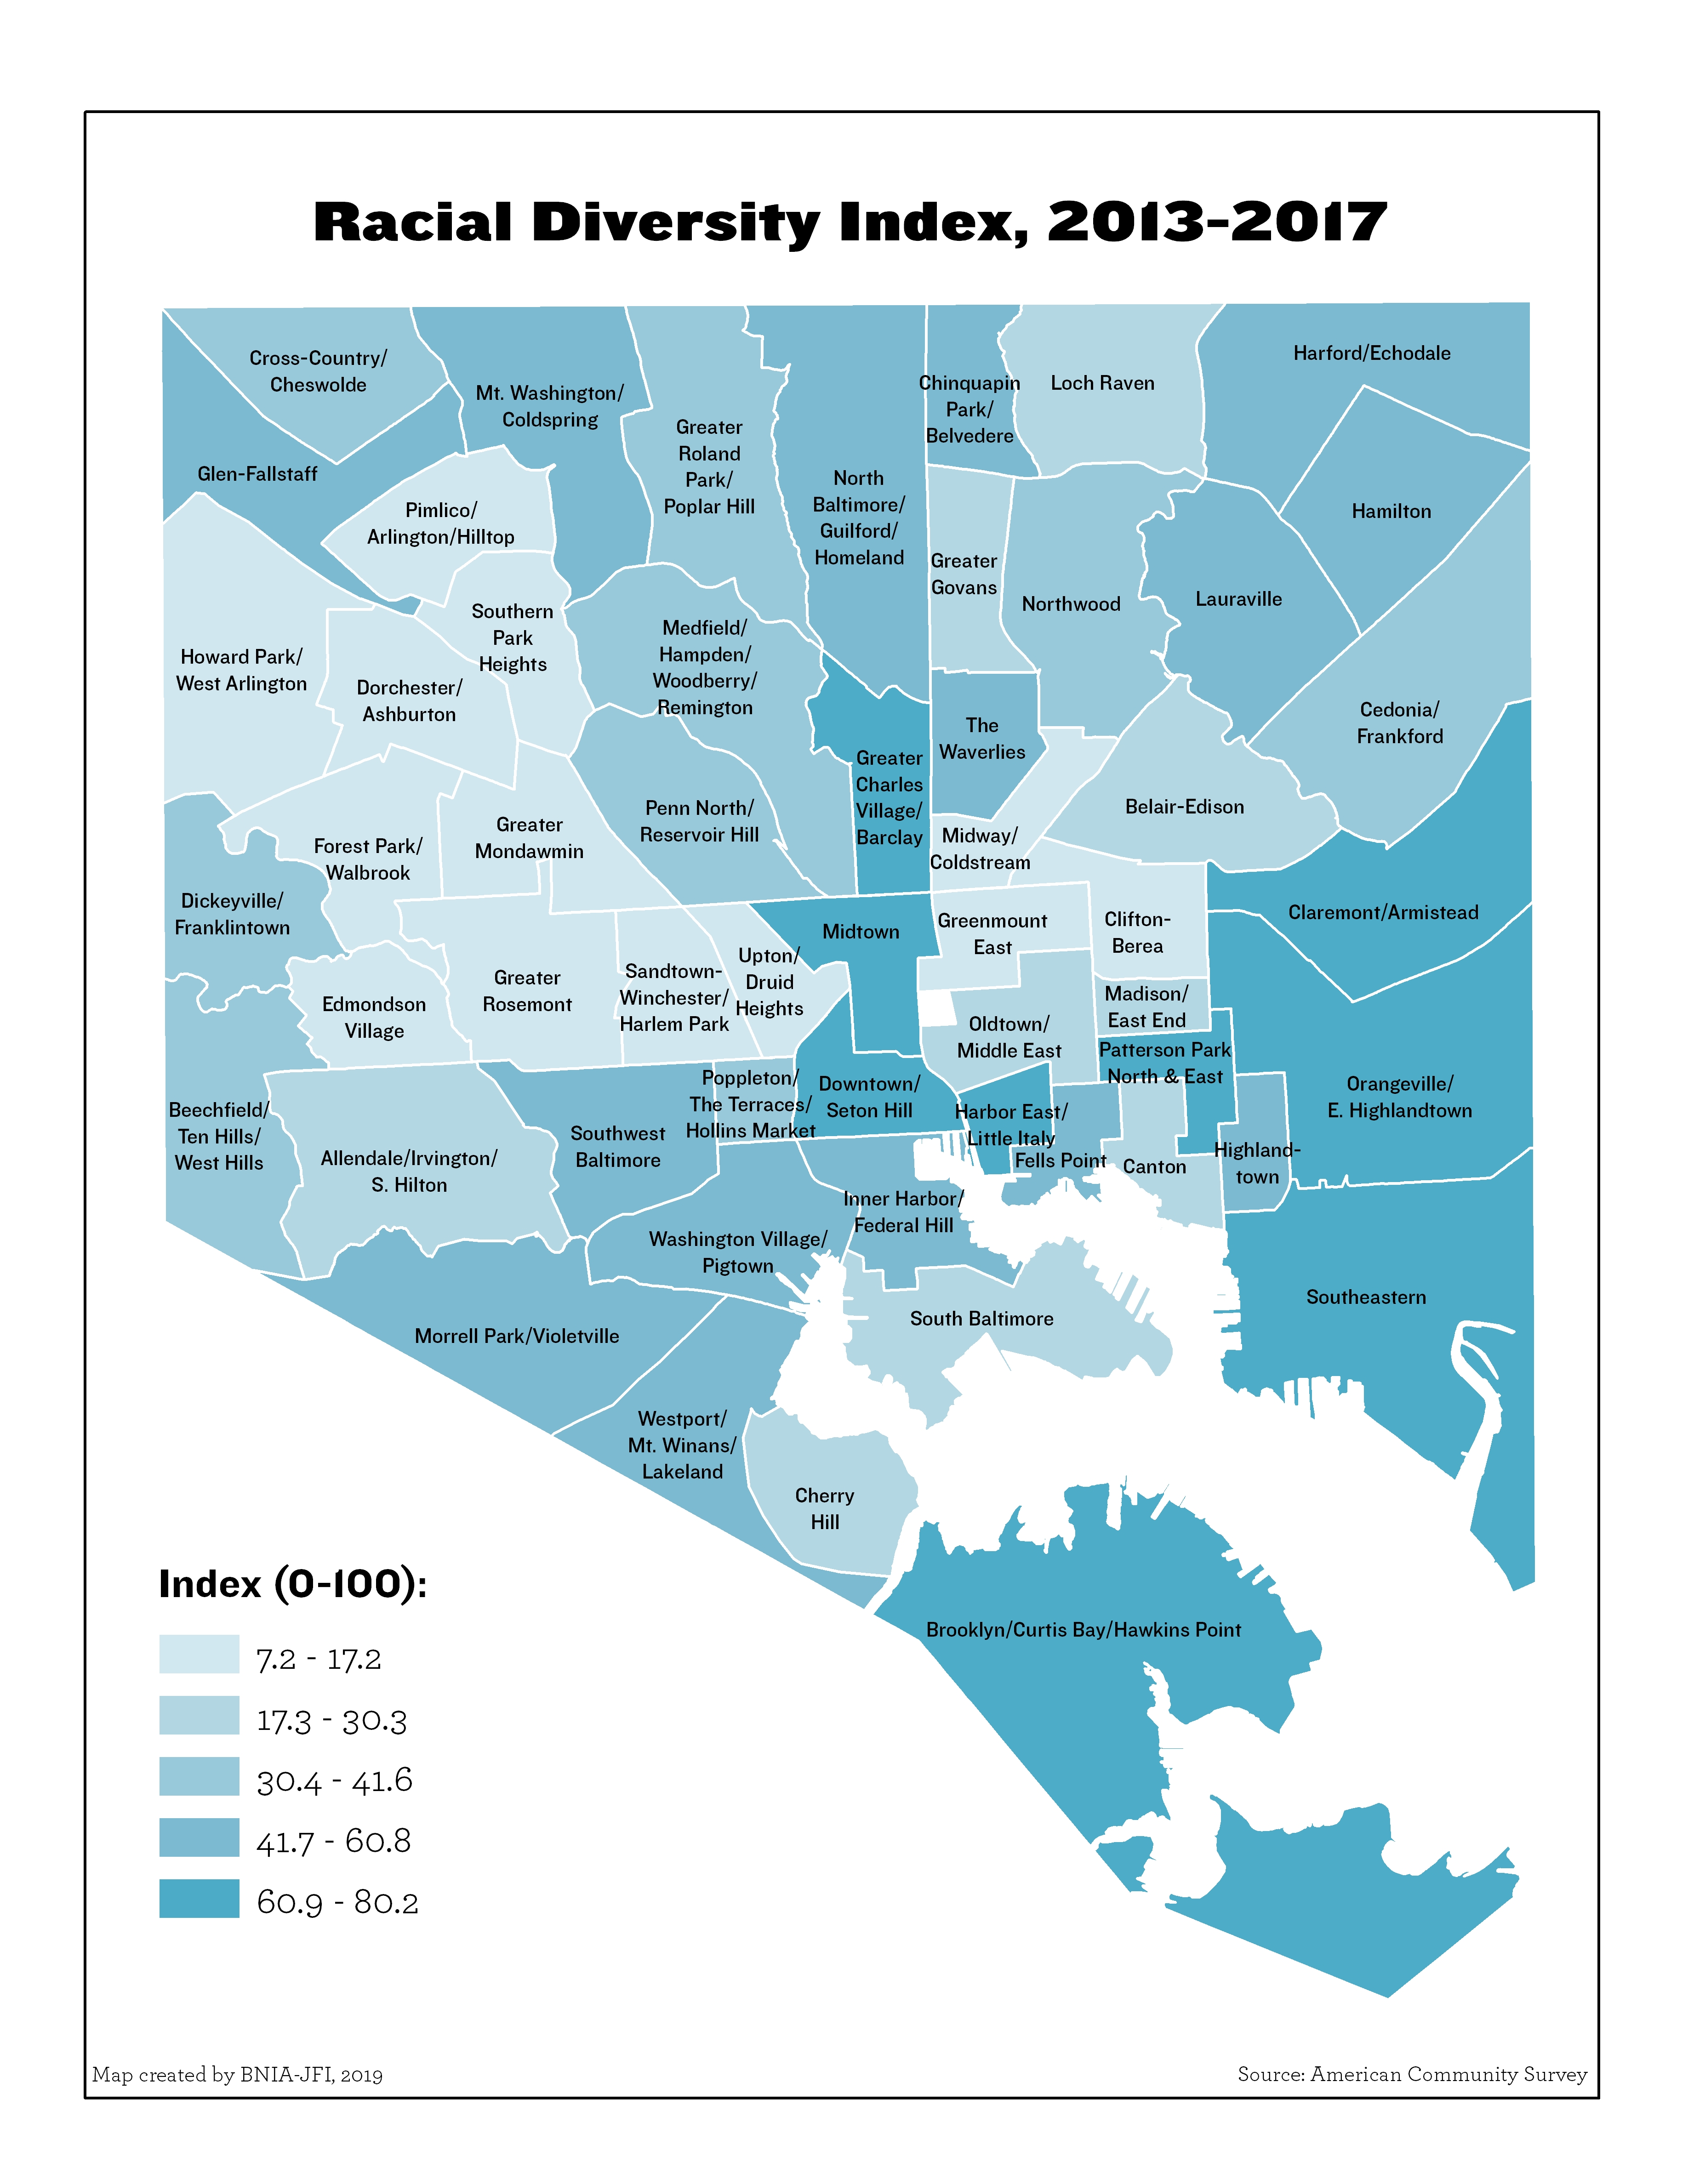
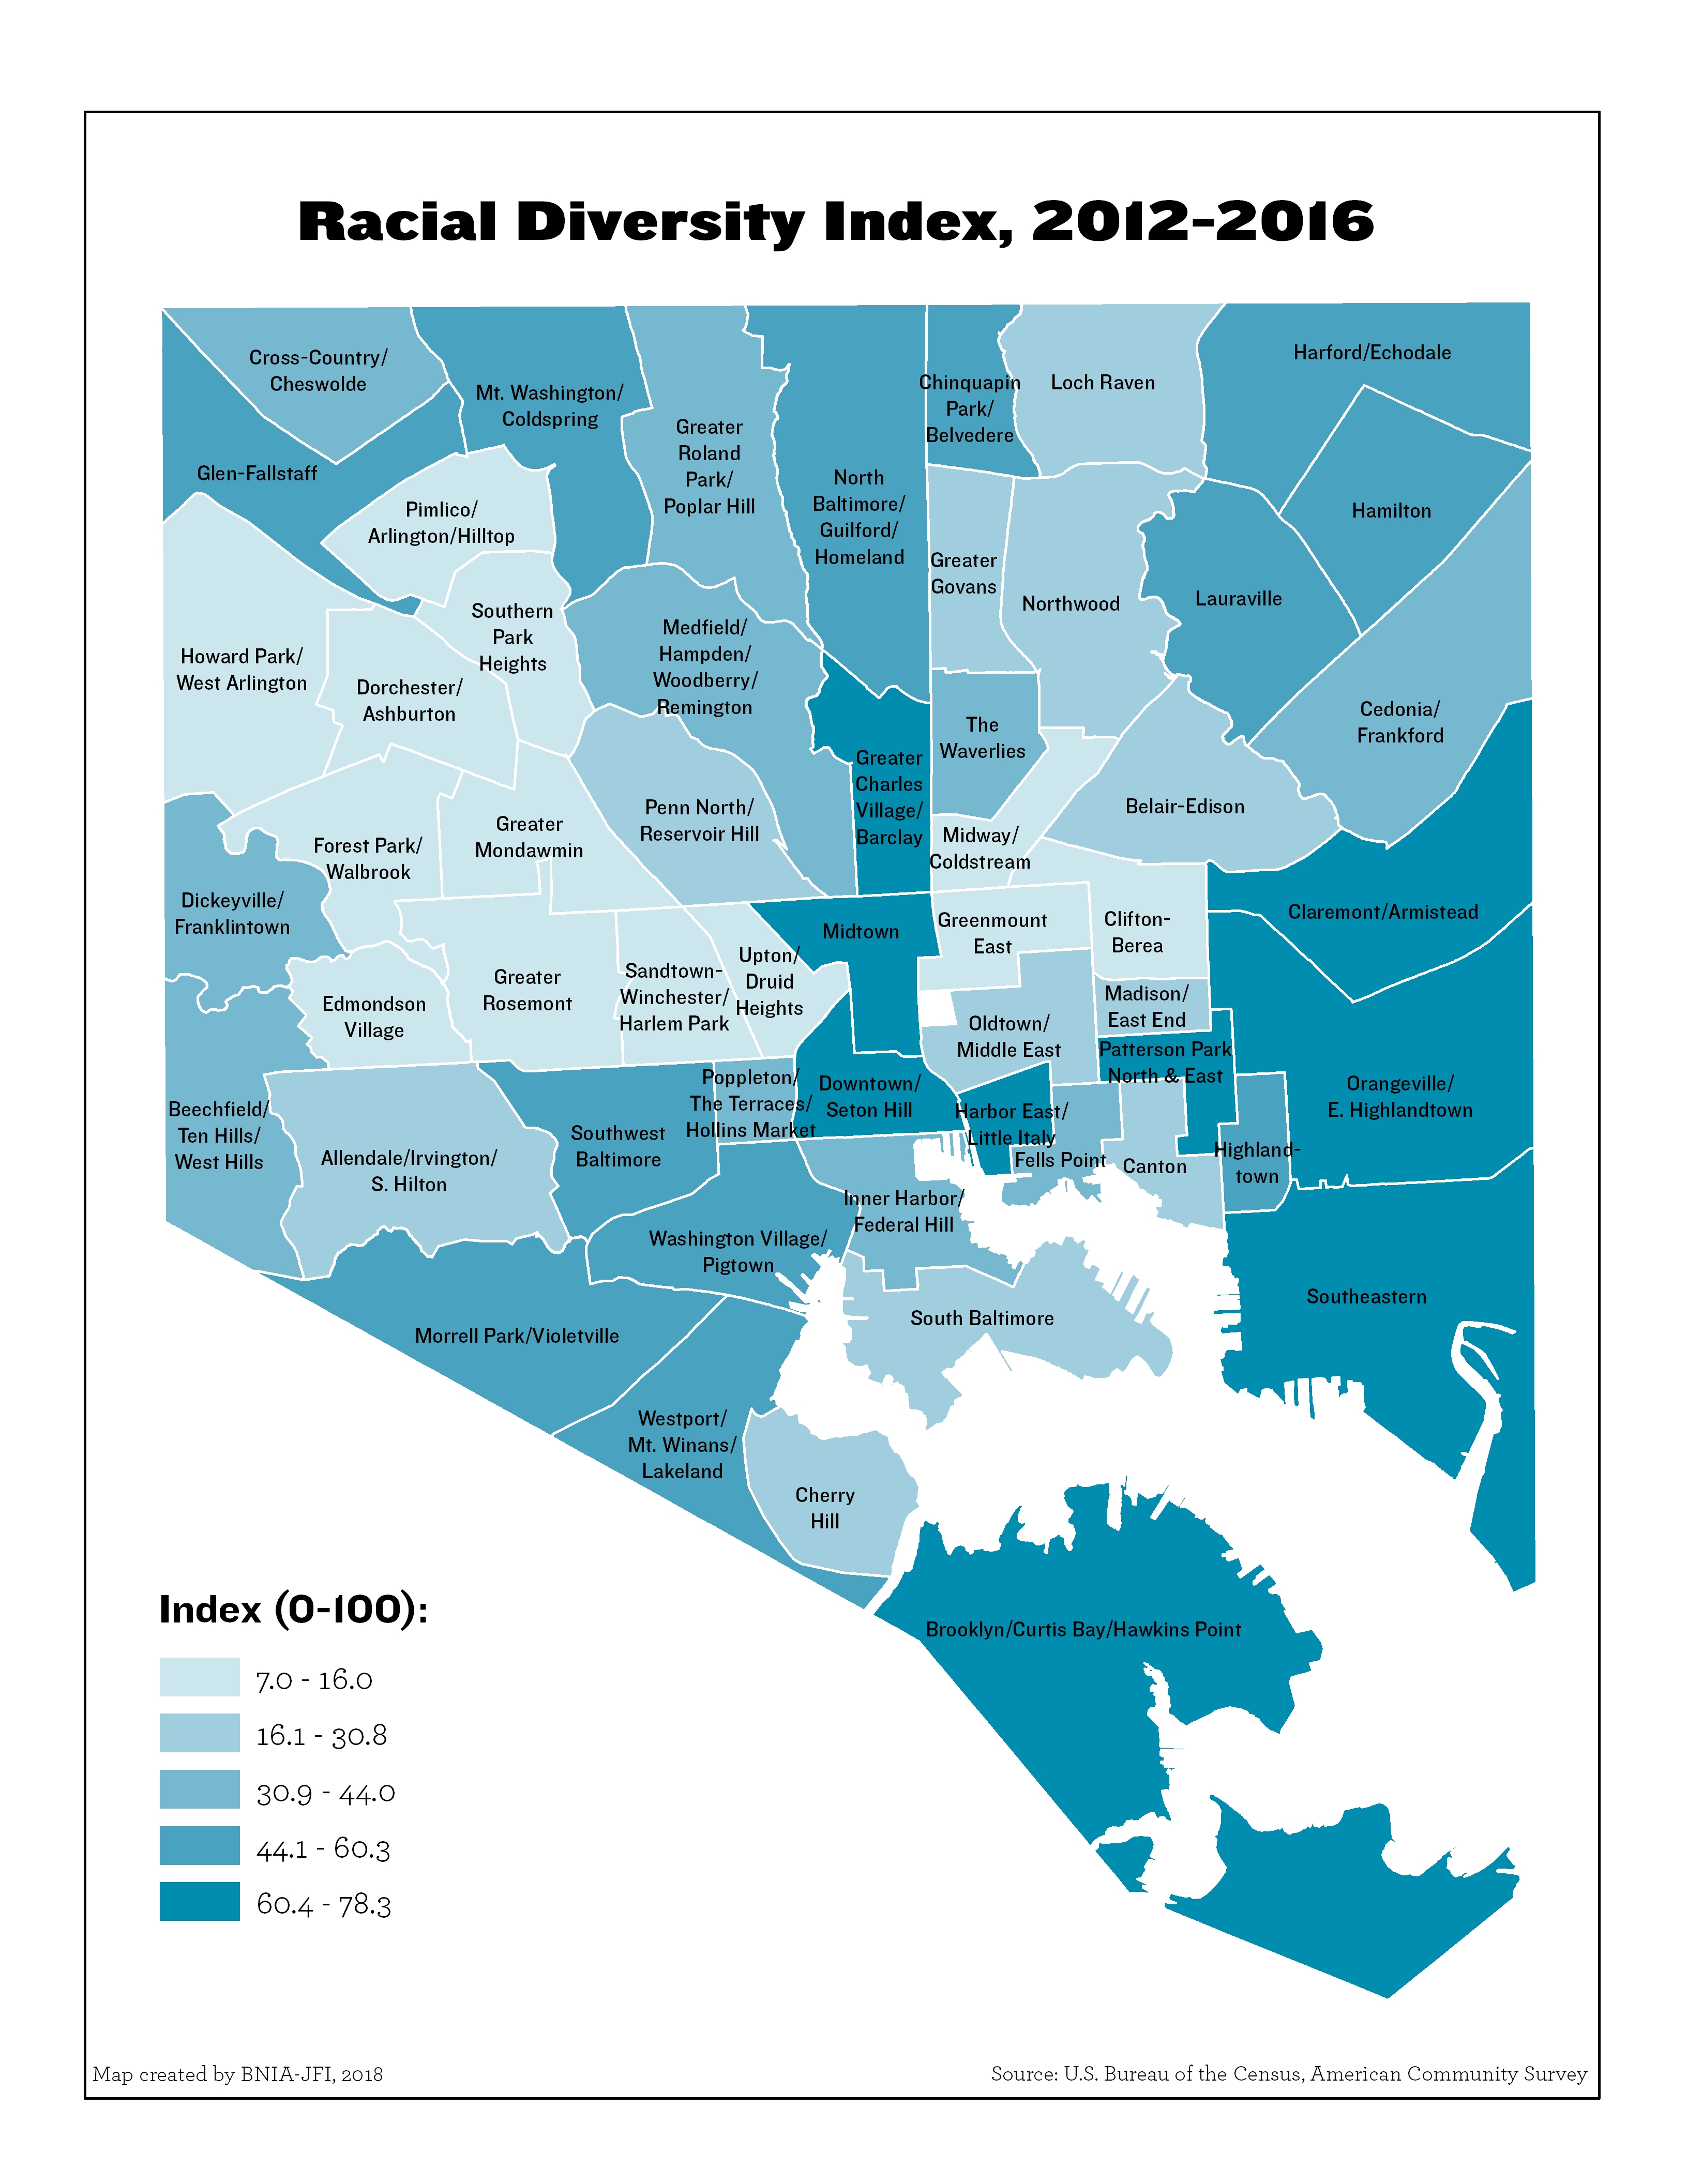
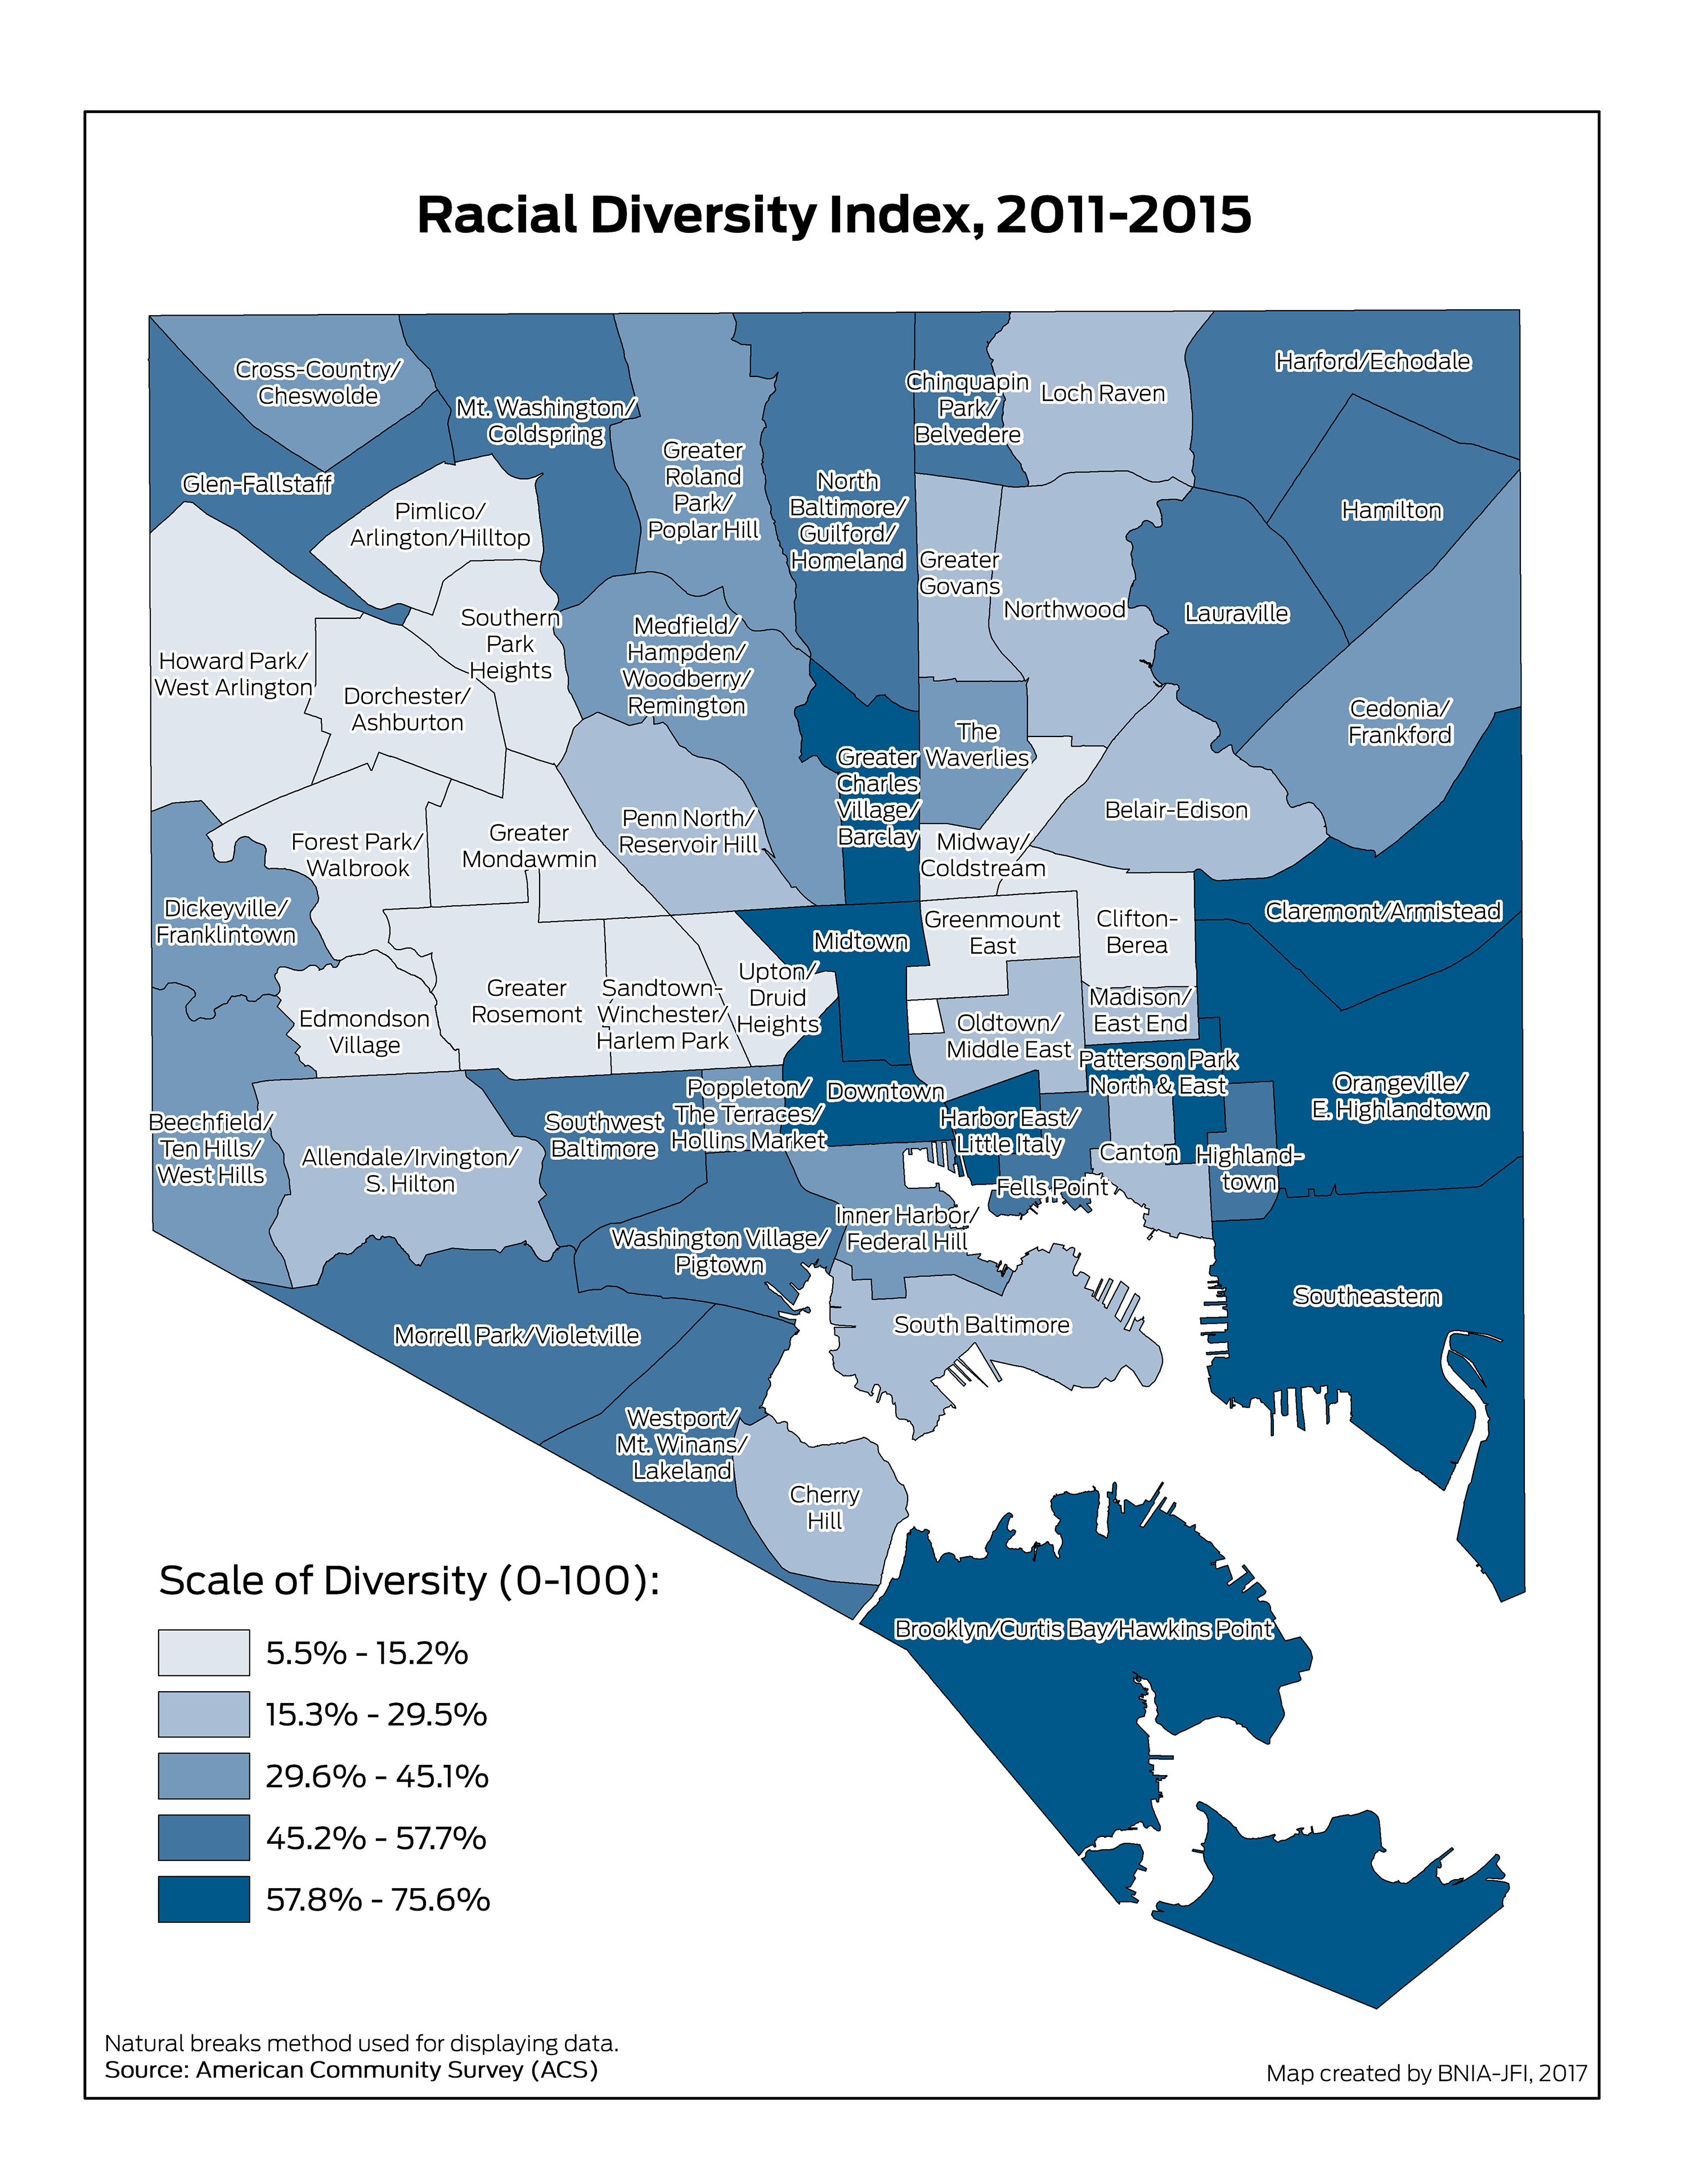
Racial Diversity Index
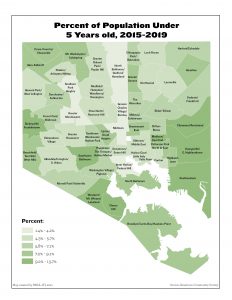
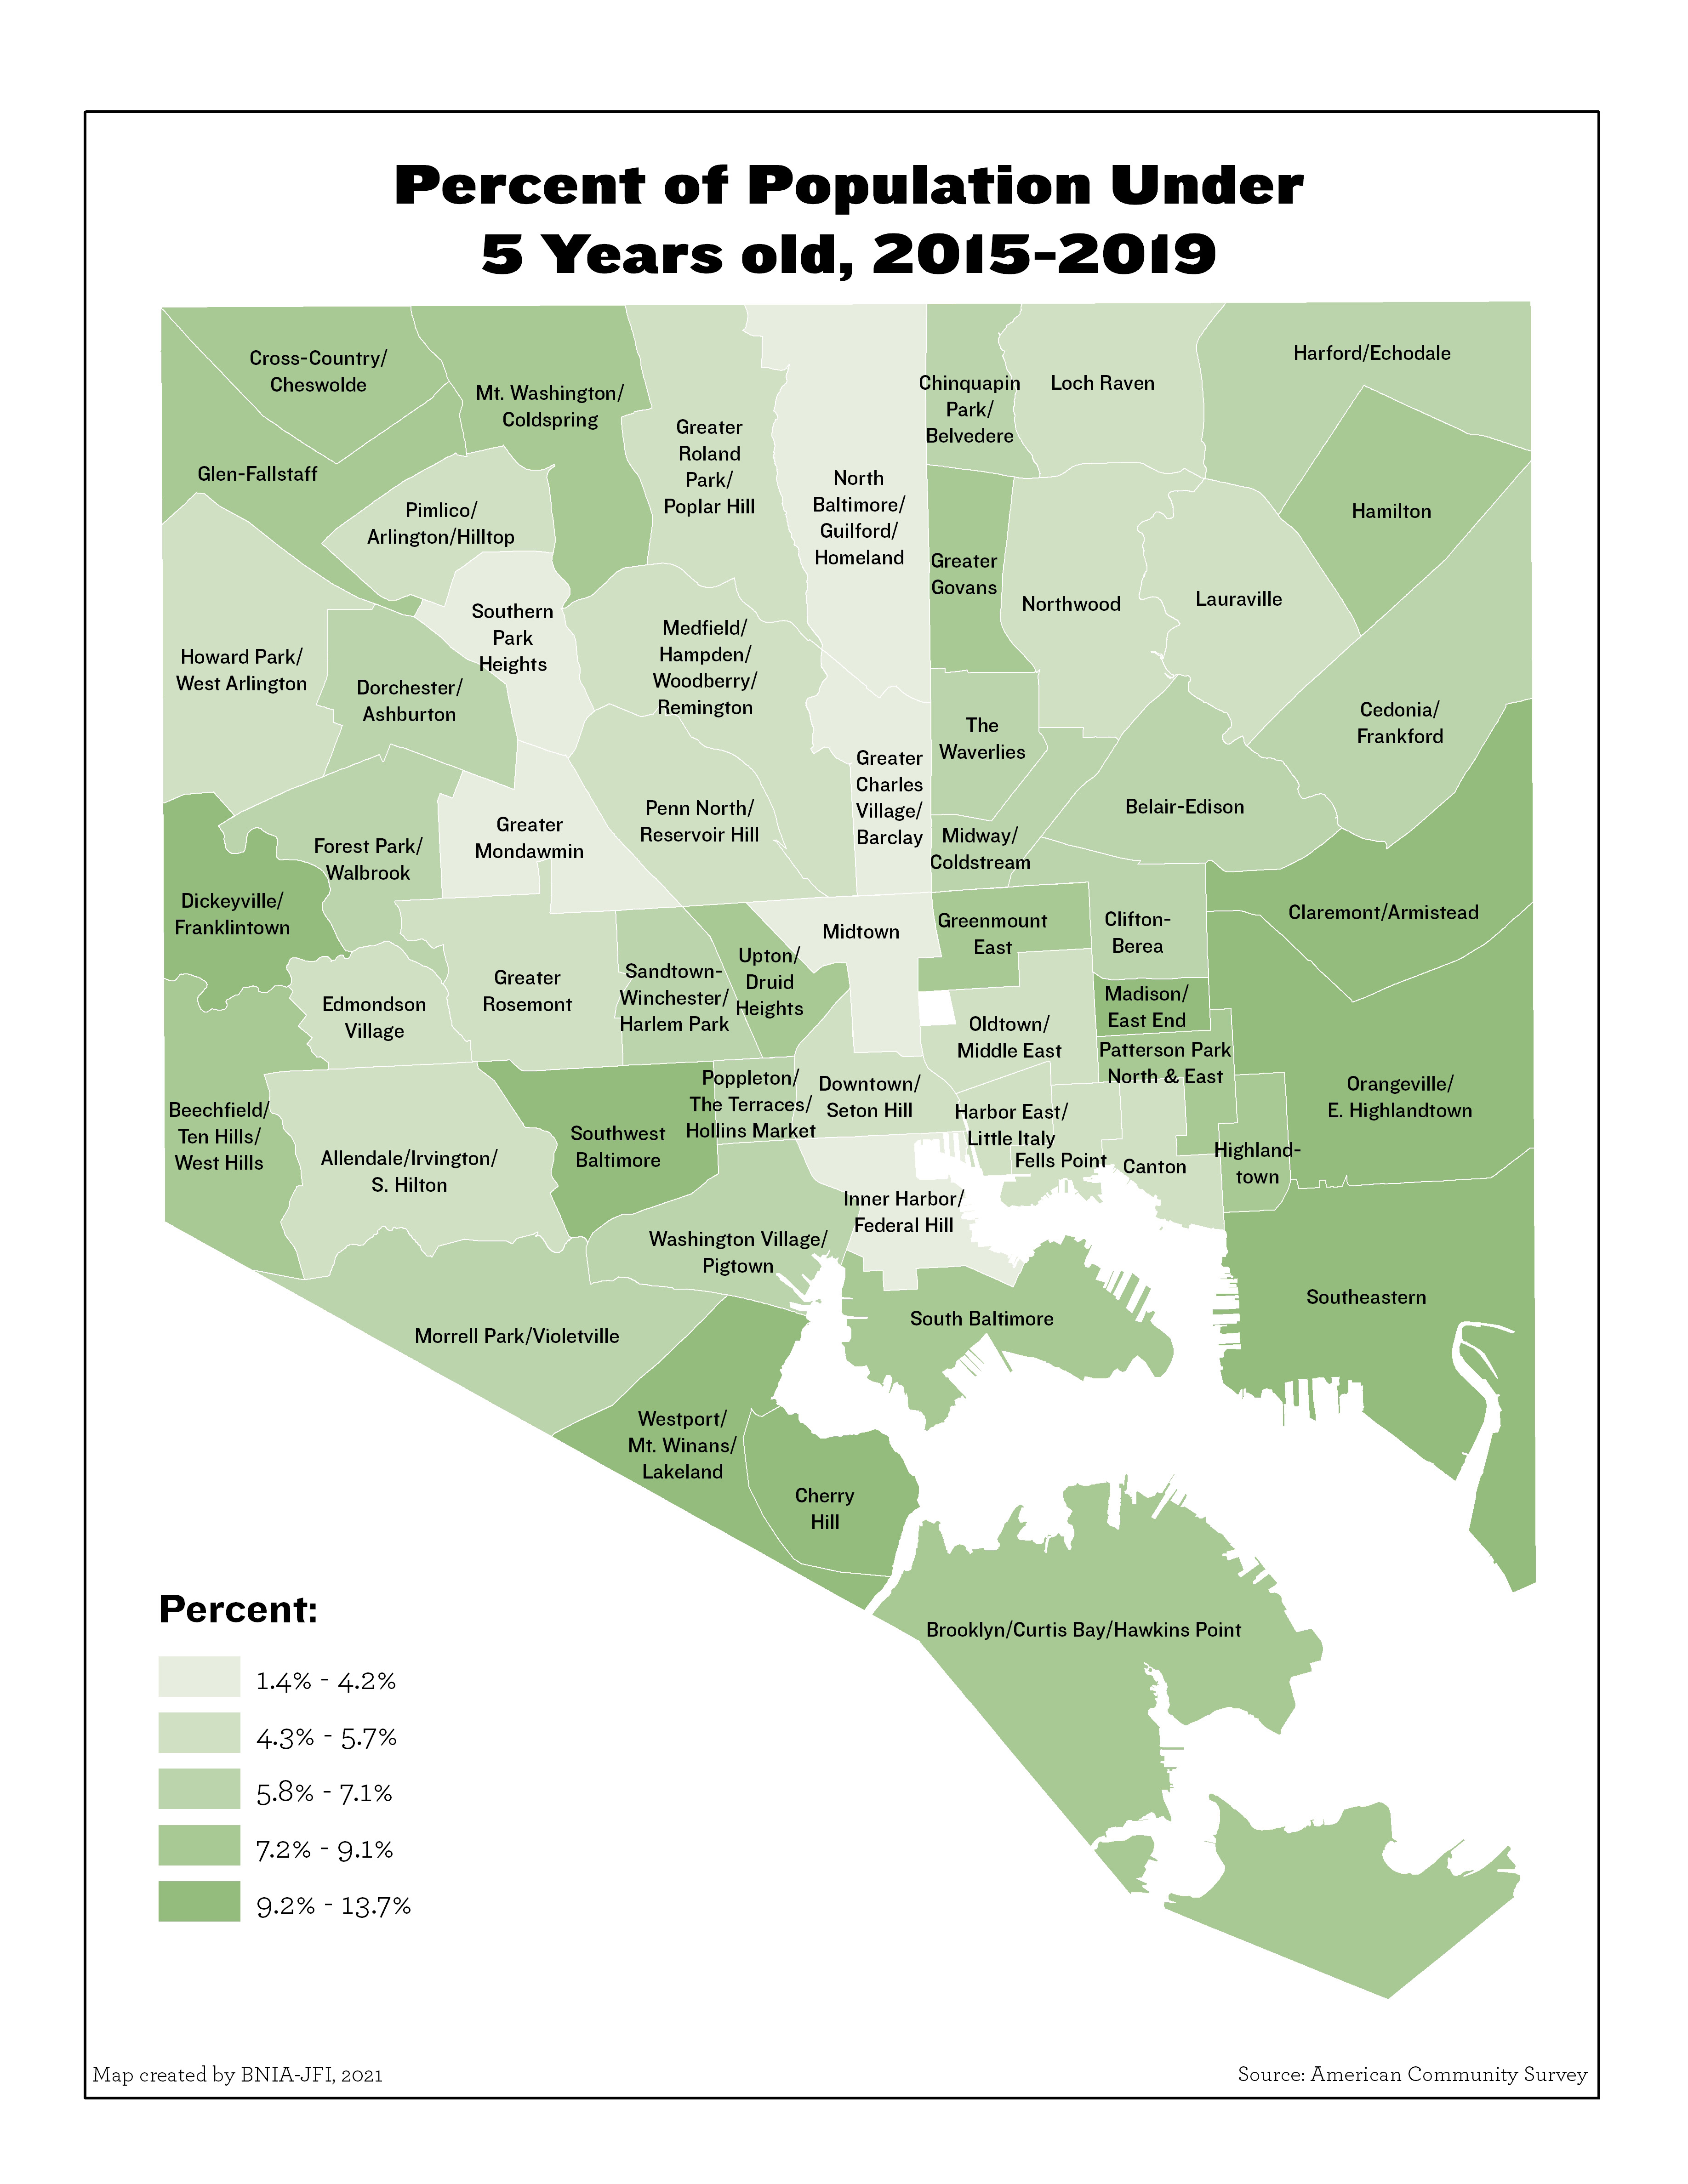
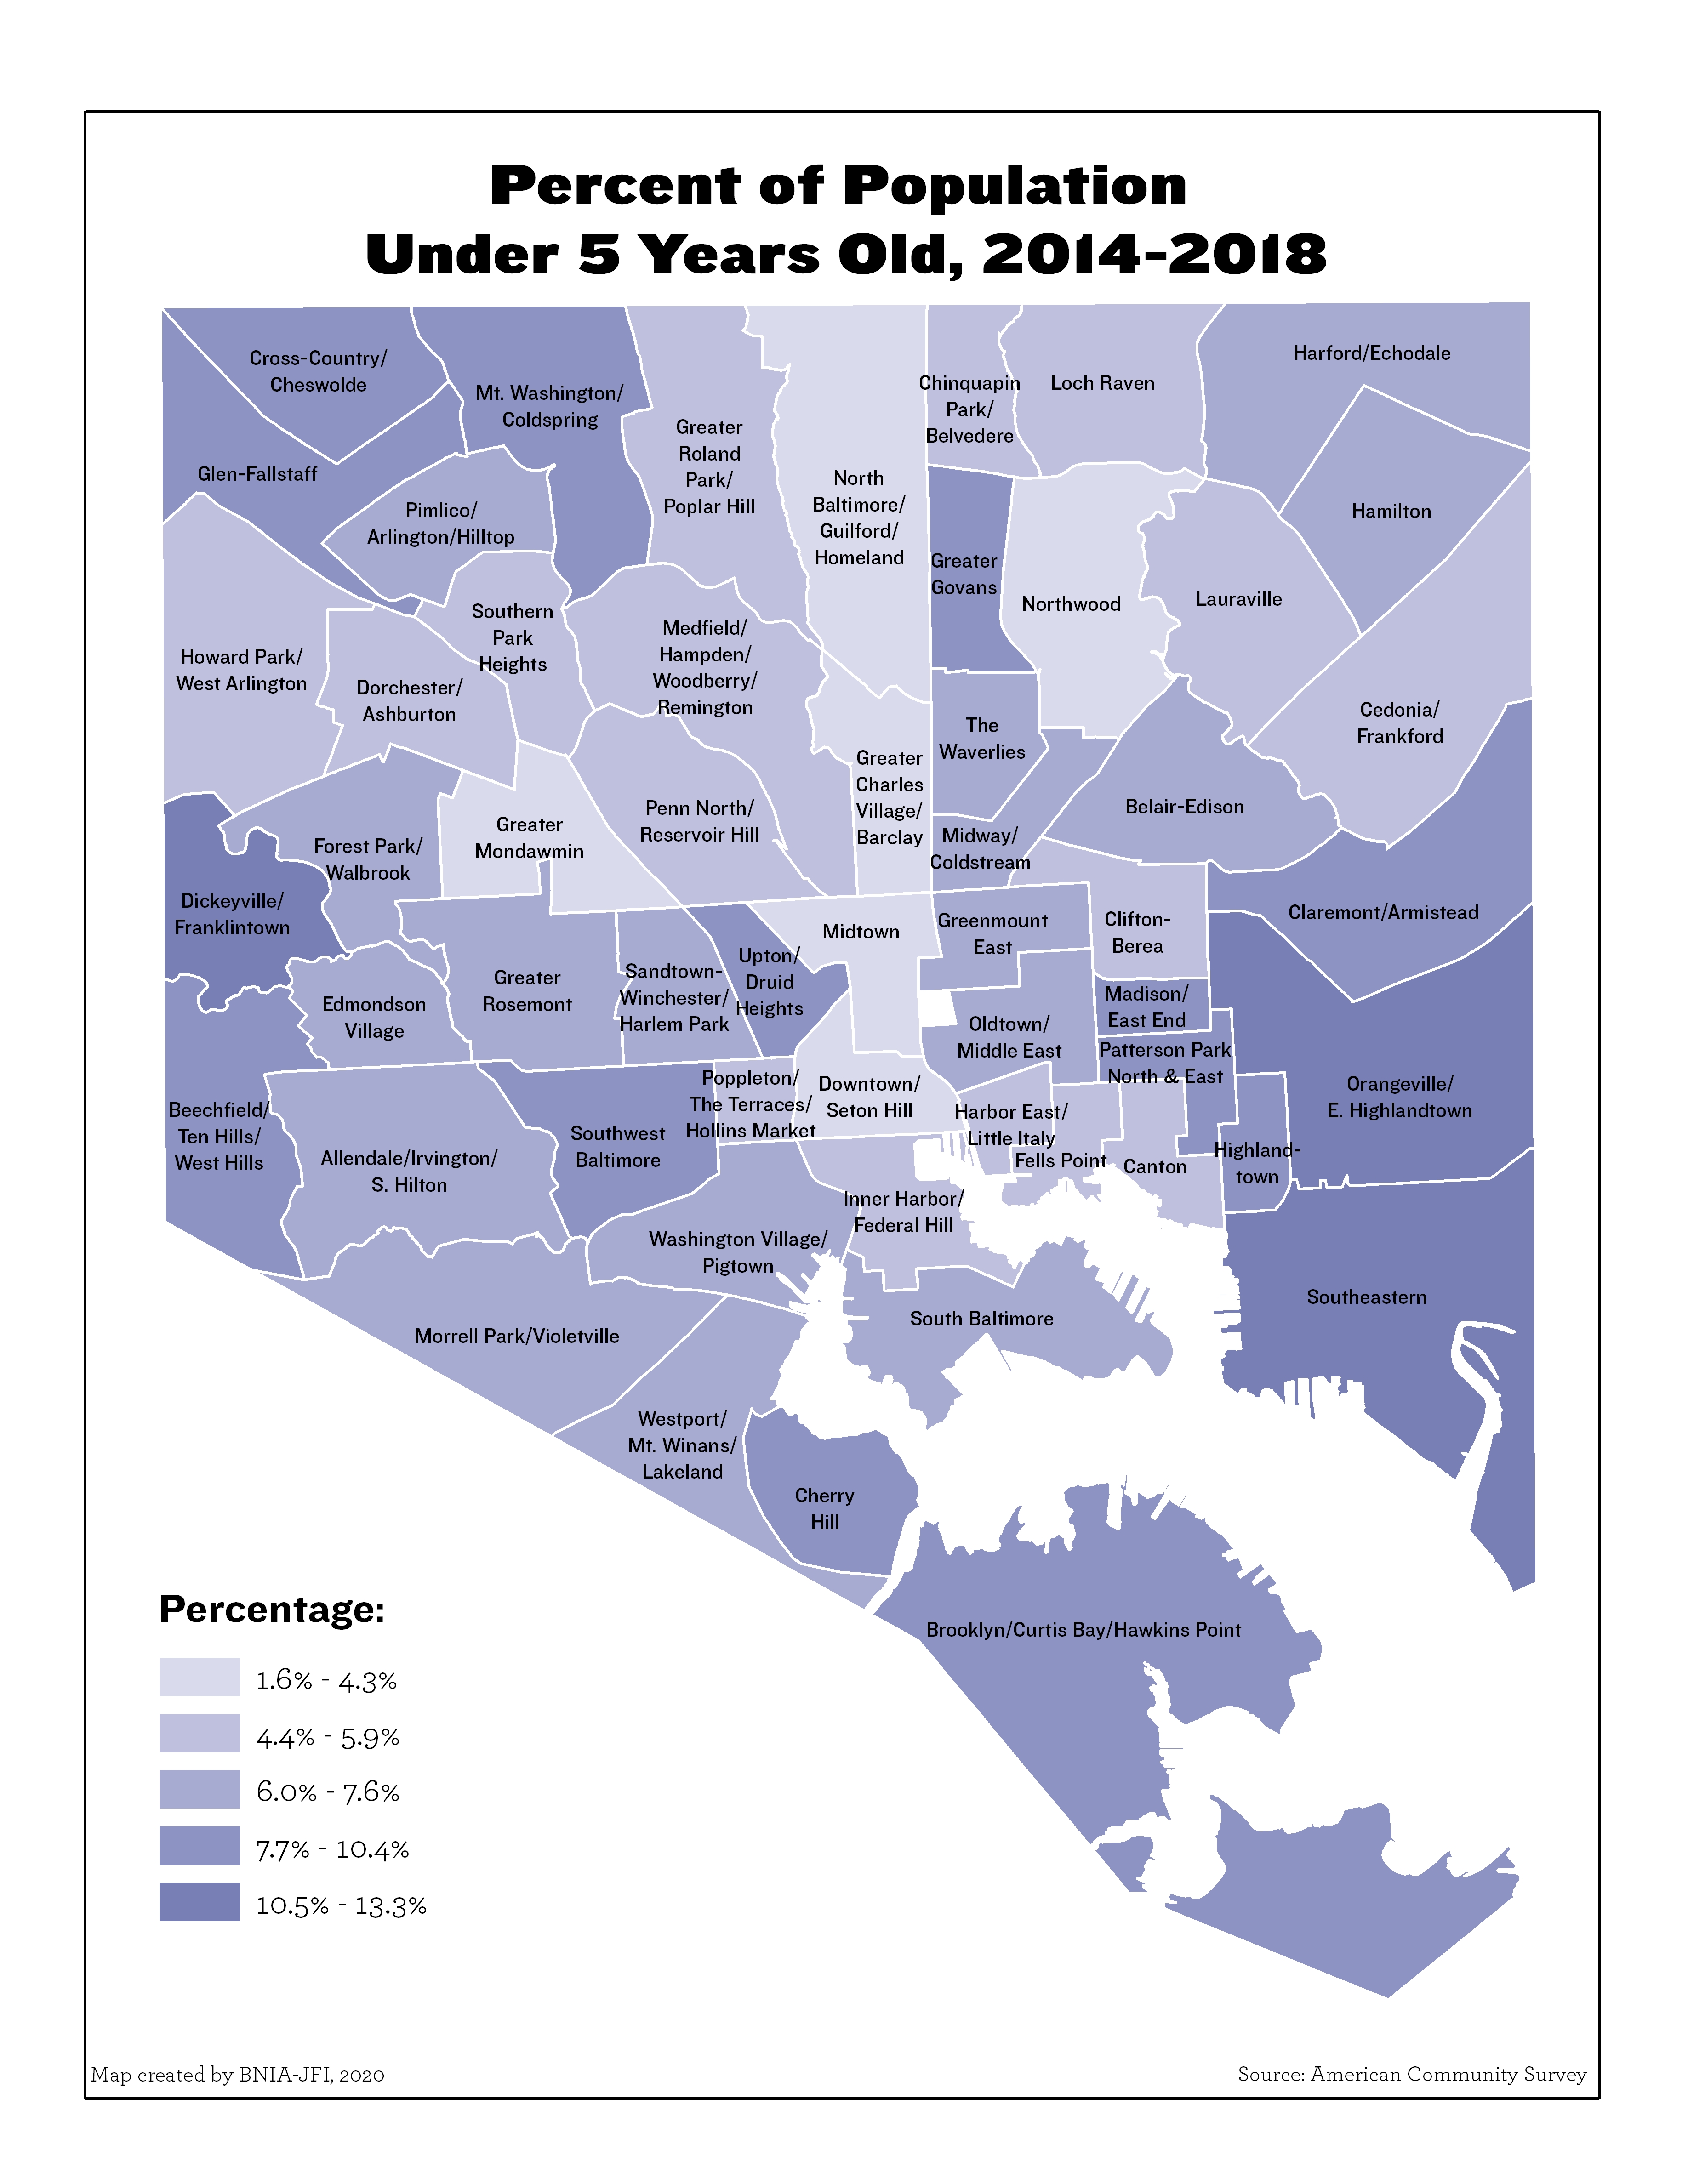
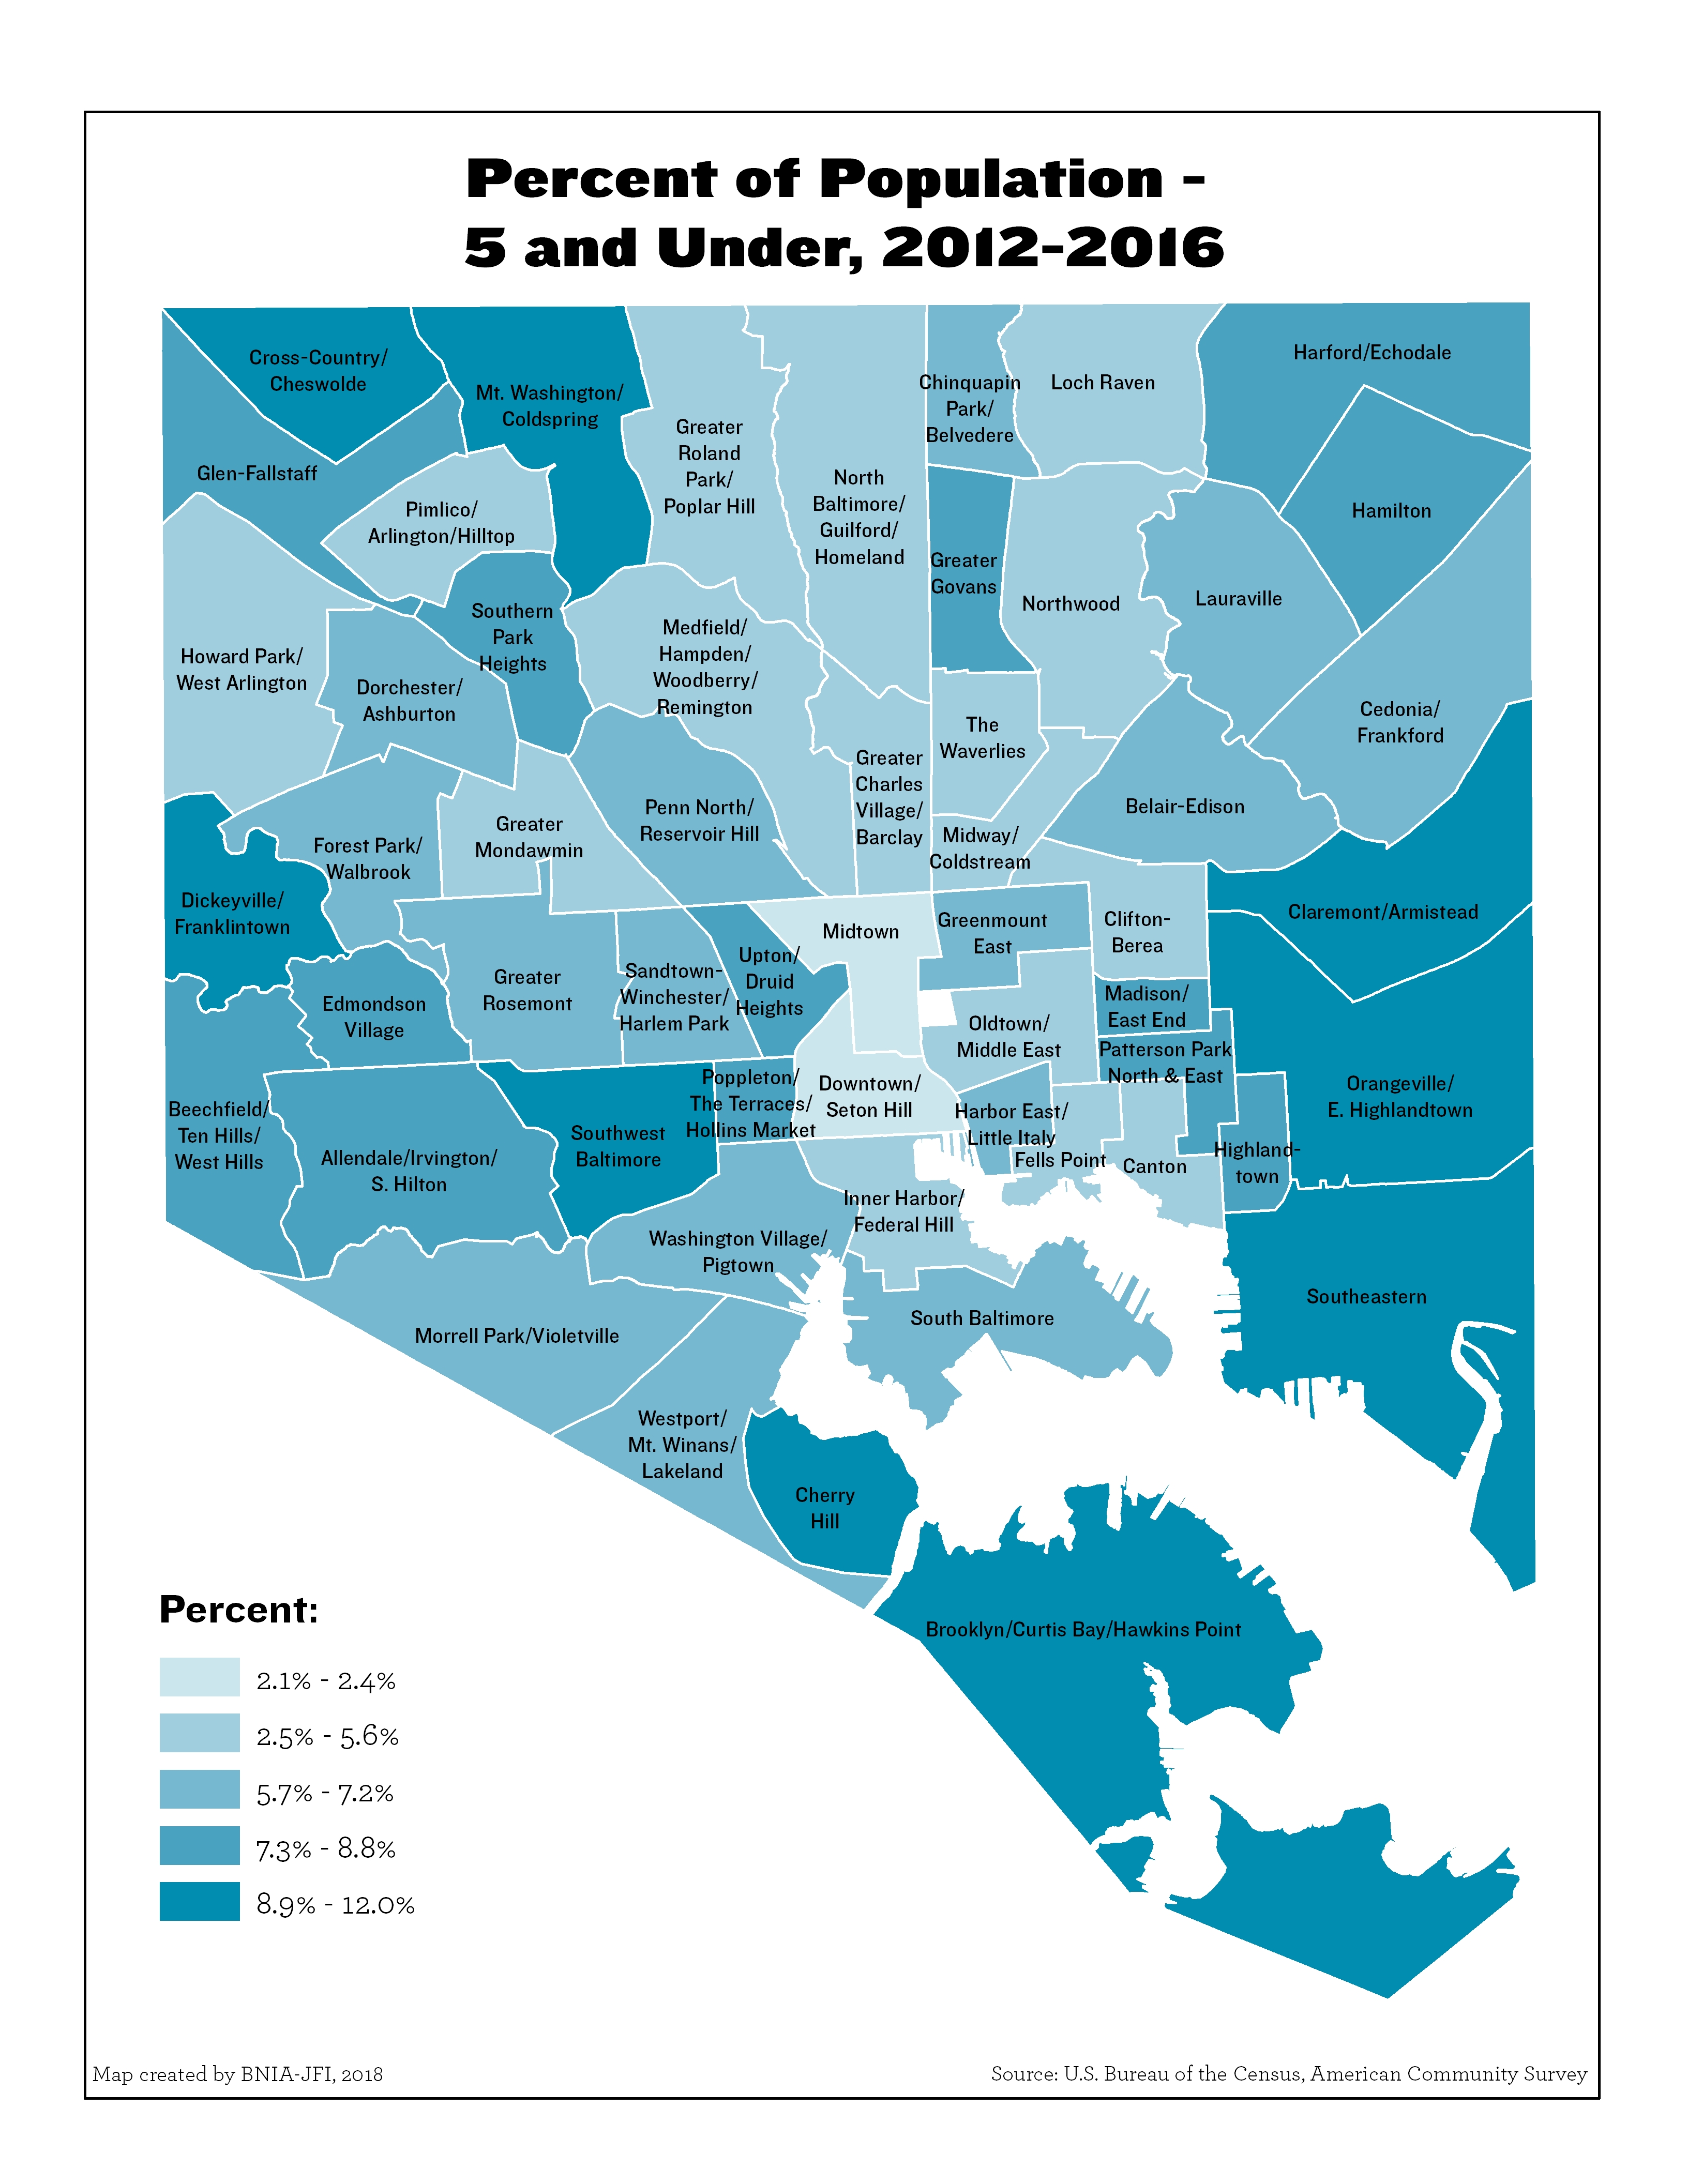
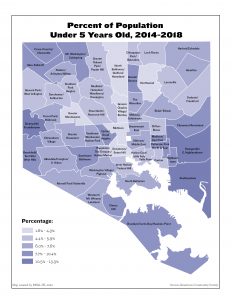
Percent of Population Under 5 Years Old
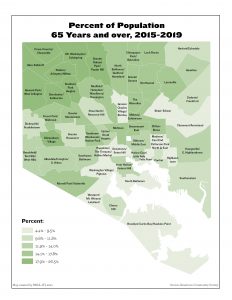
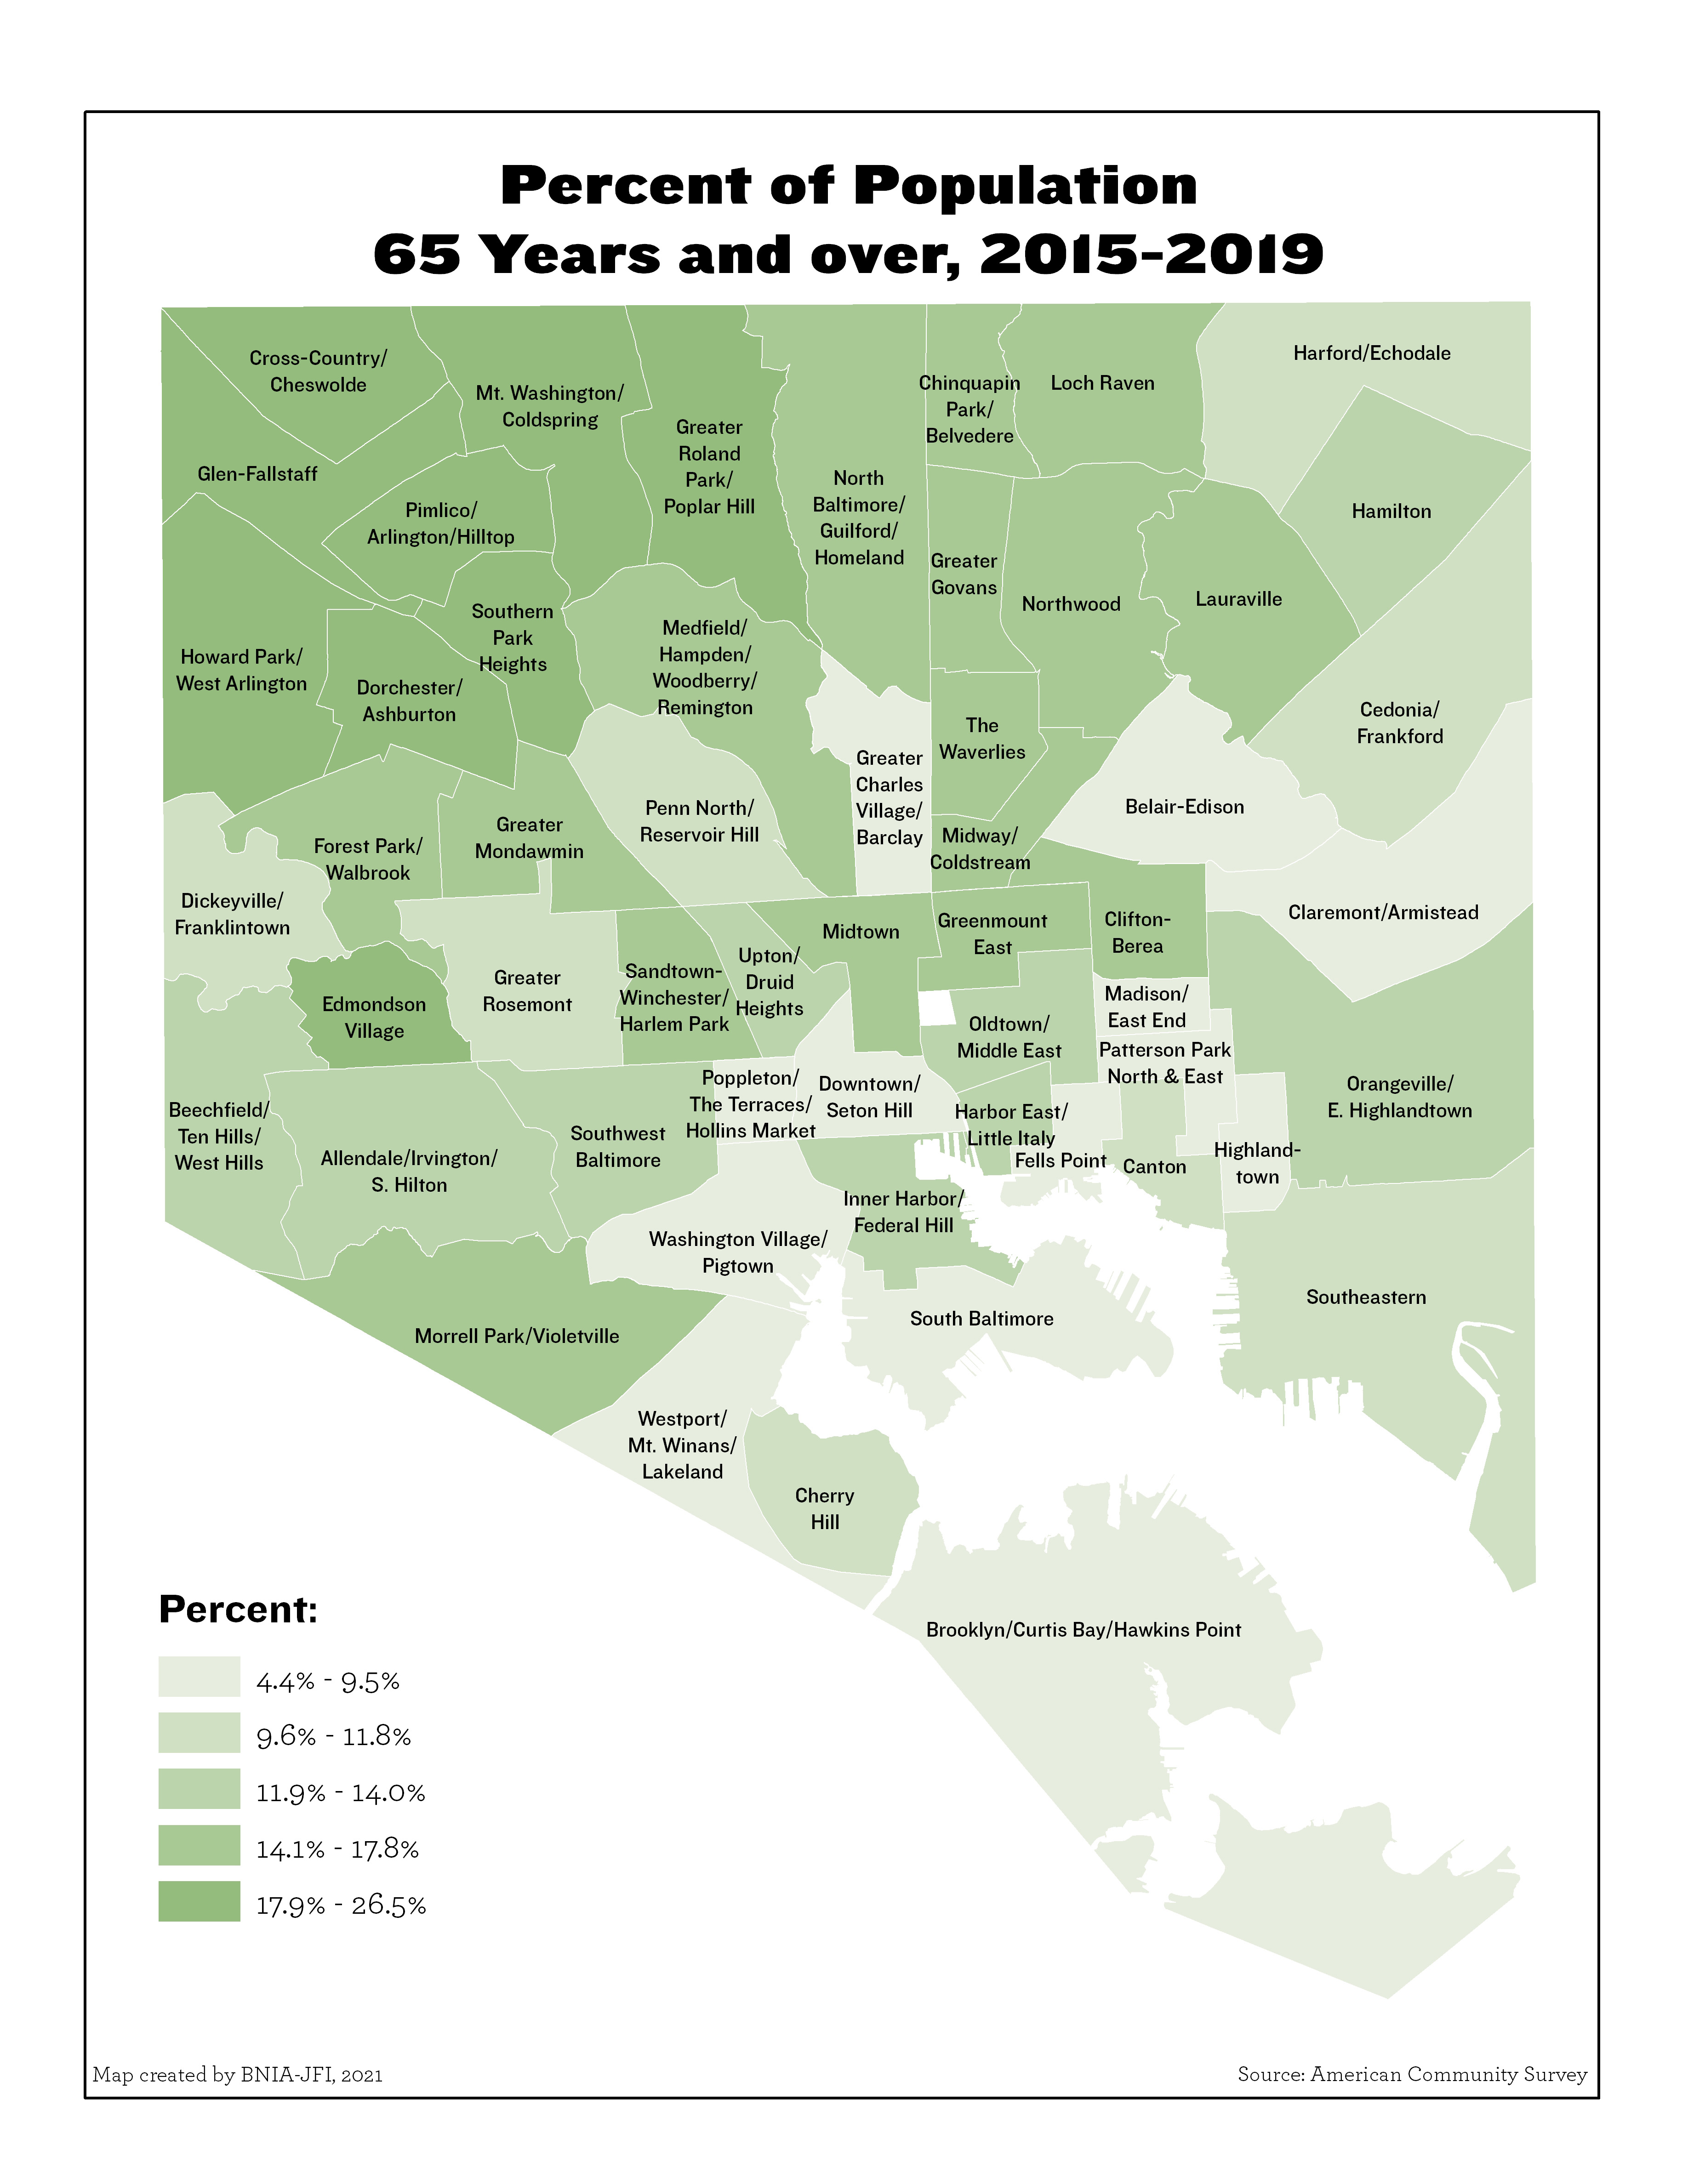
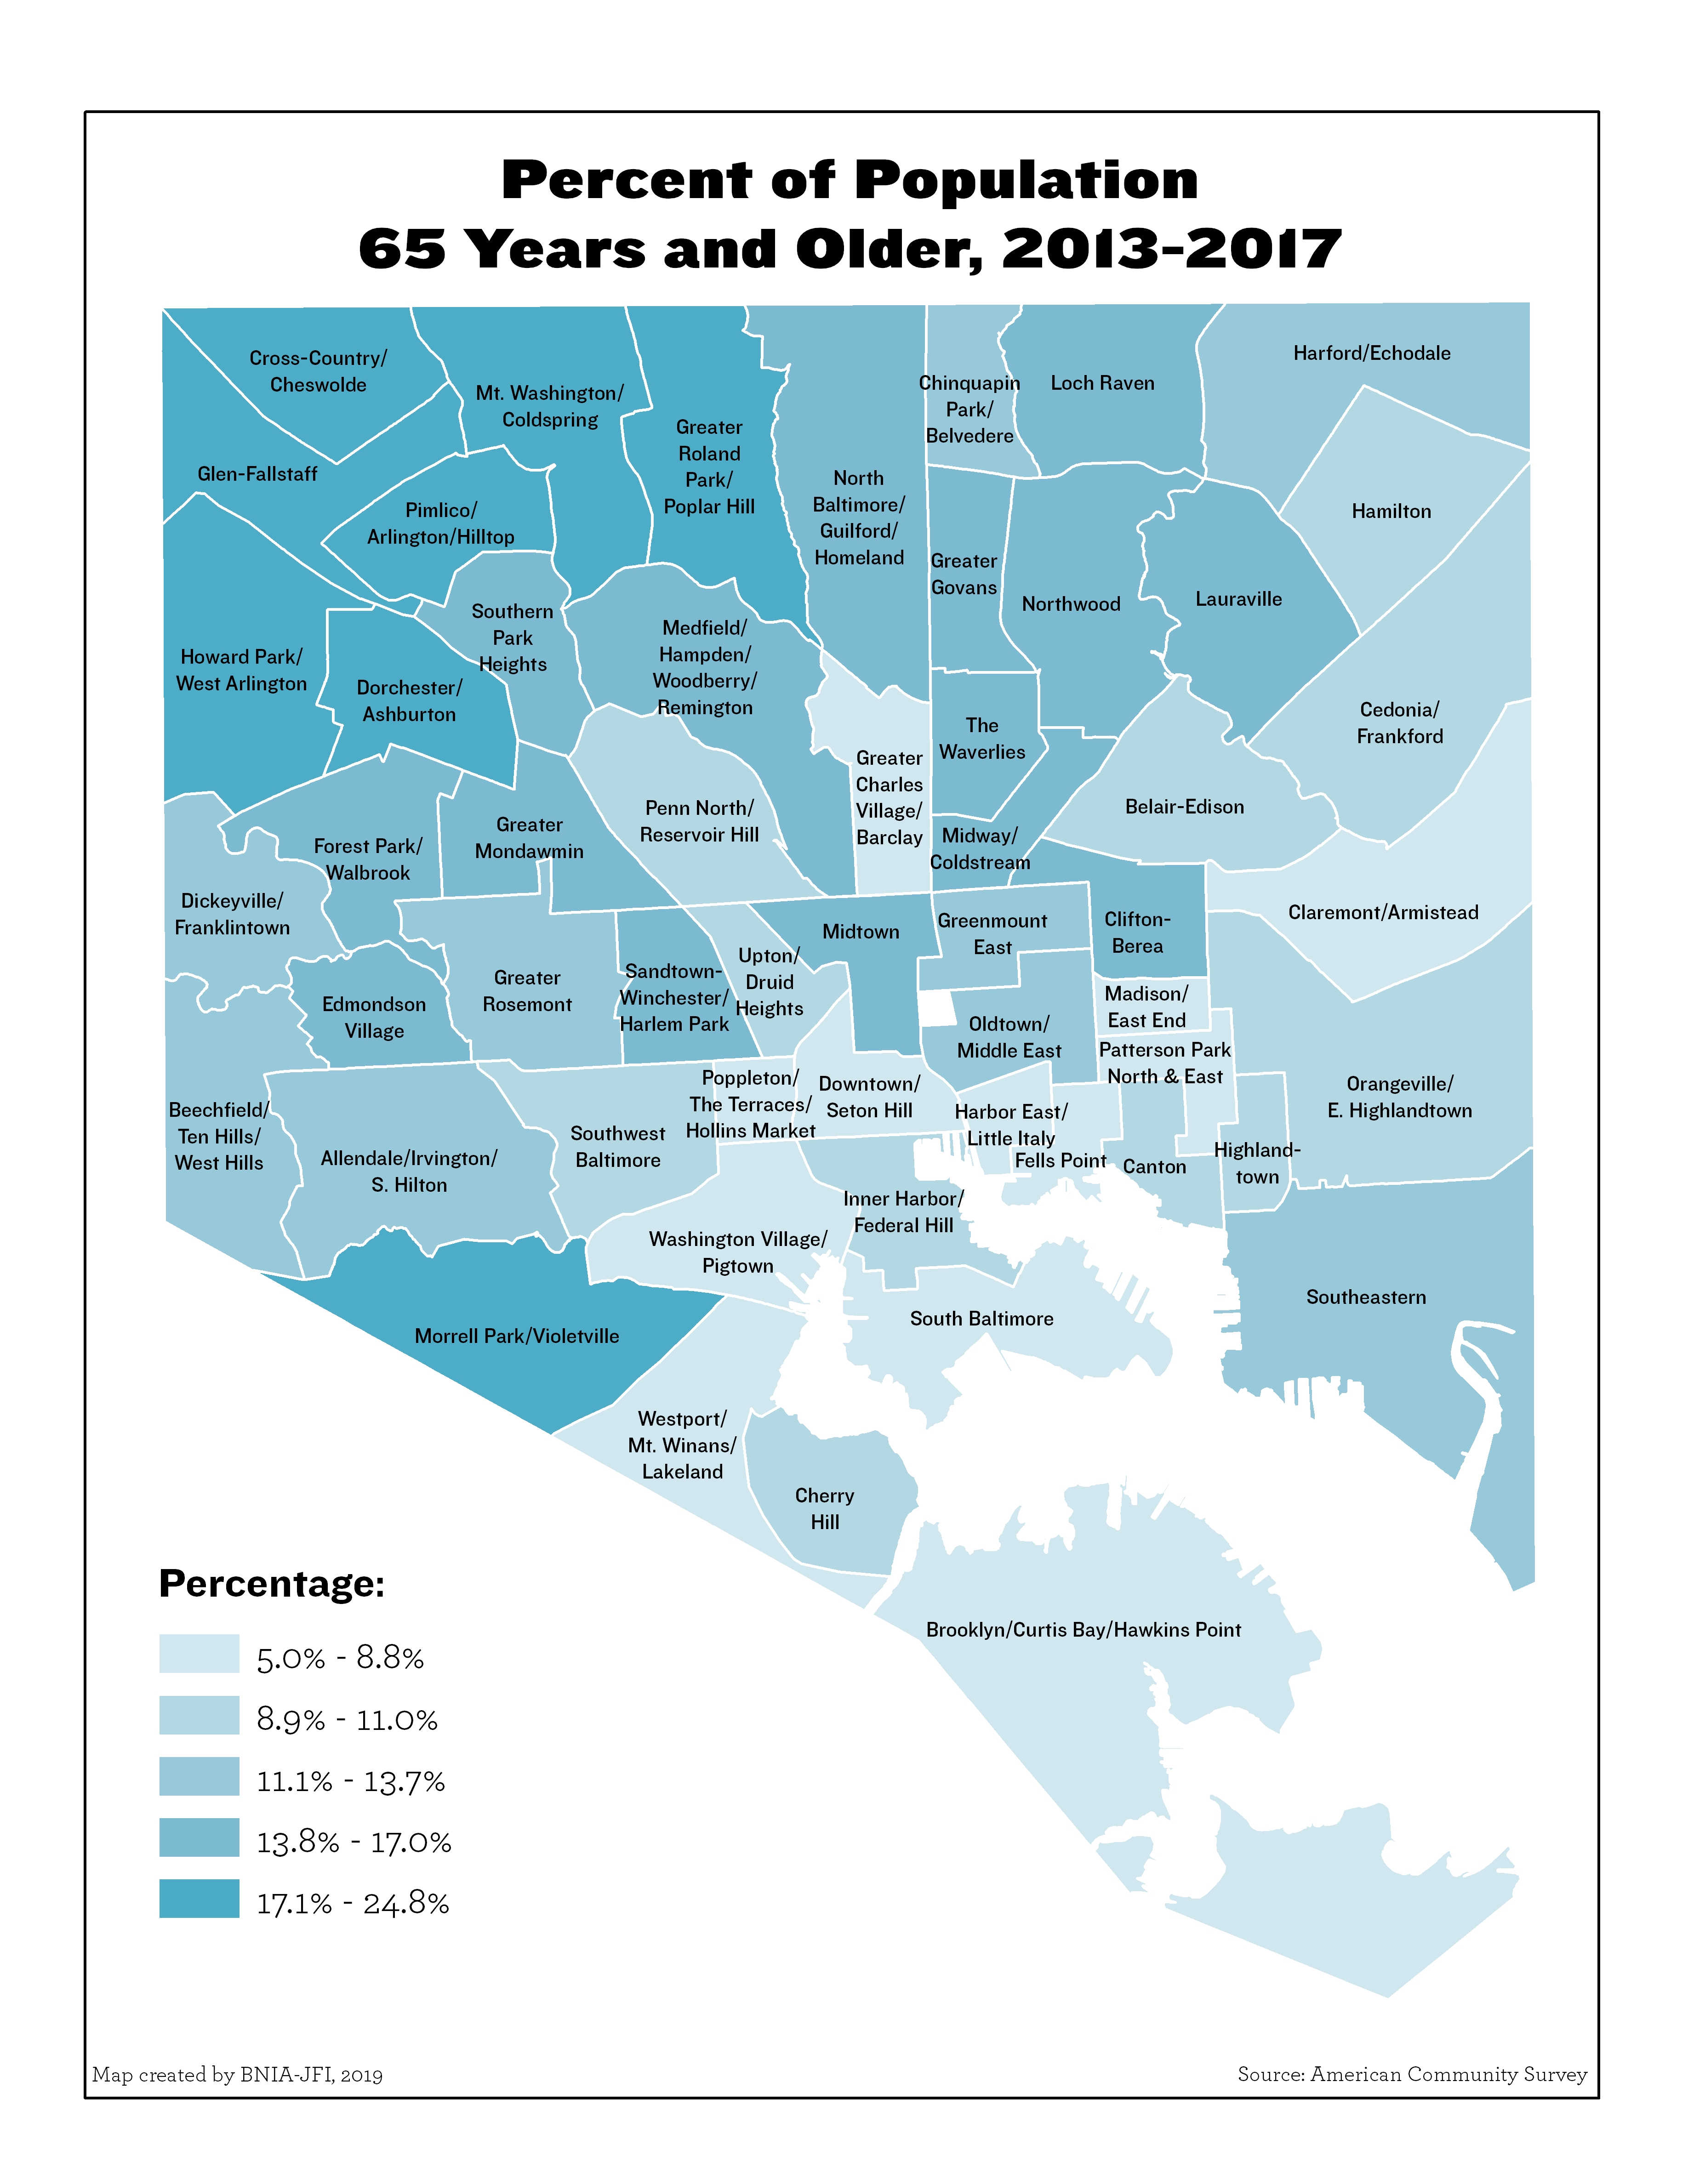
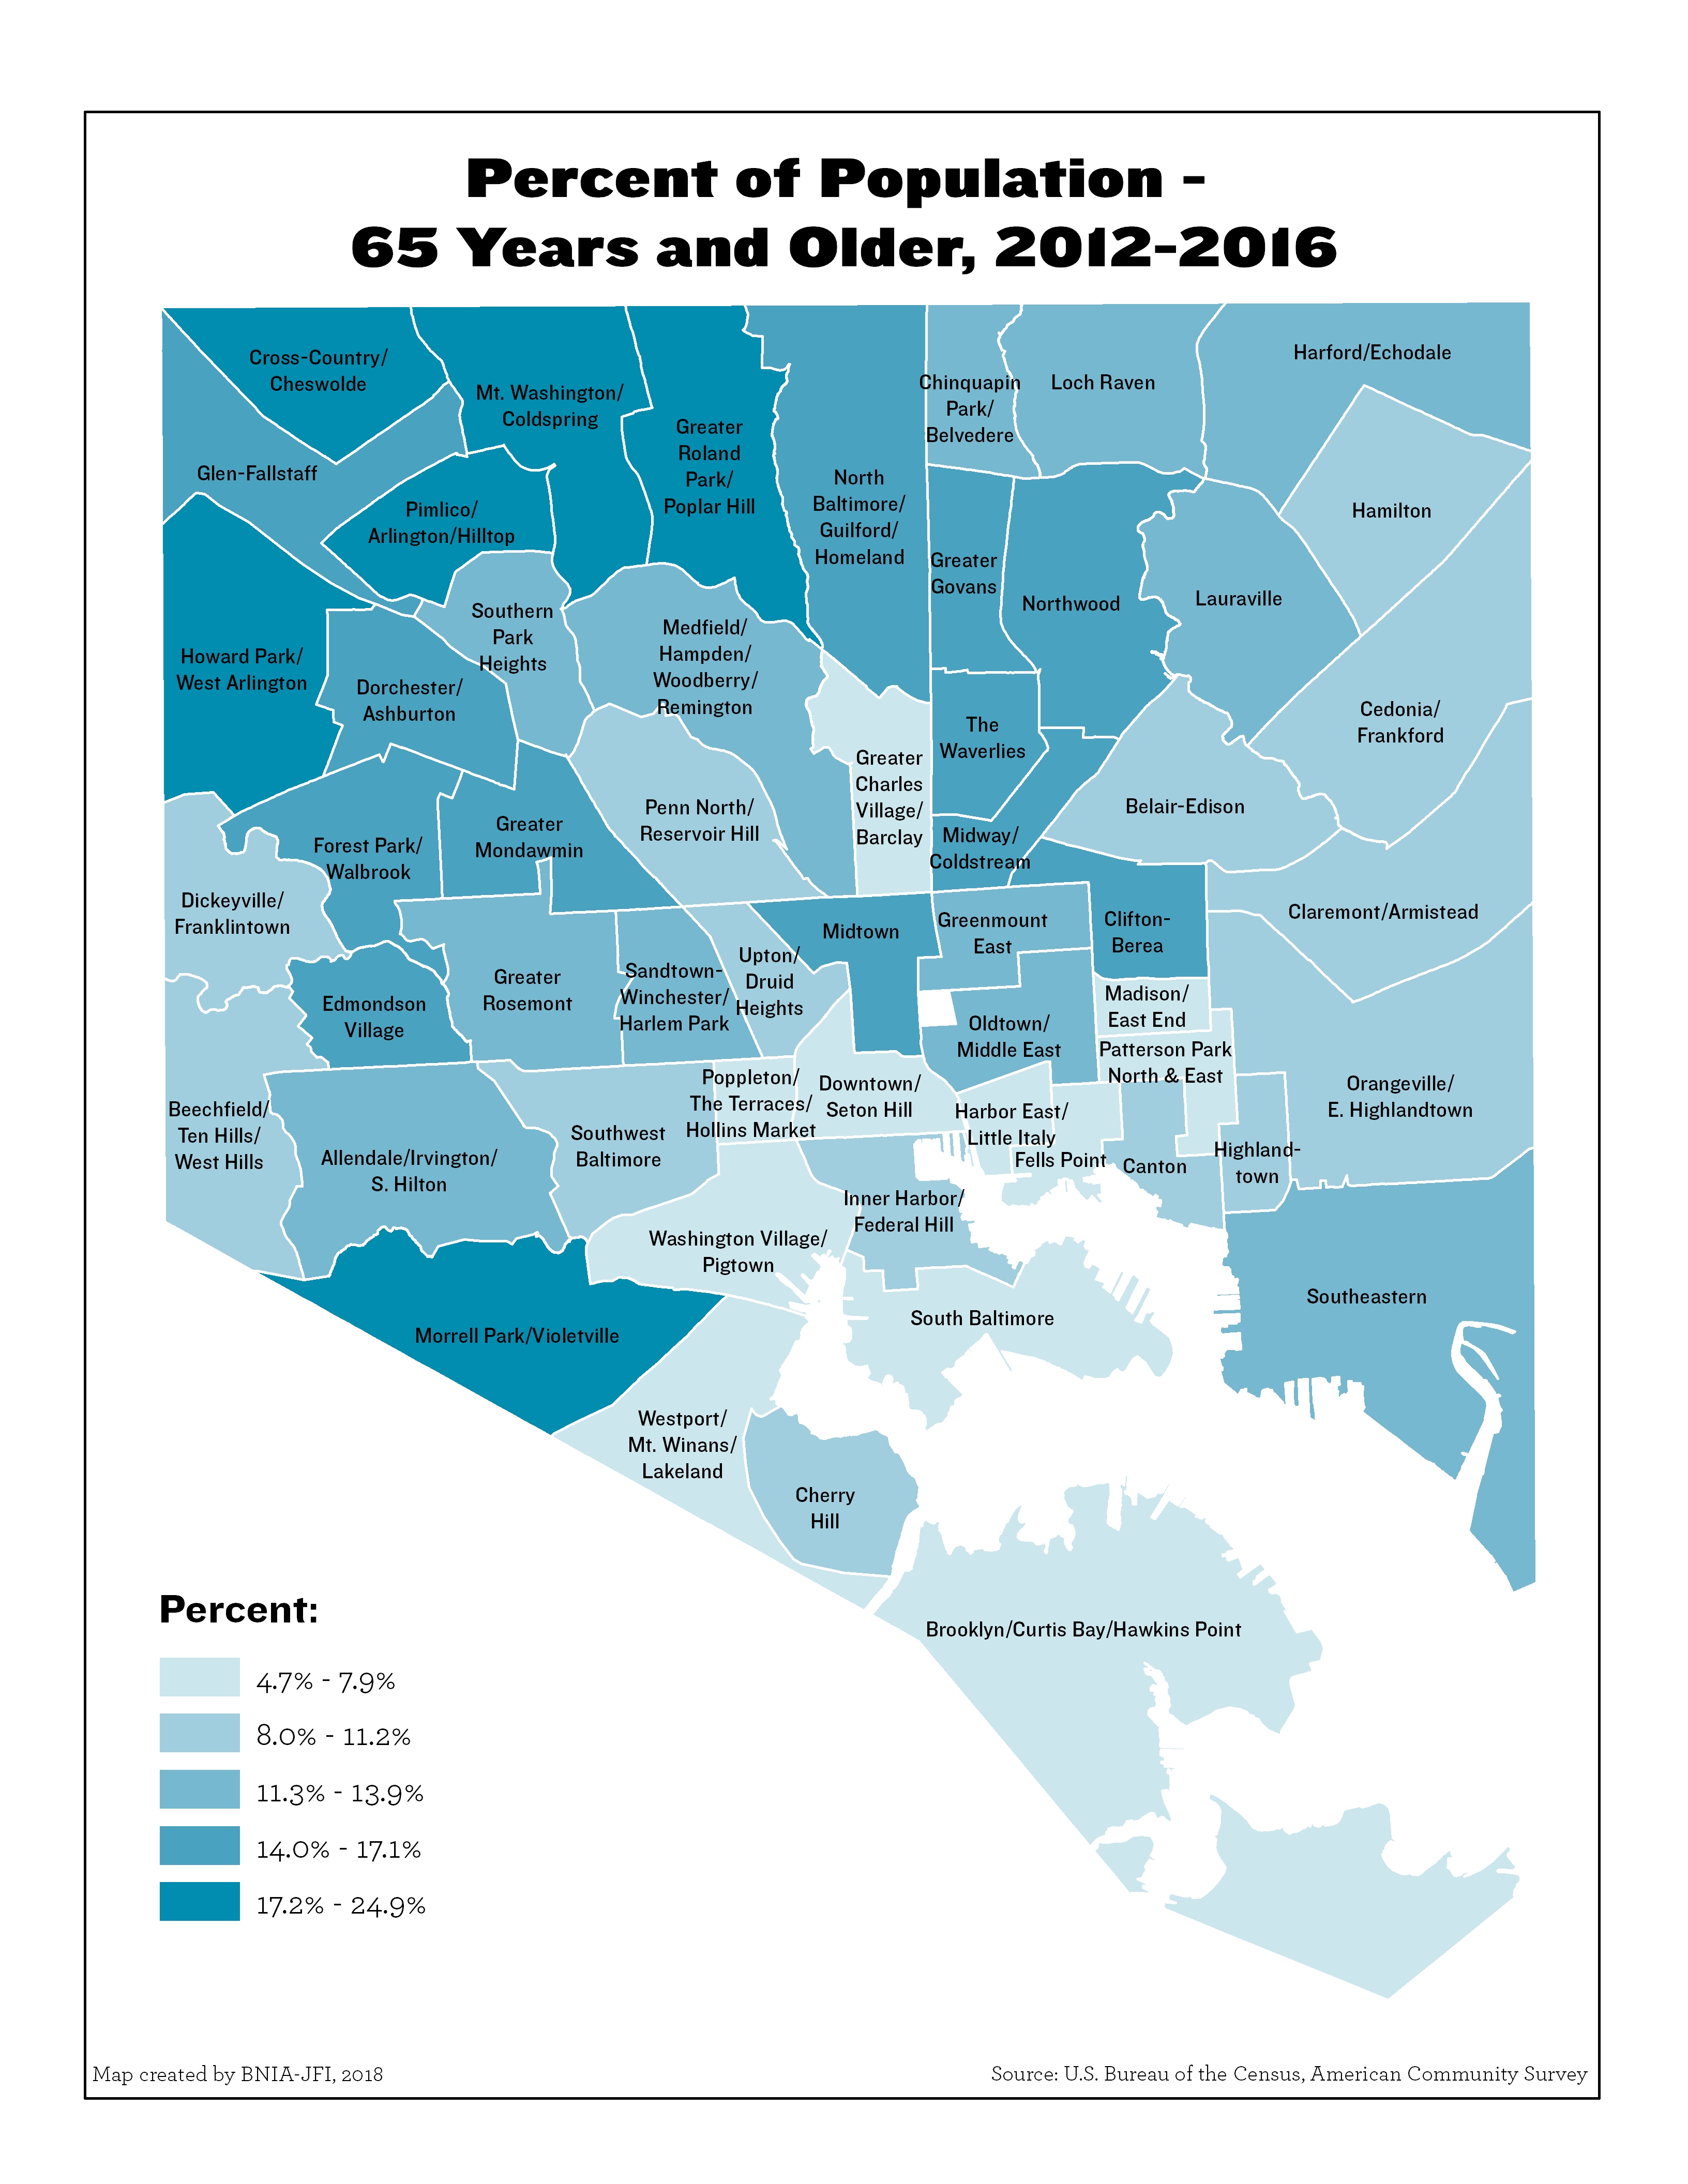
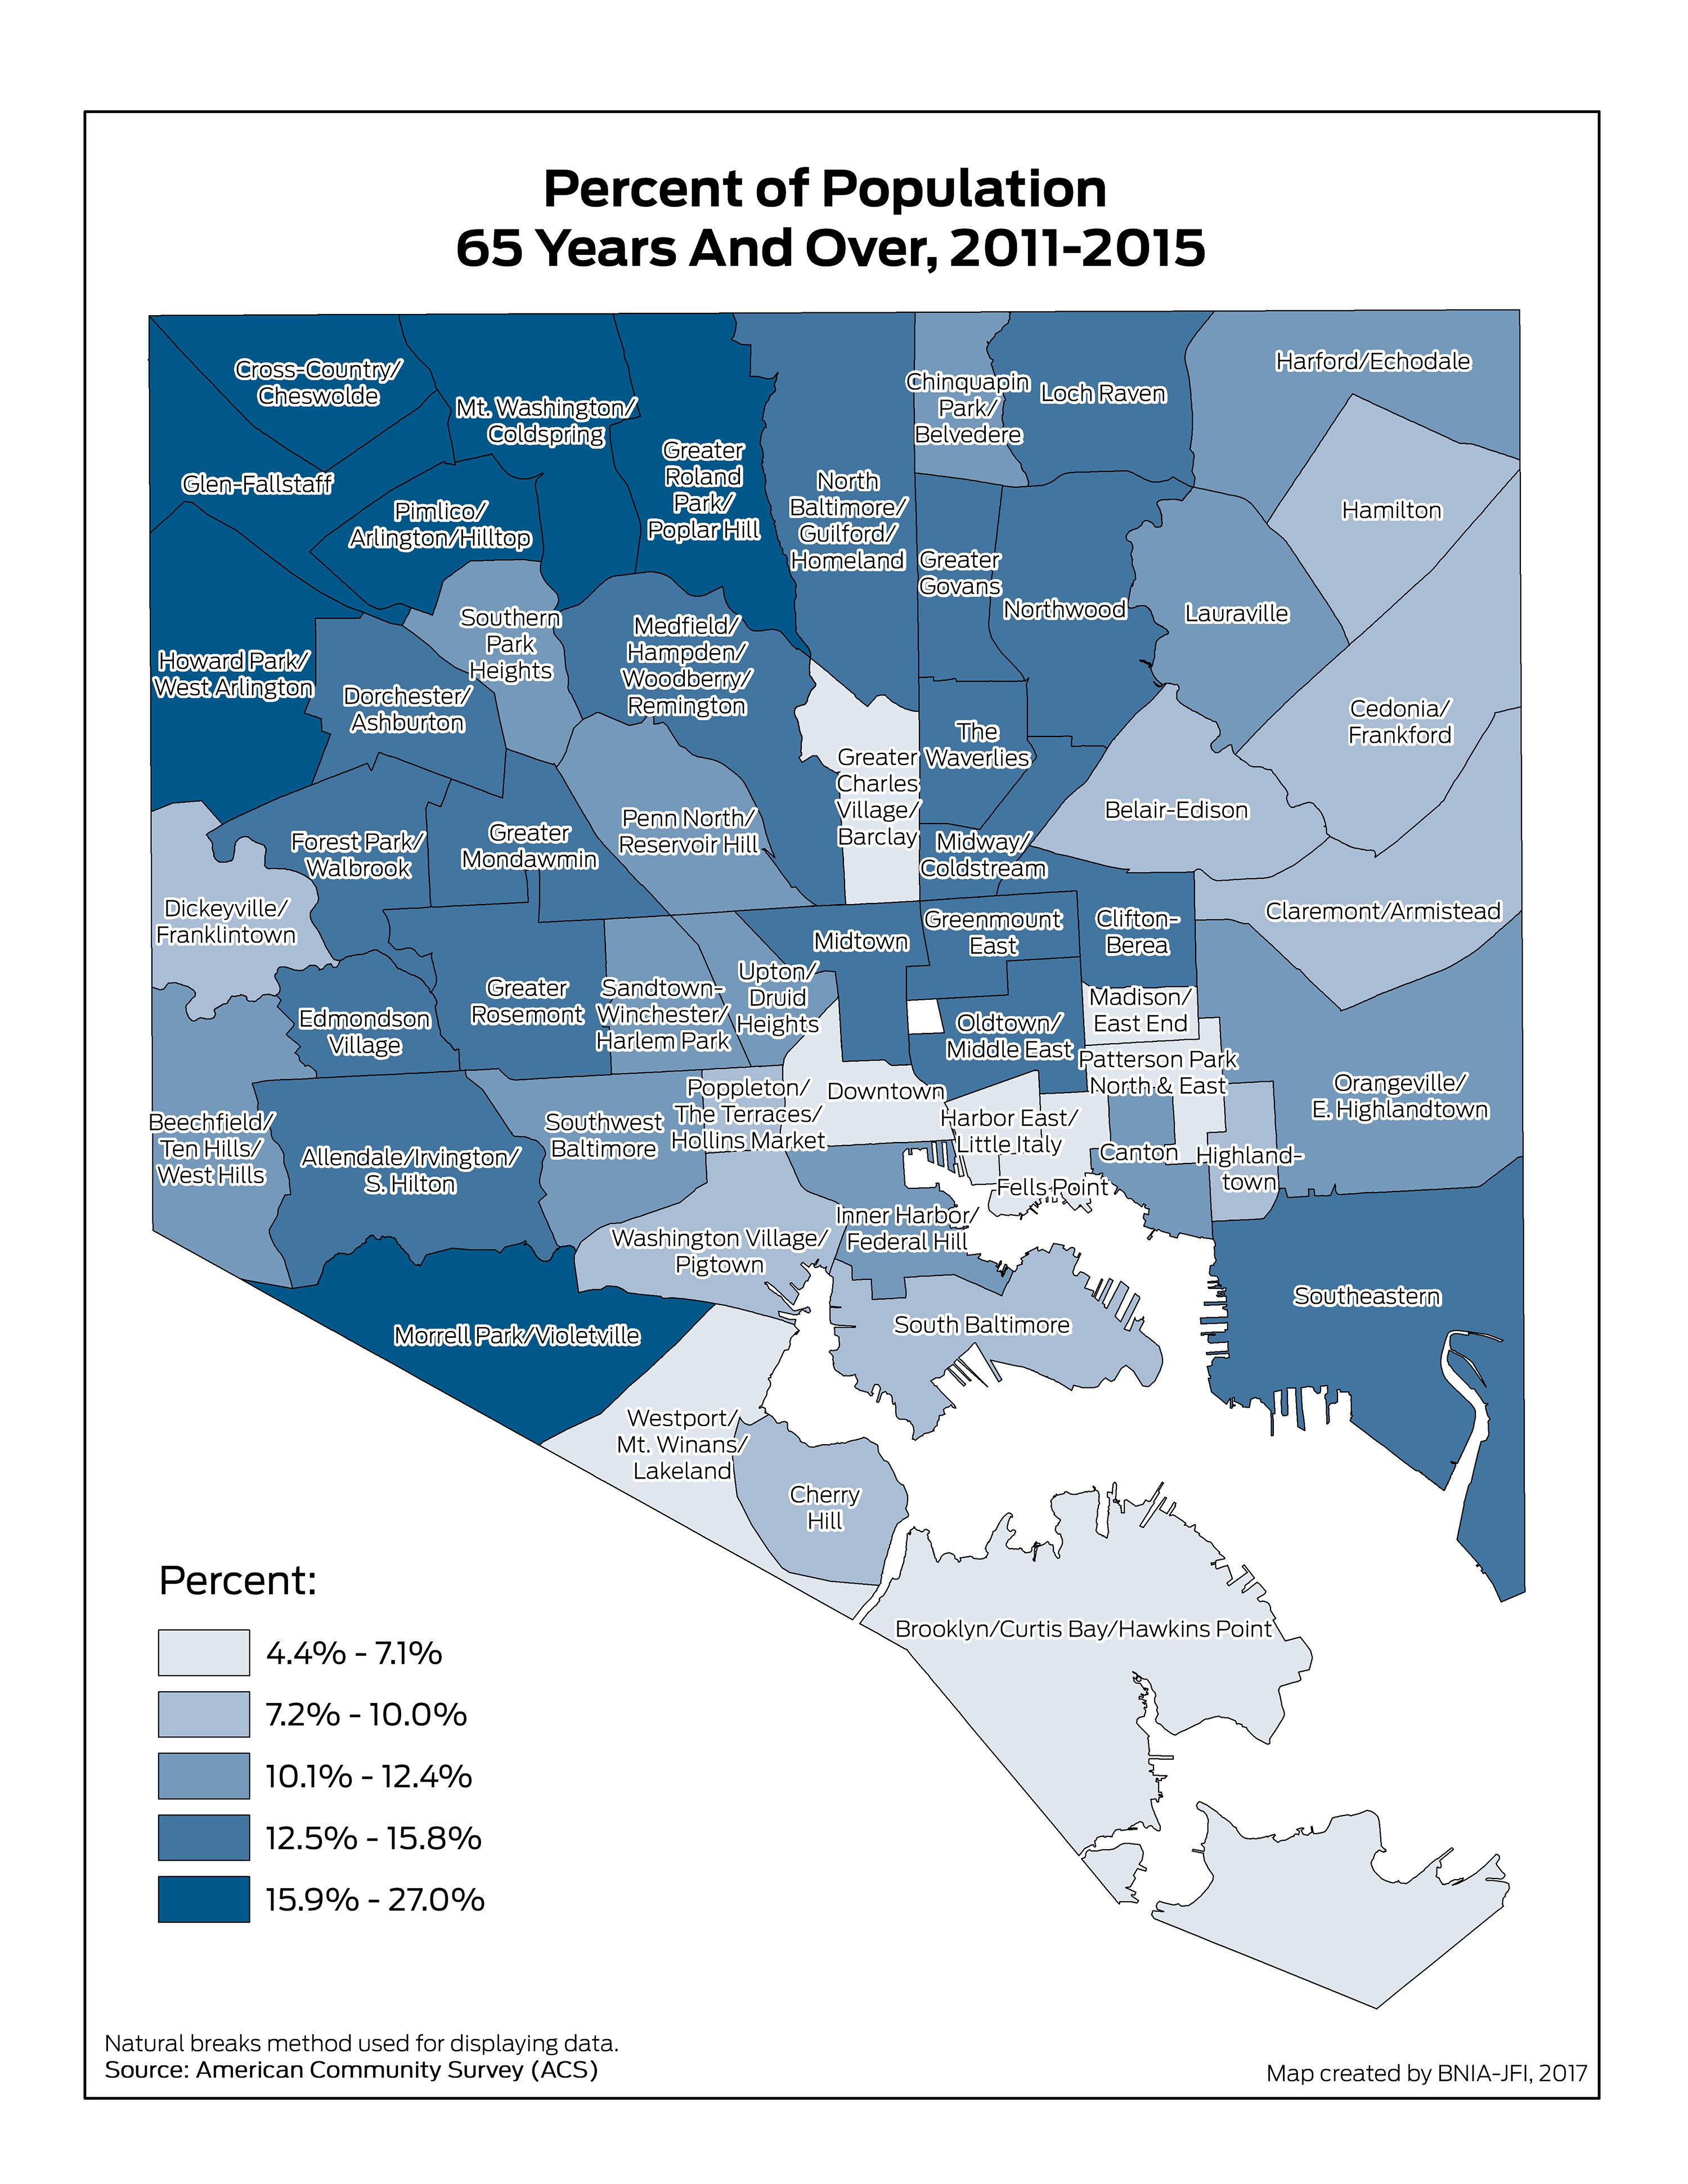
Percent of Population 65 Years and Over
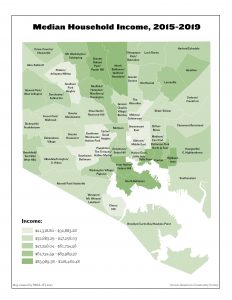
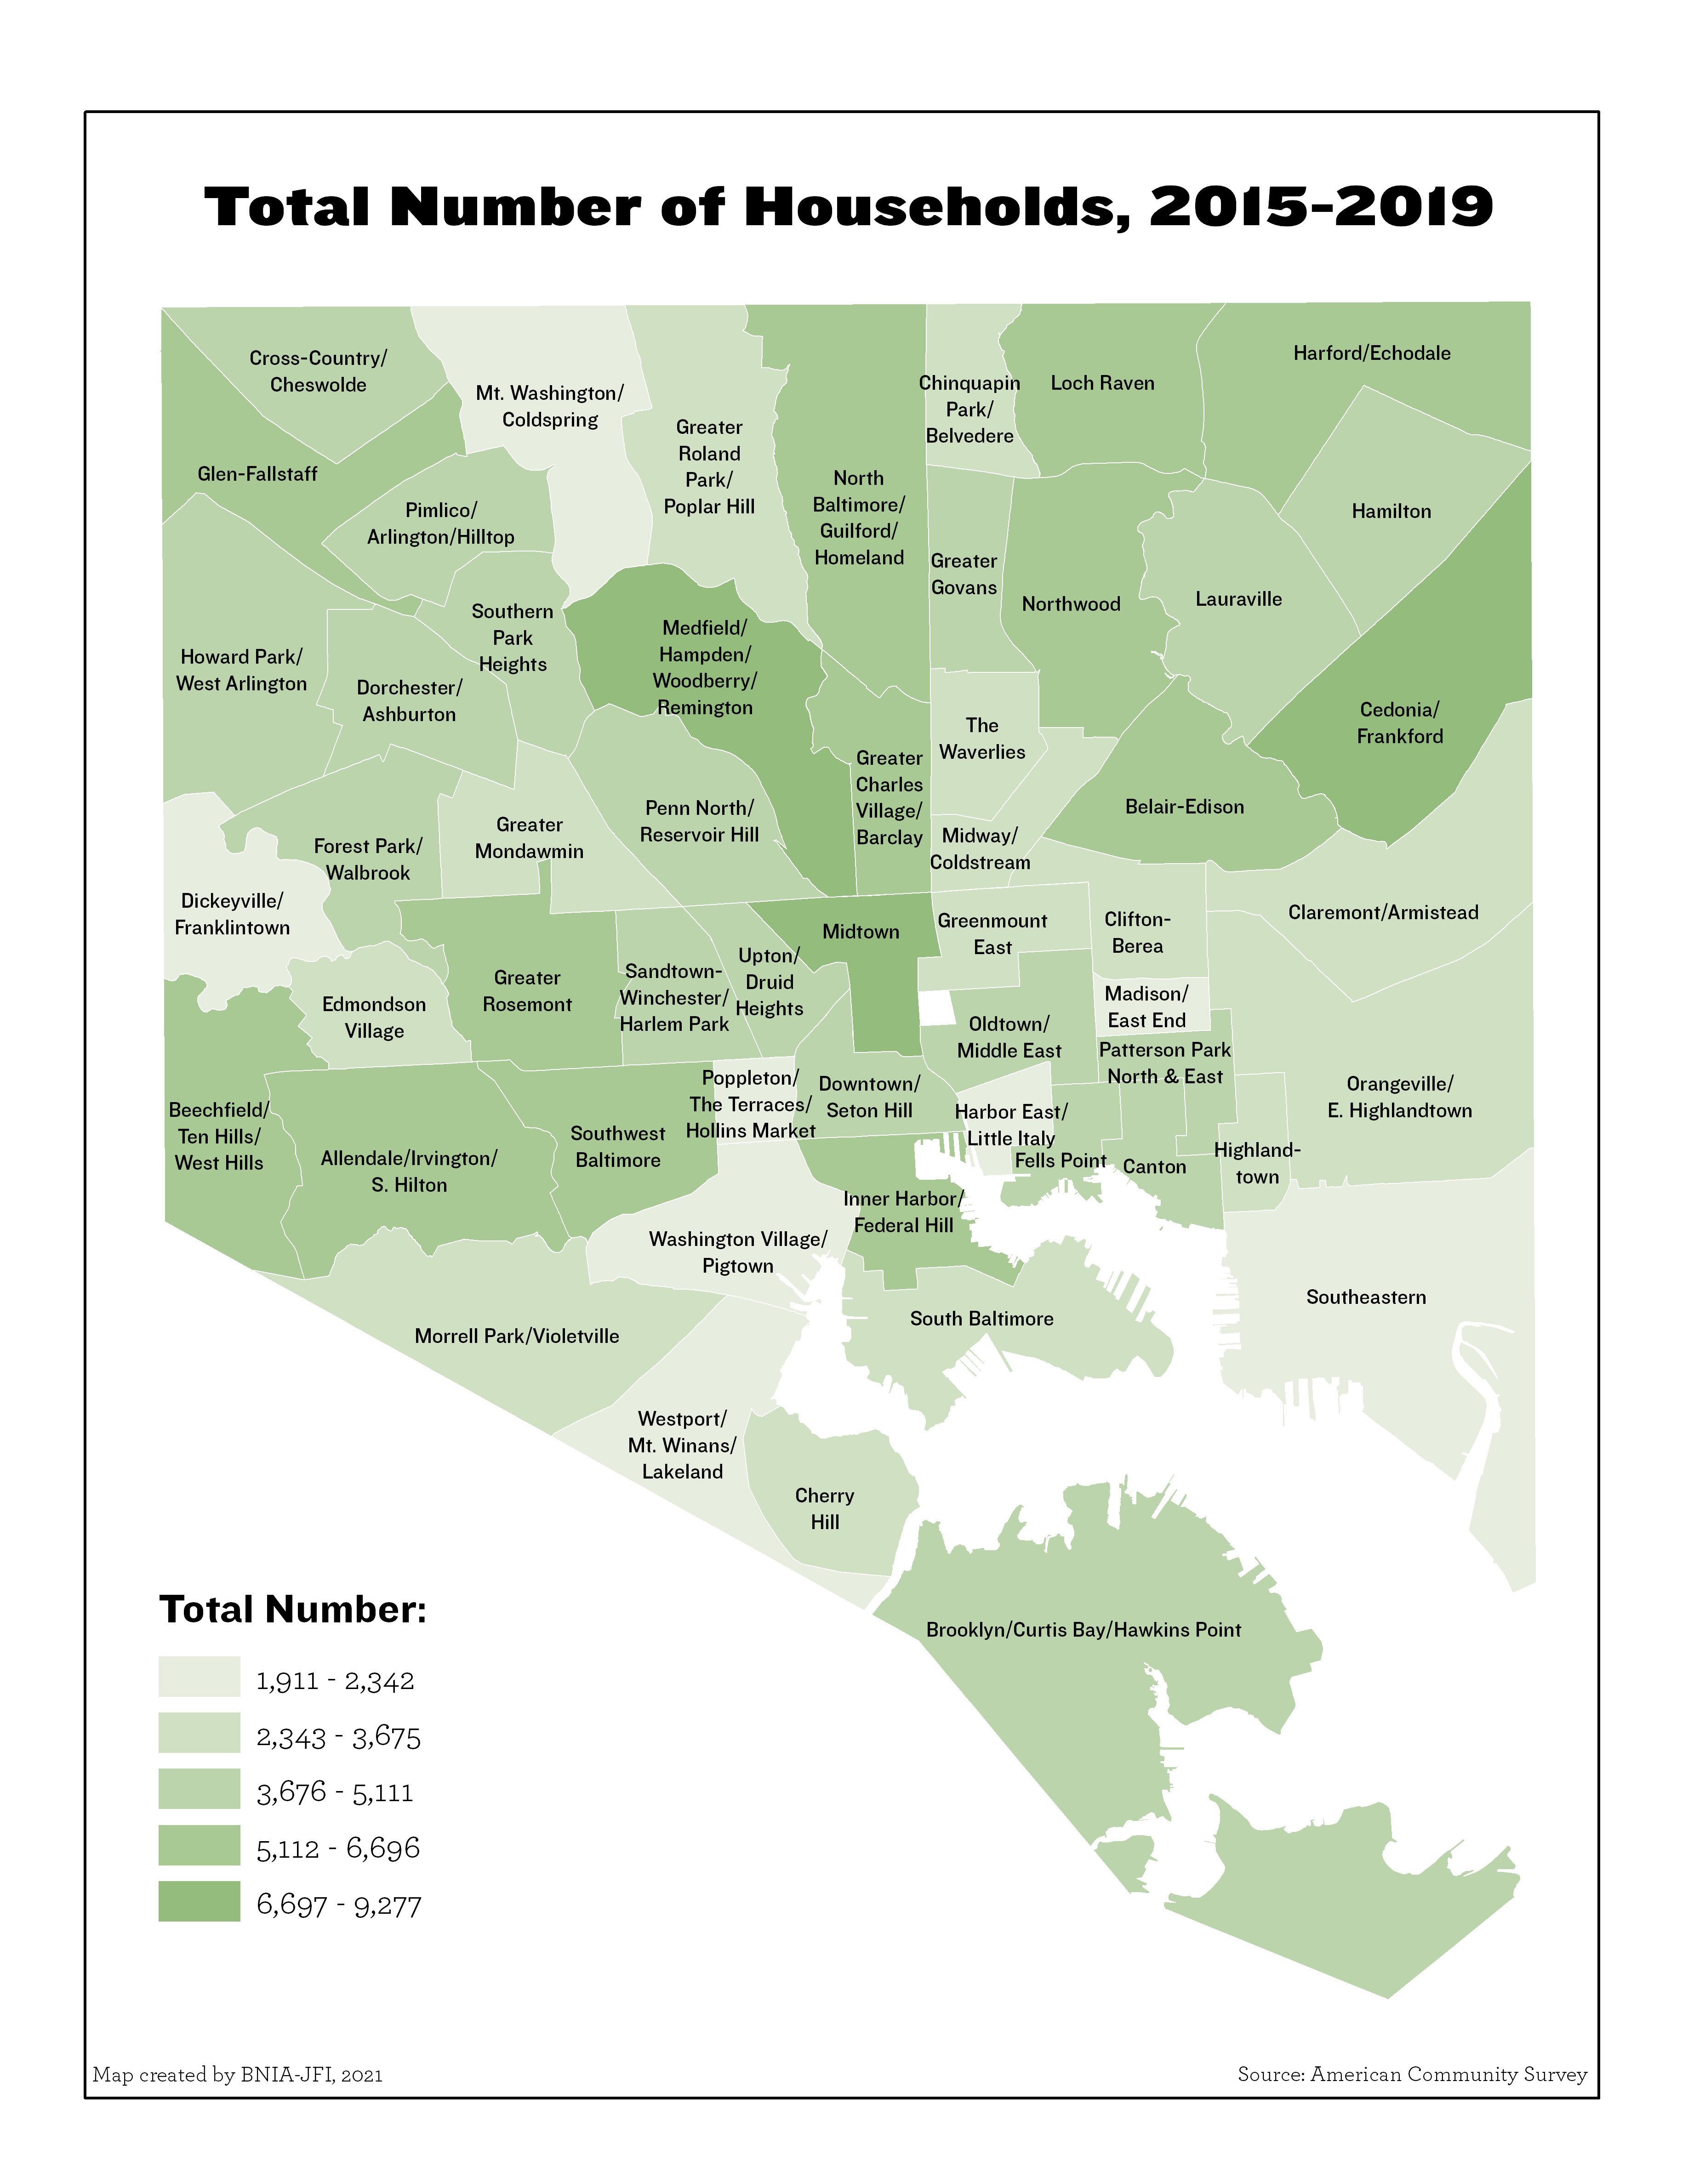
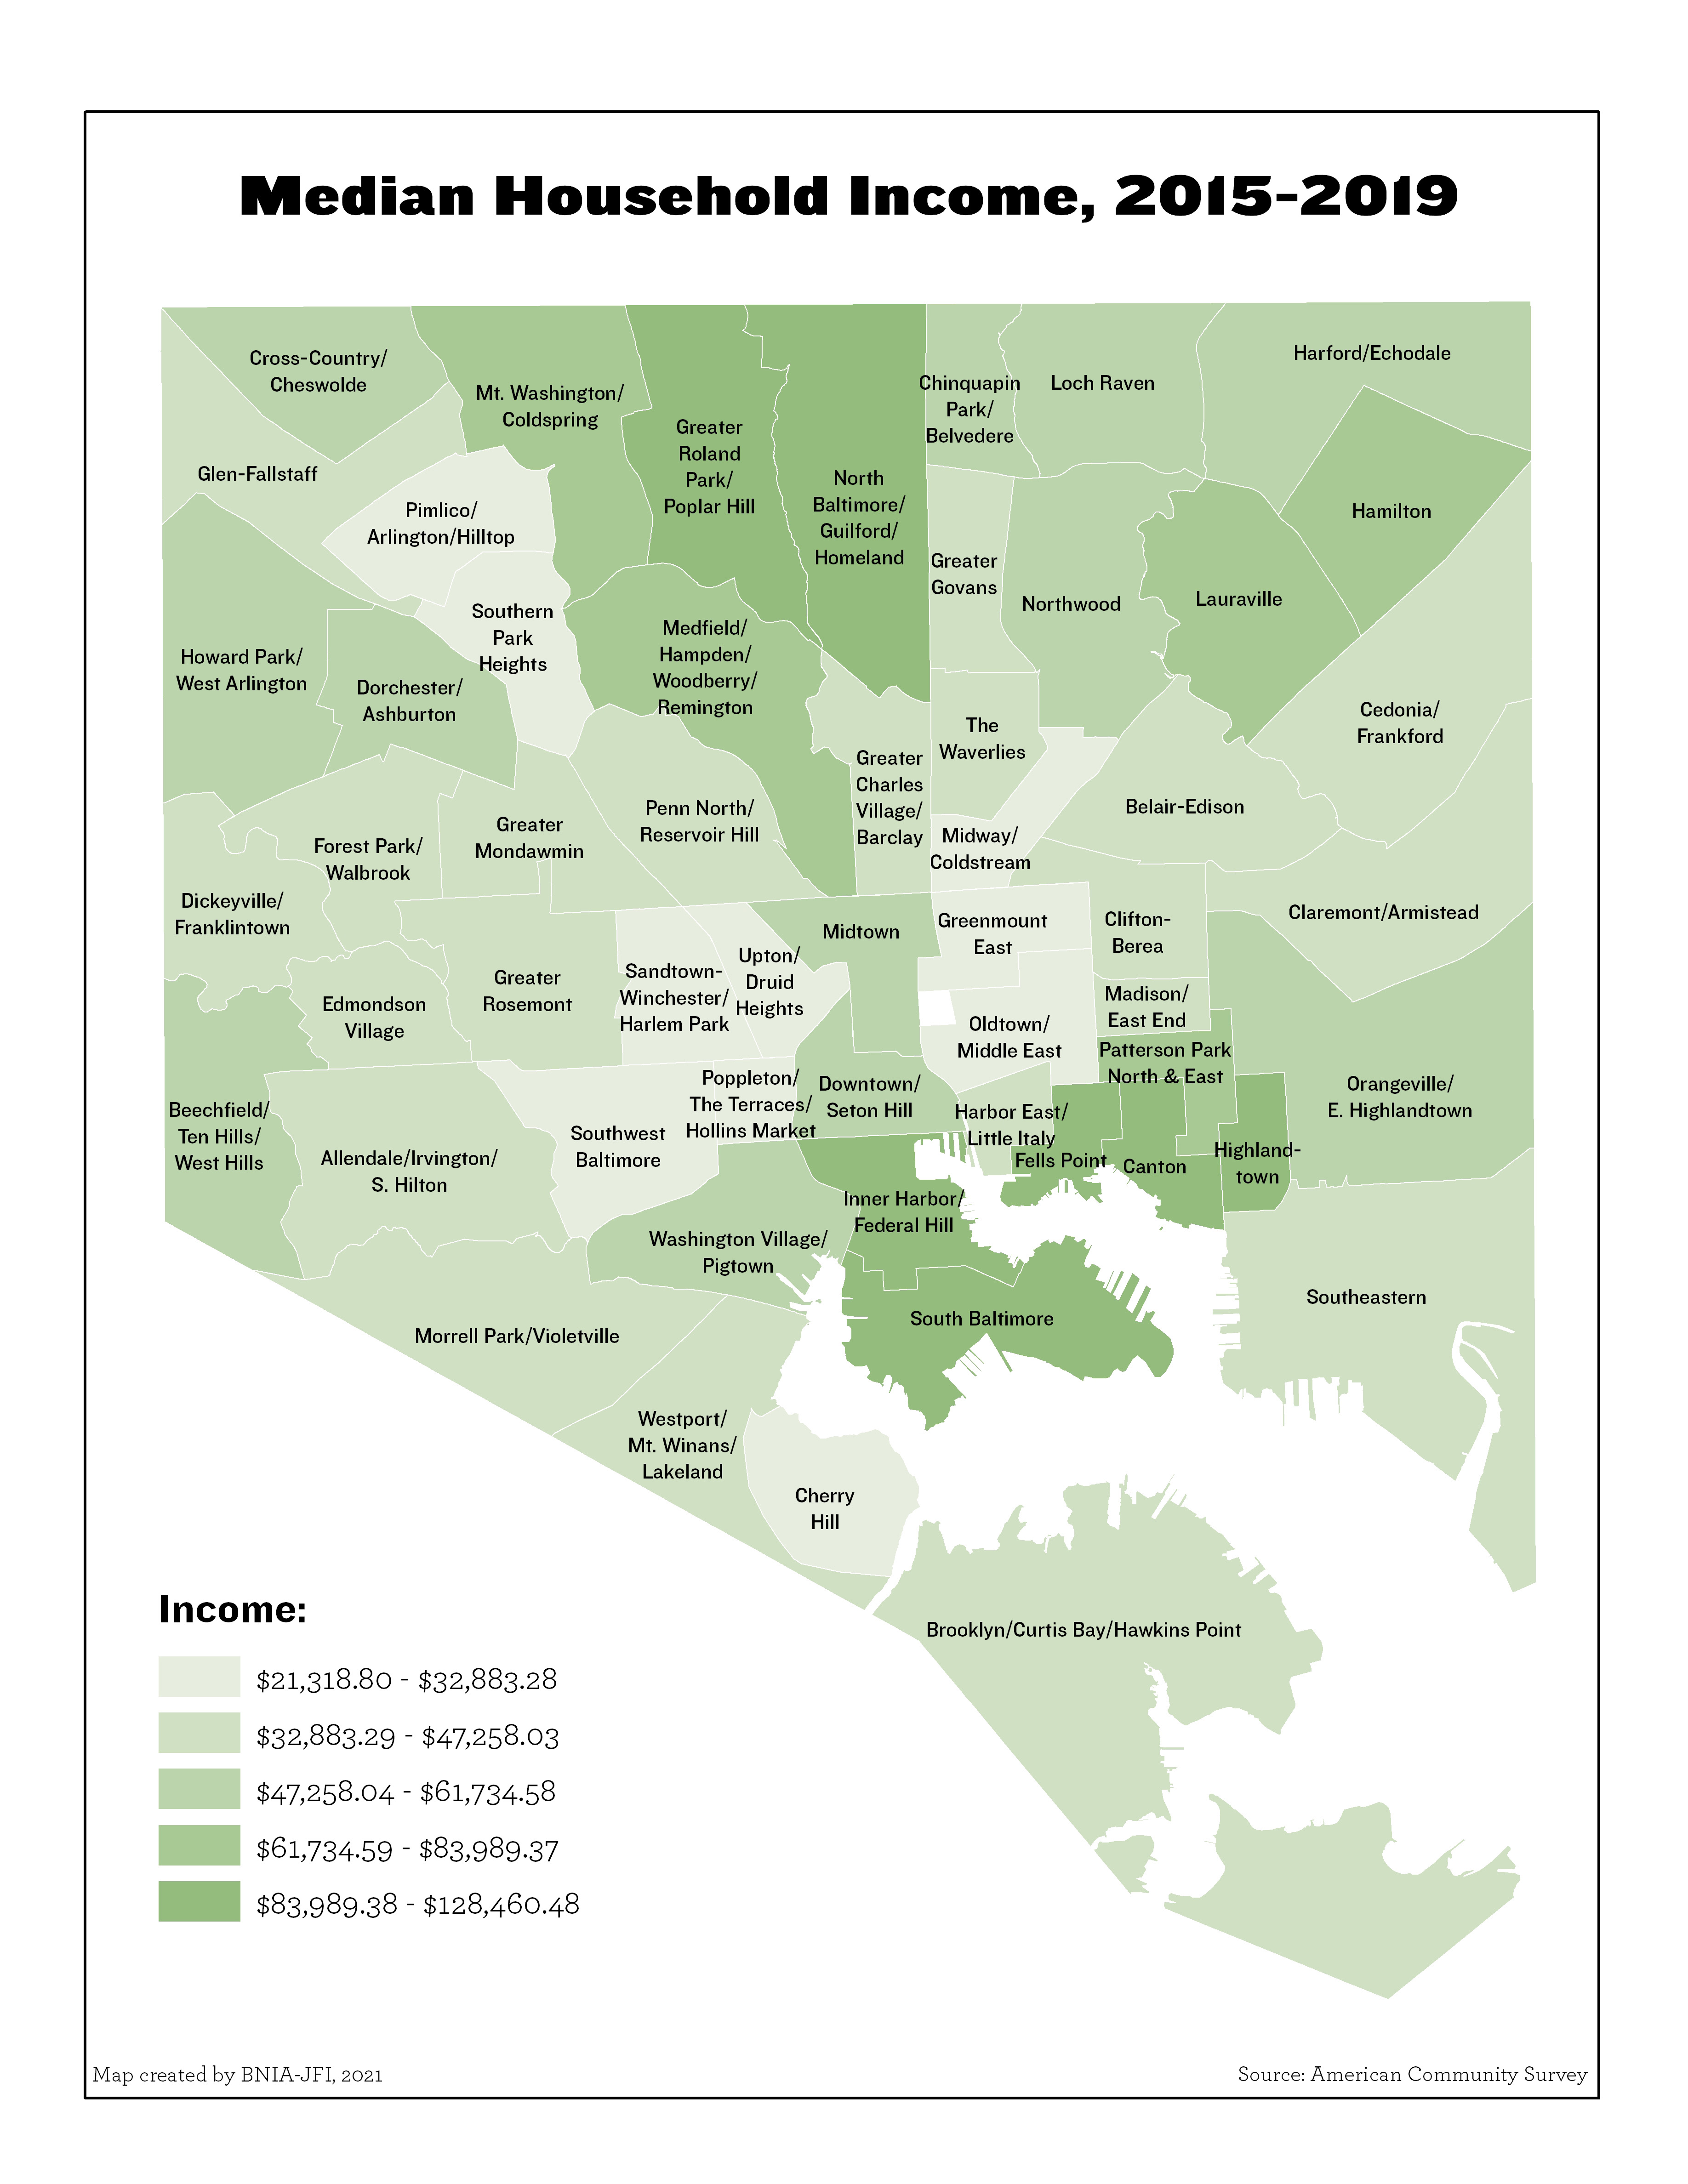
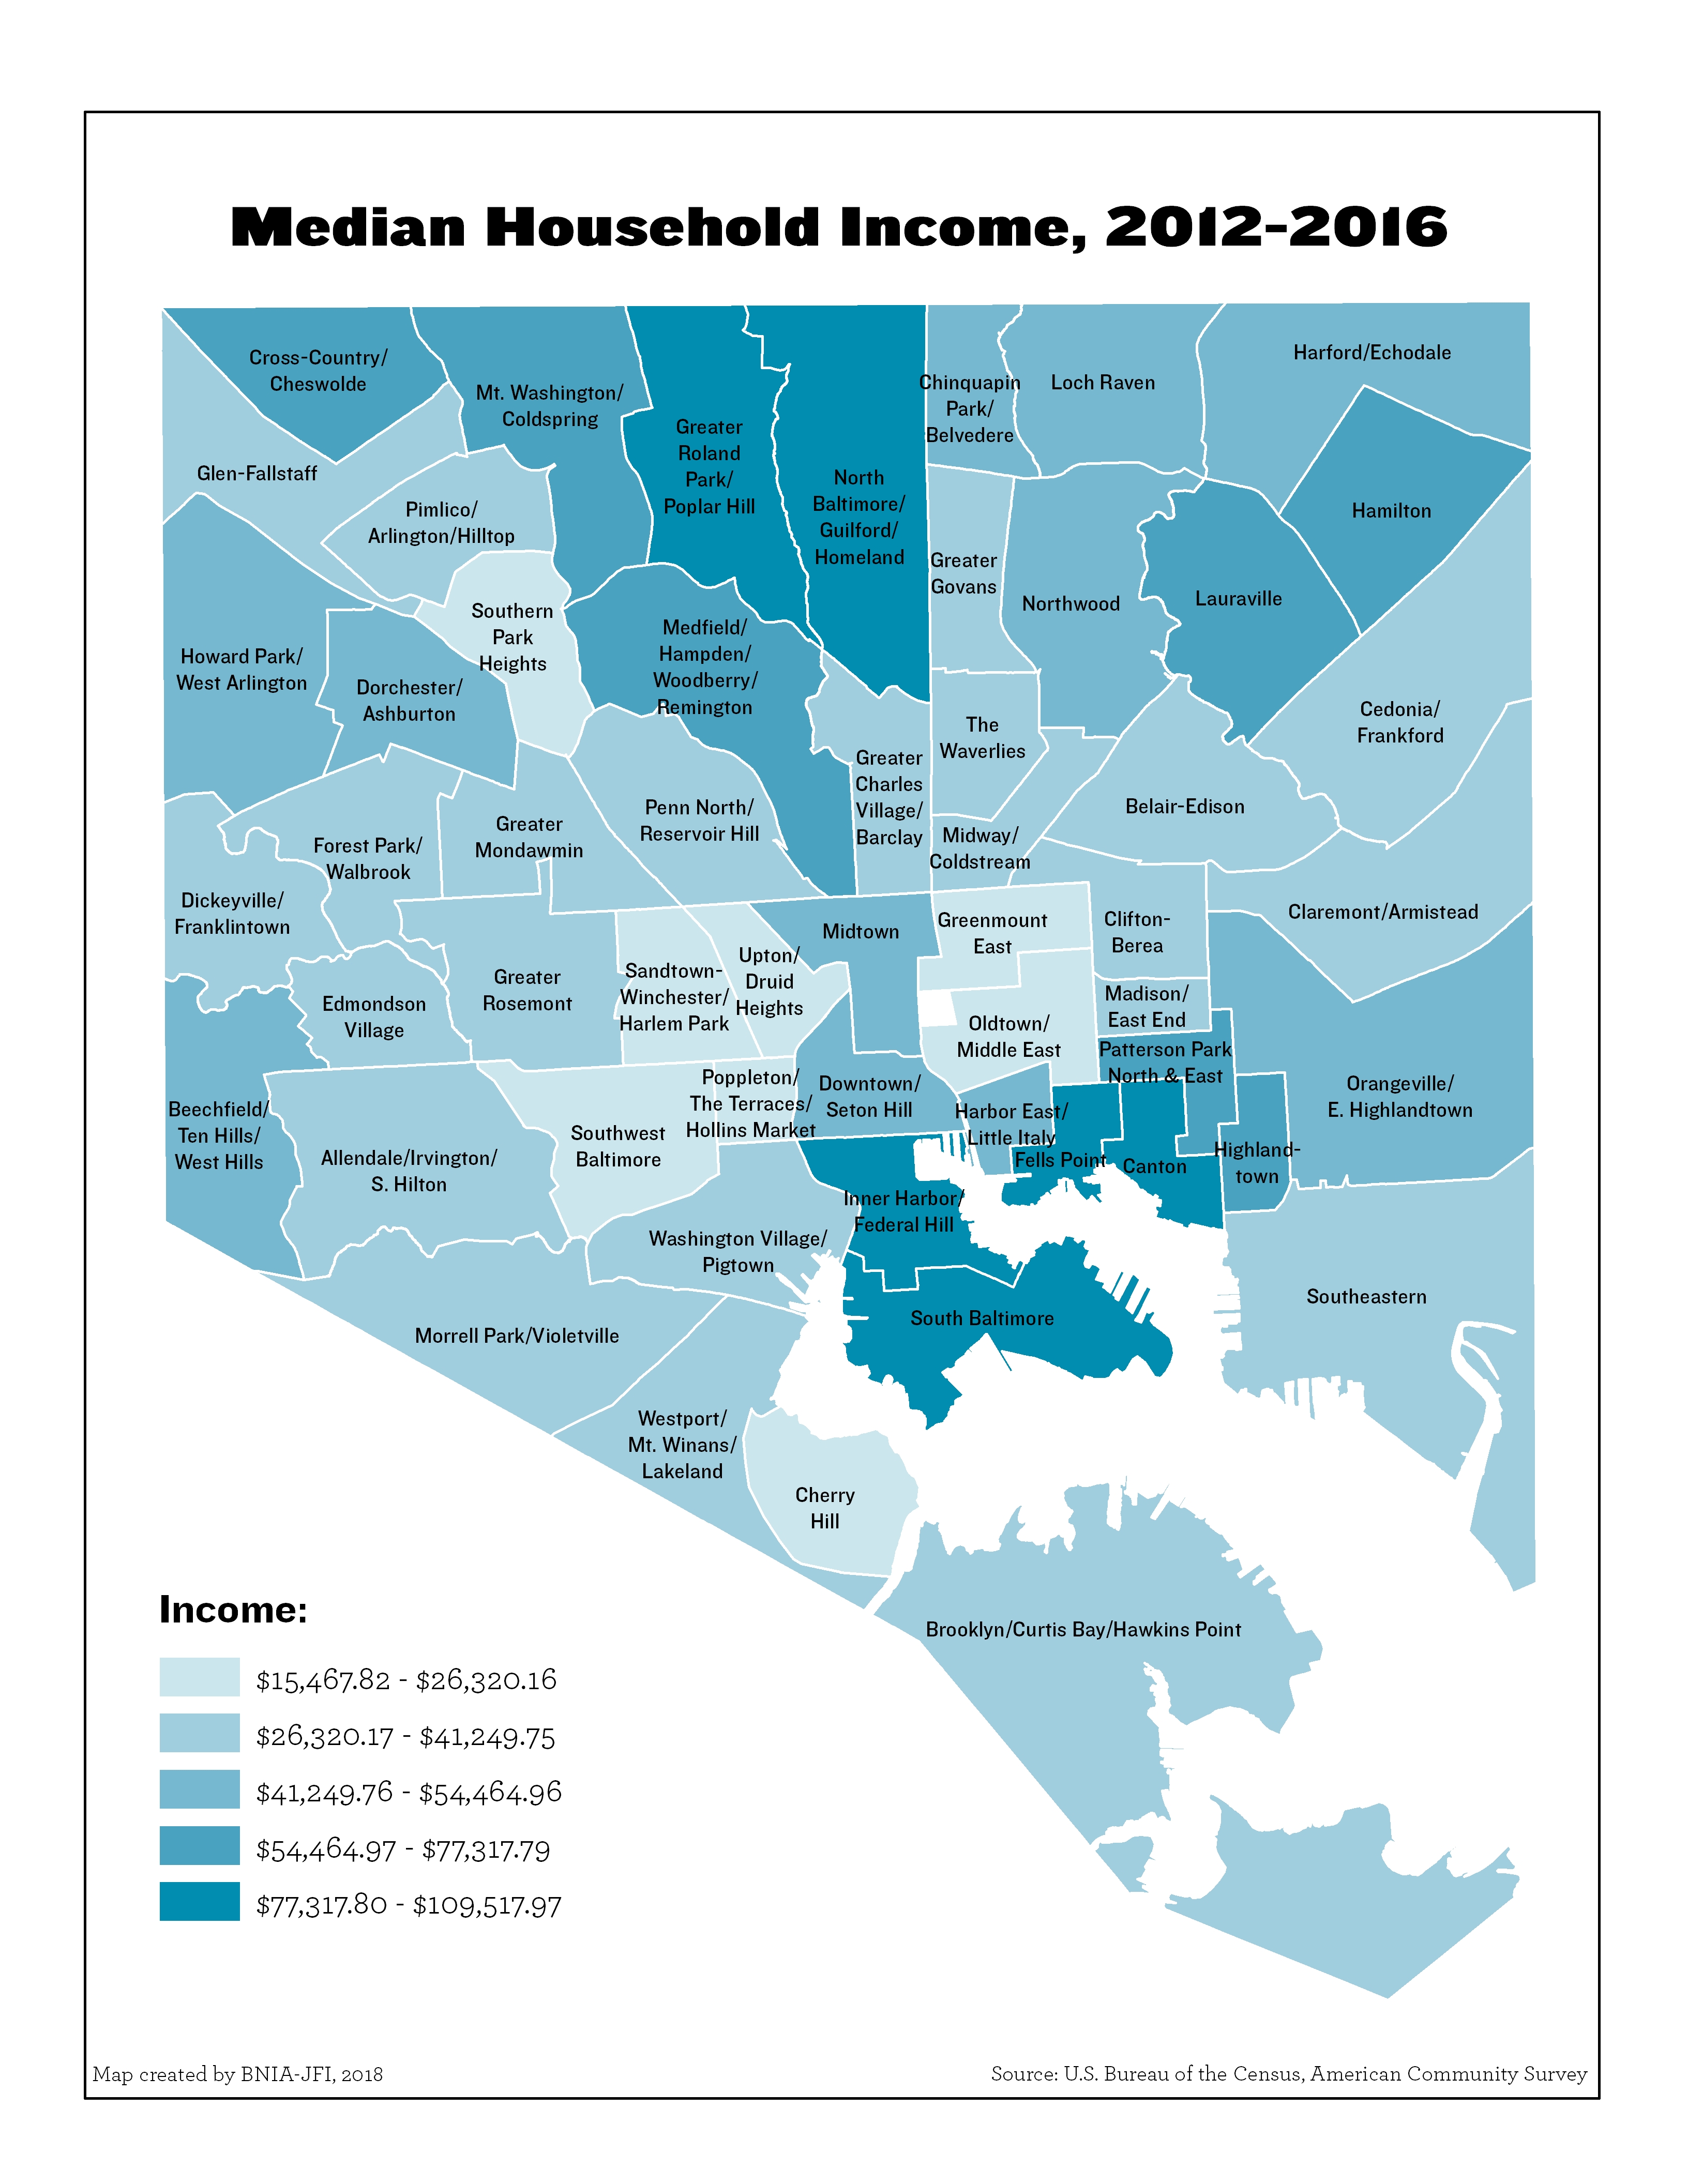
Median Household Income
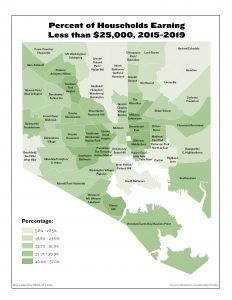
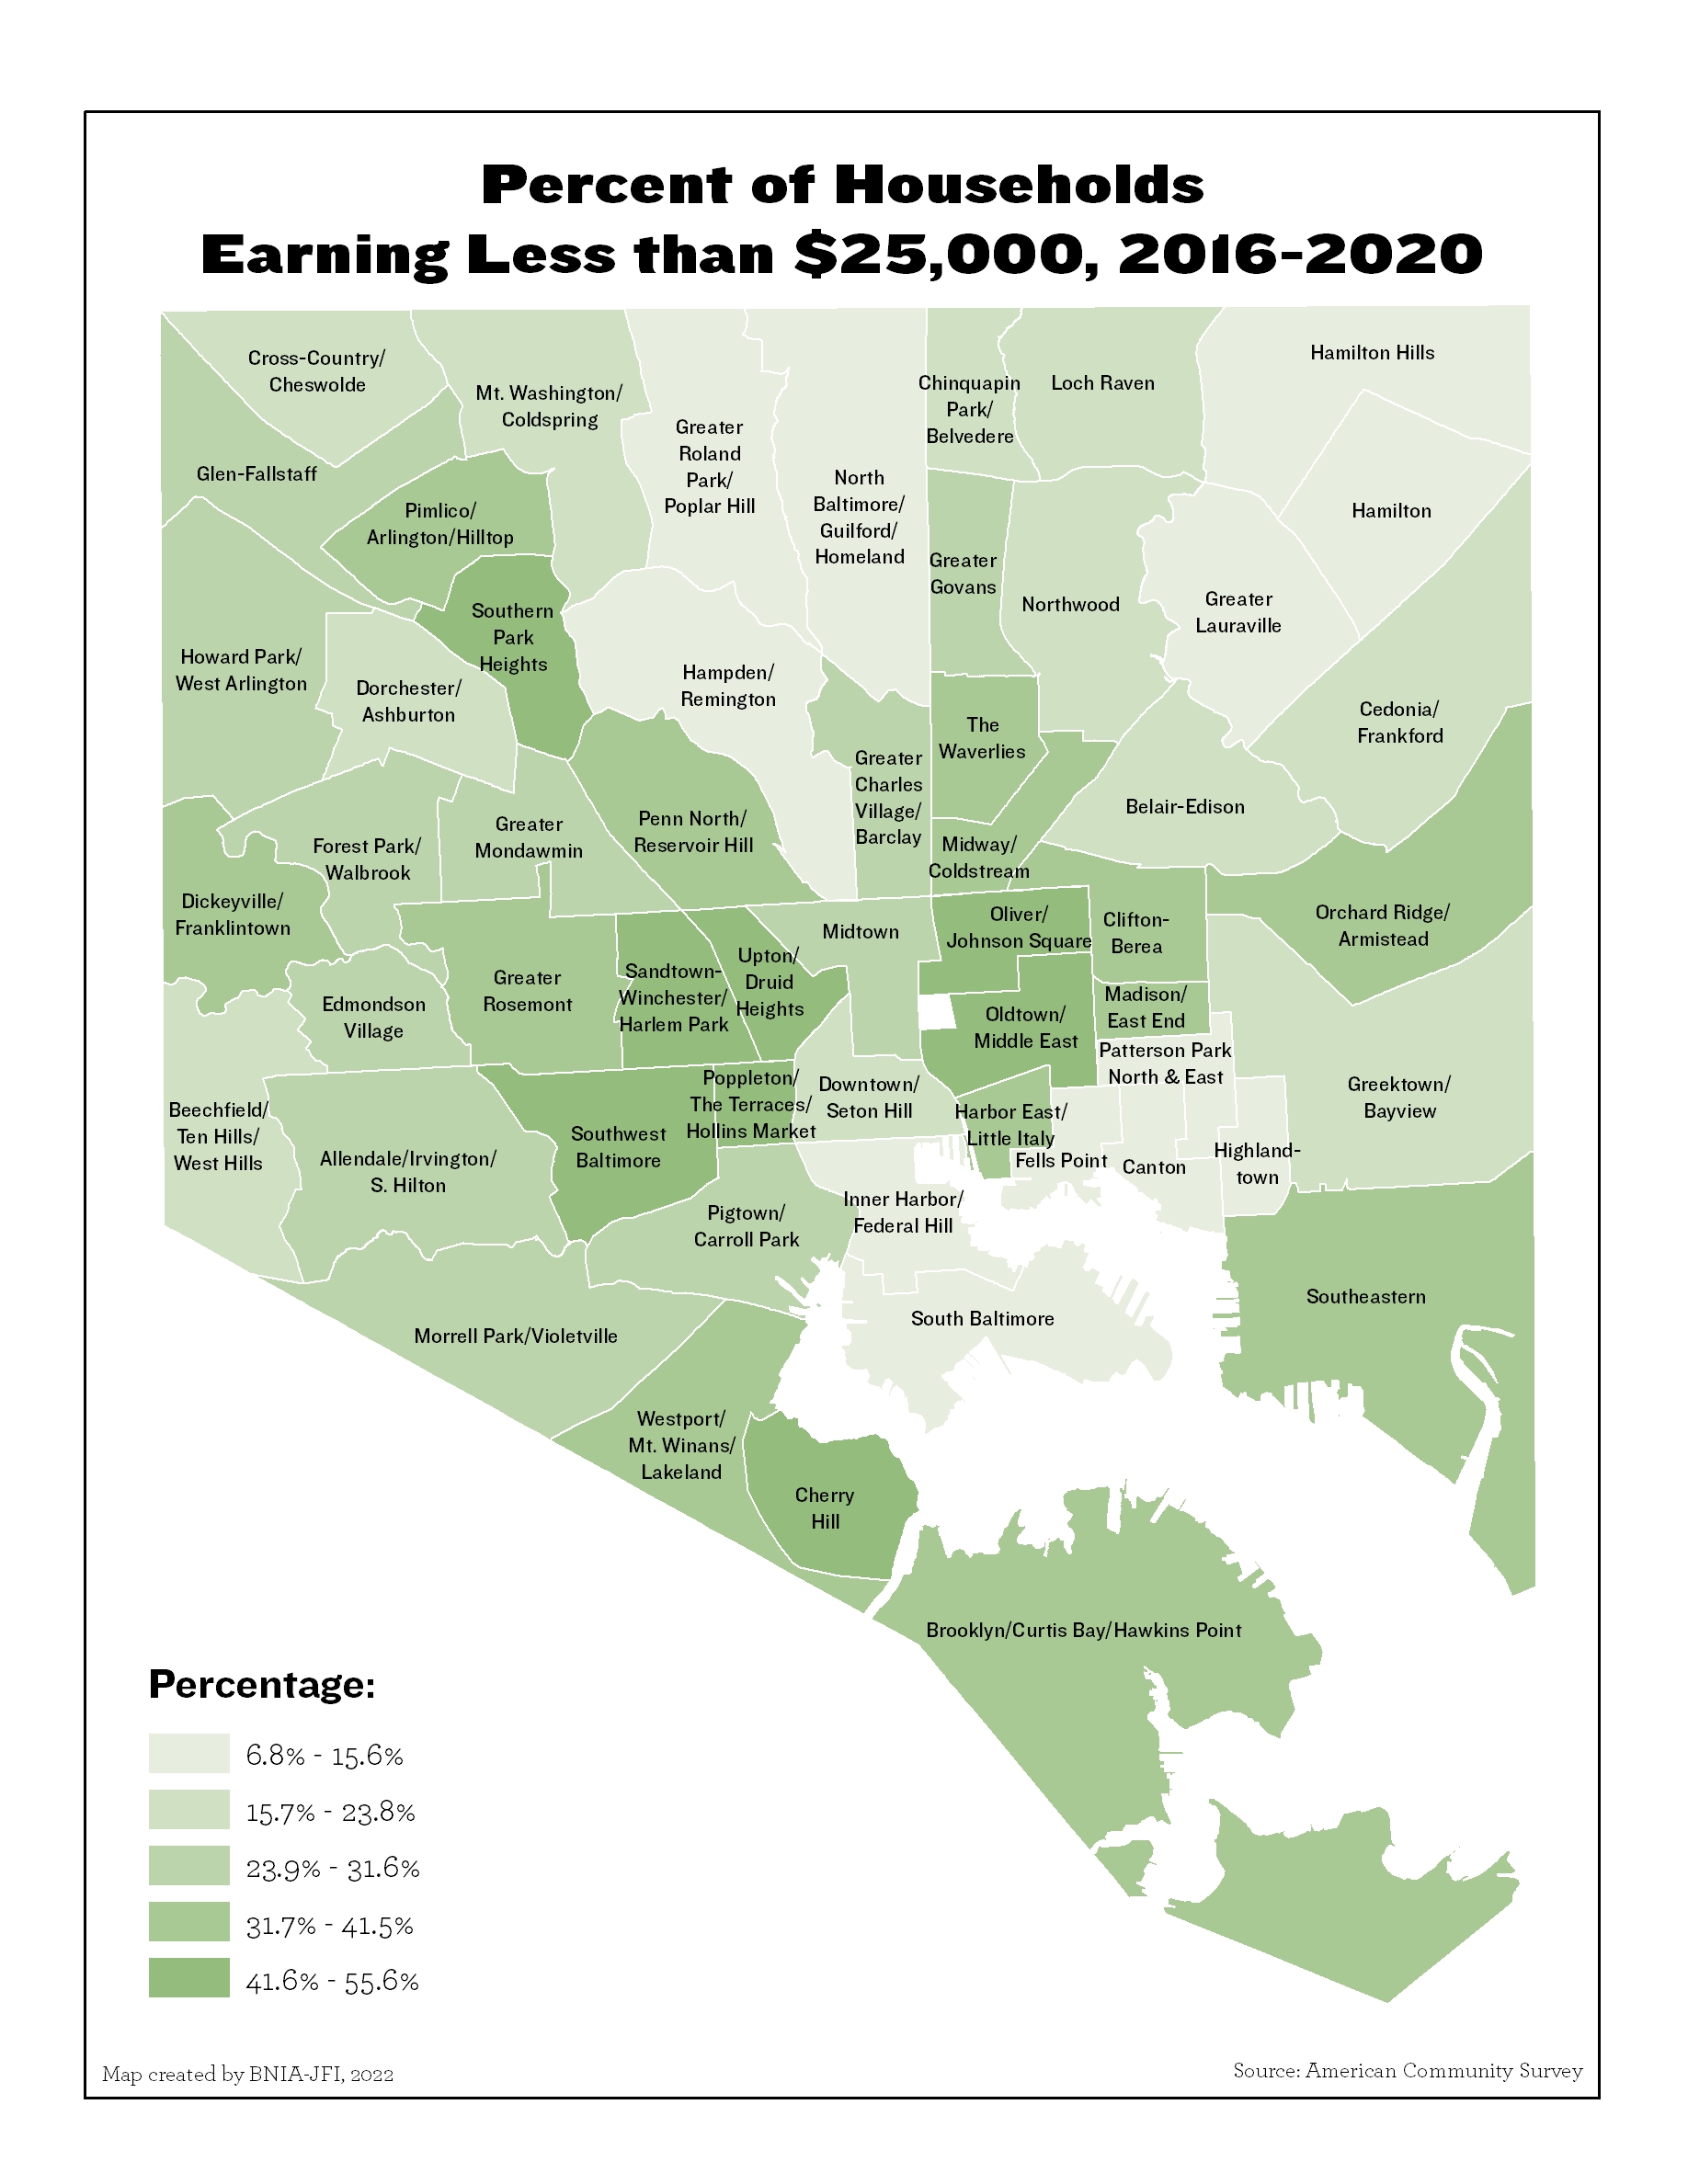
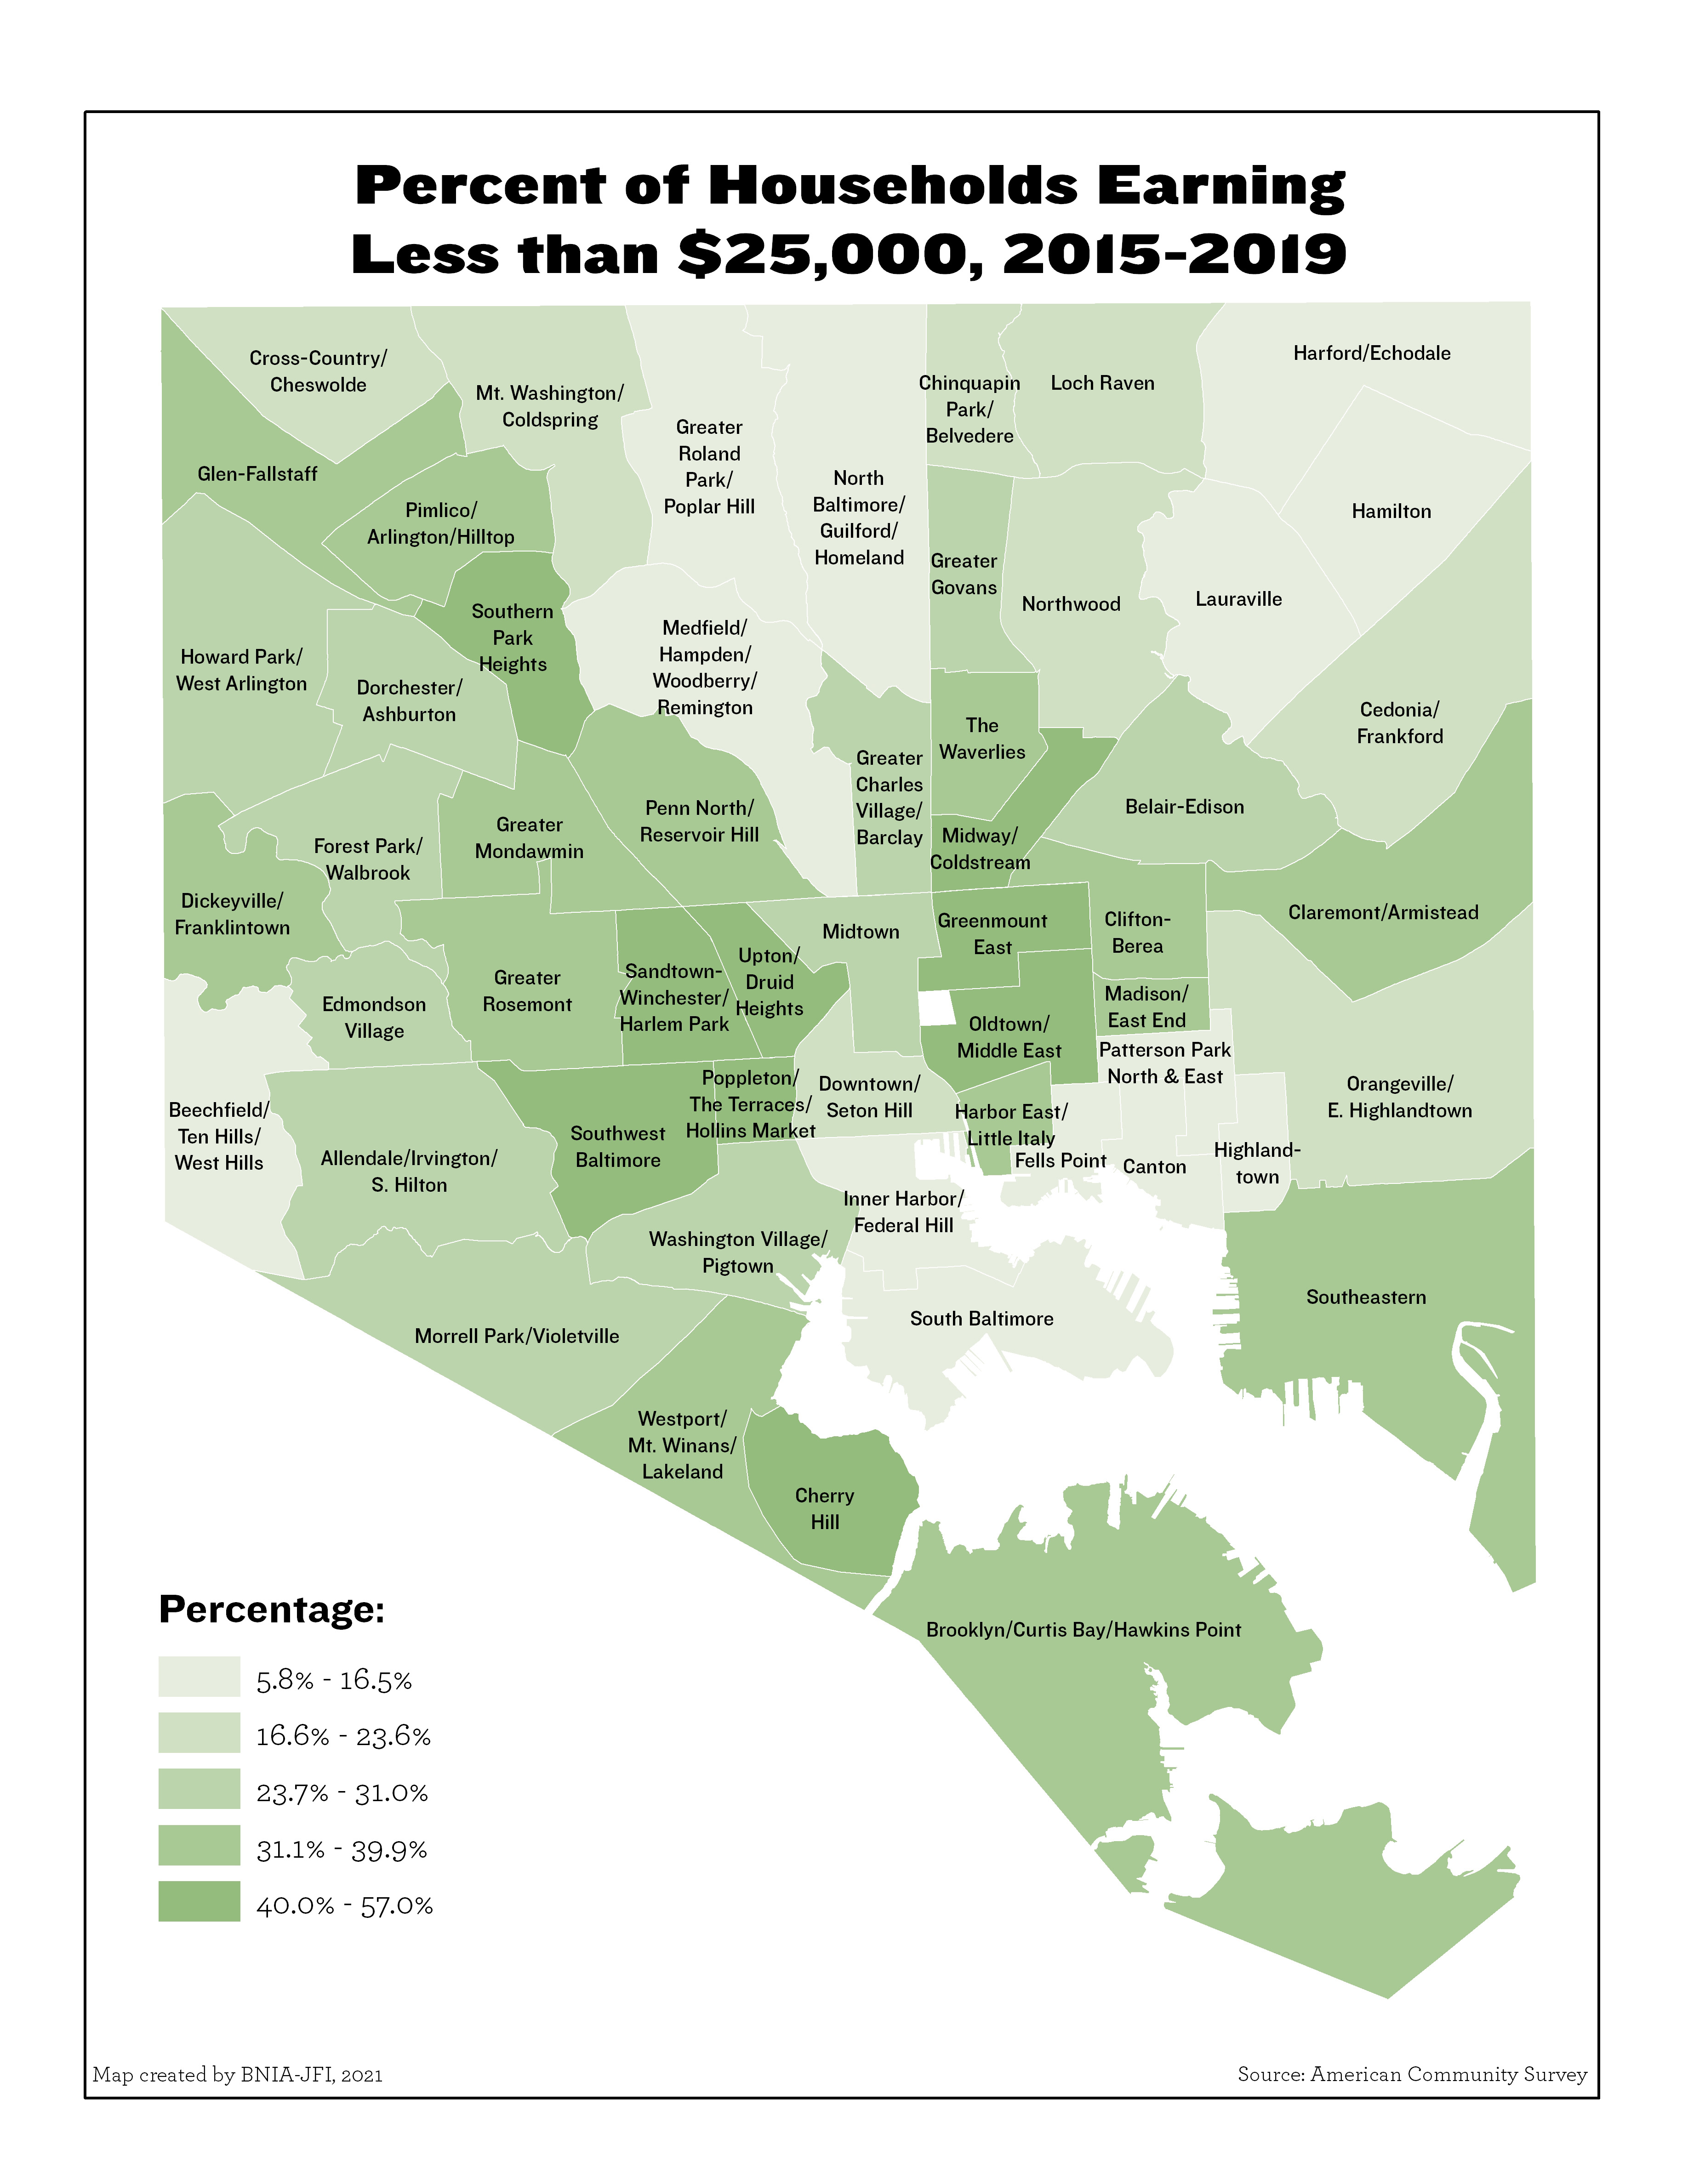
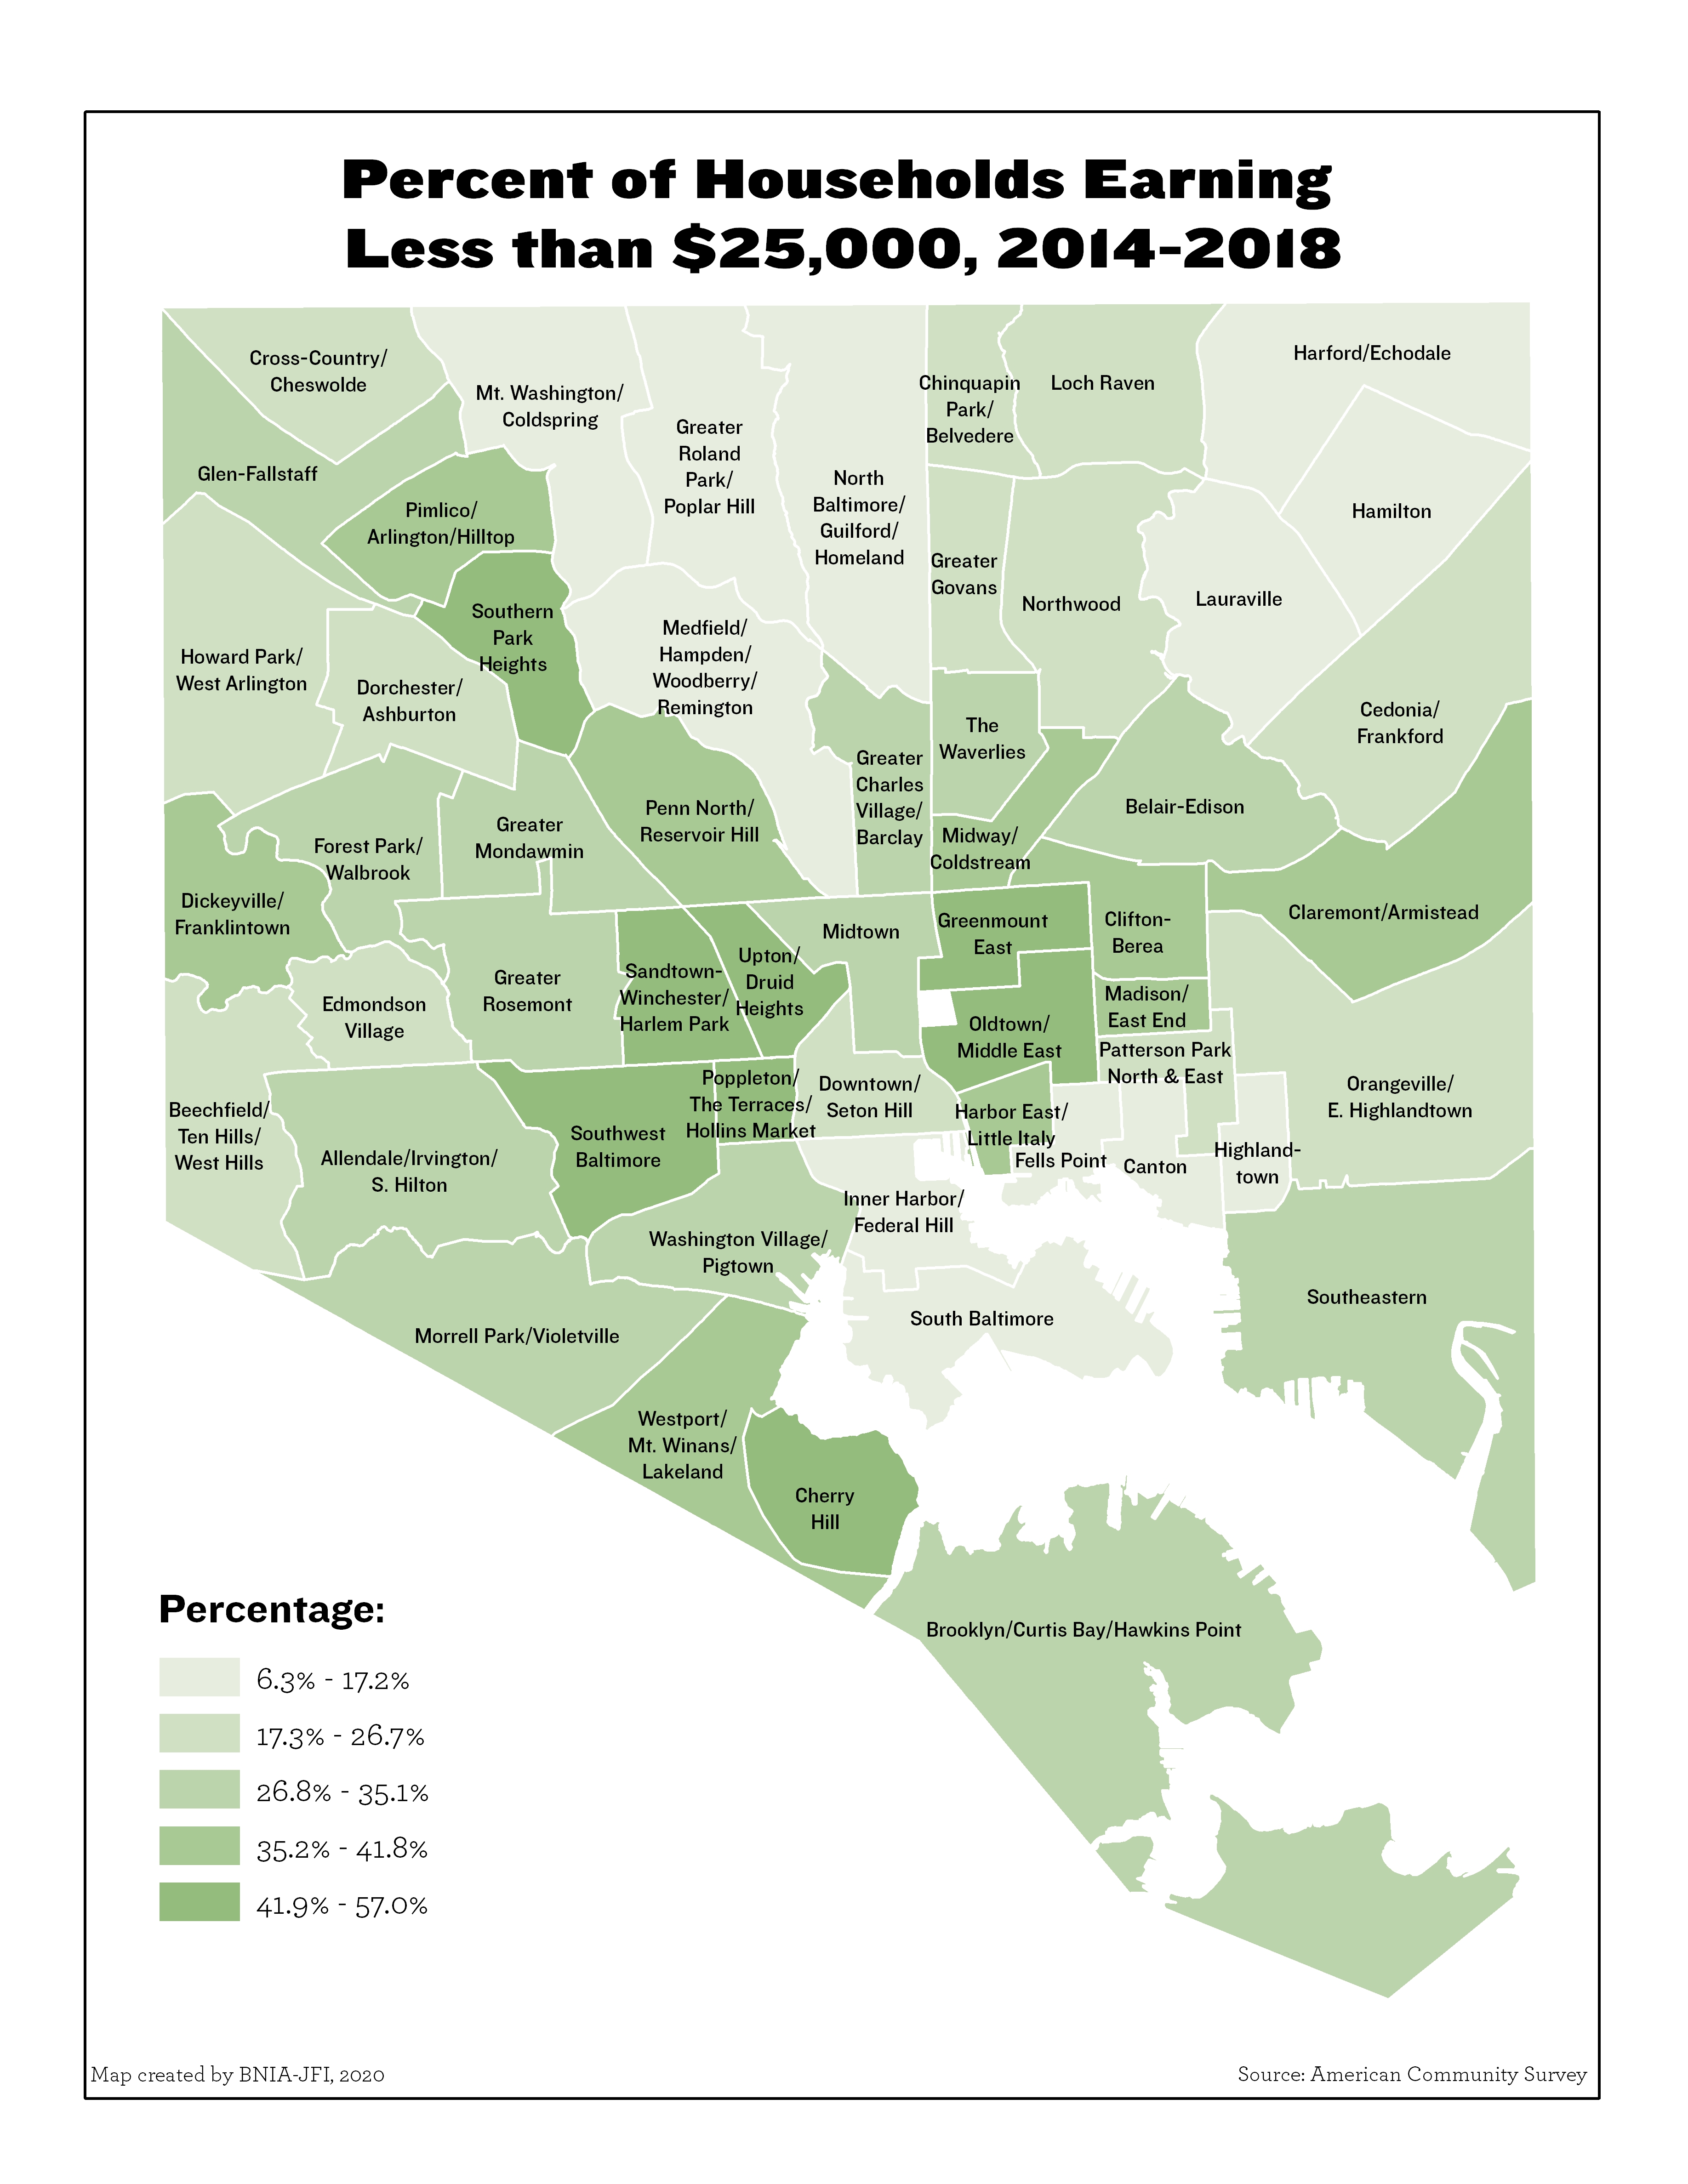
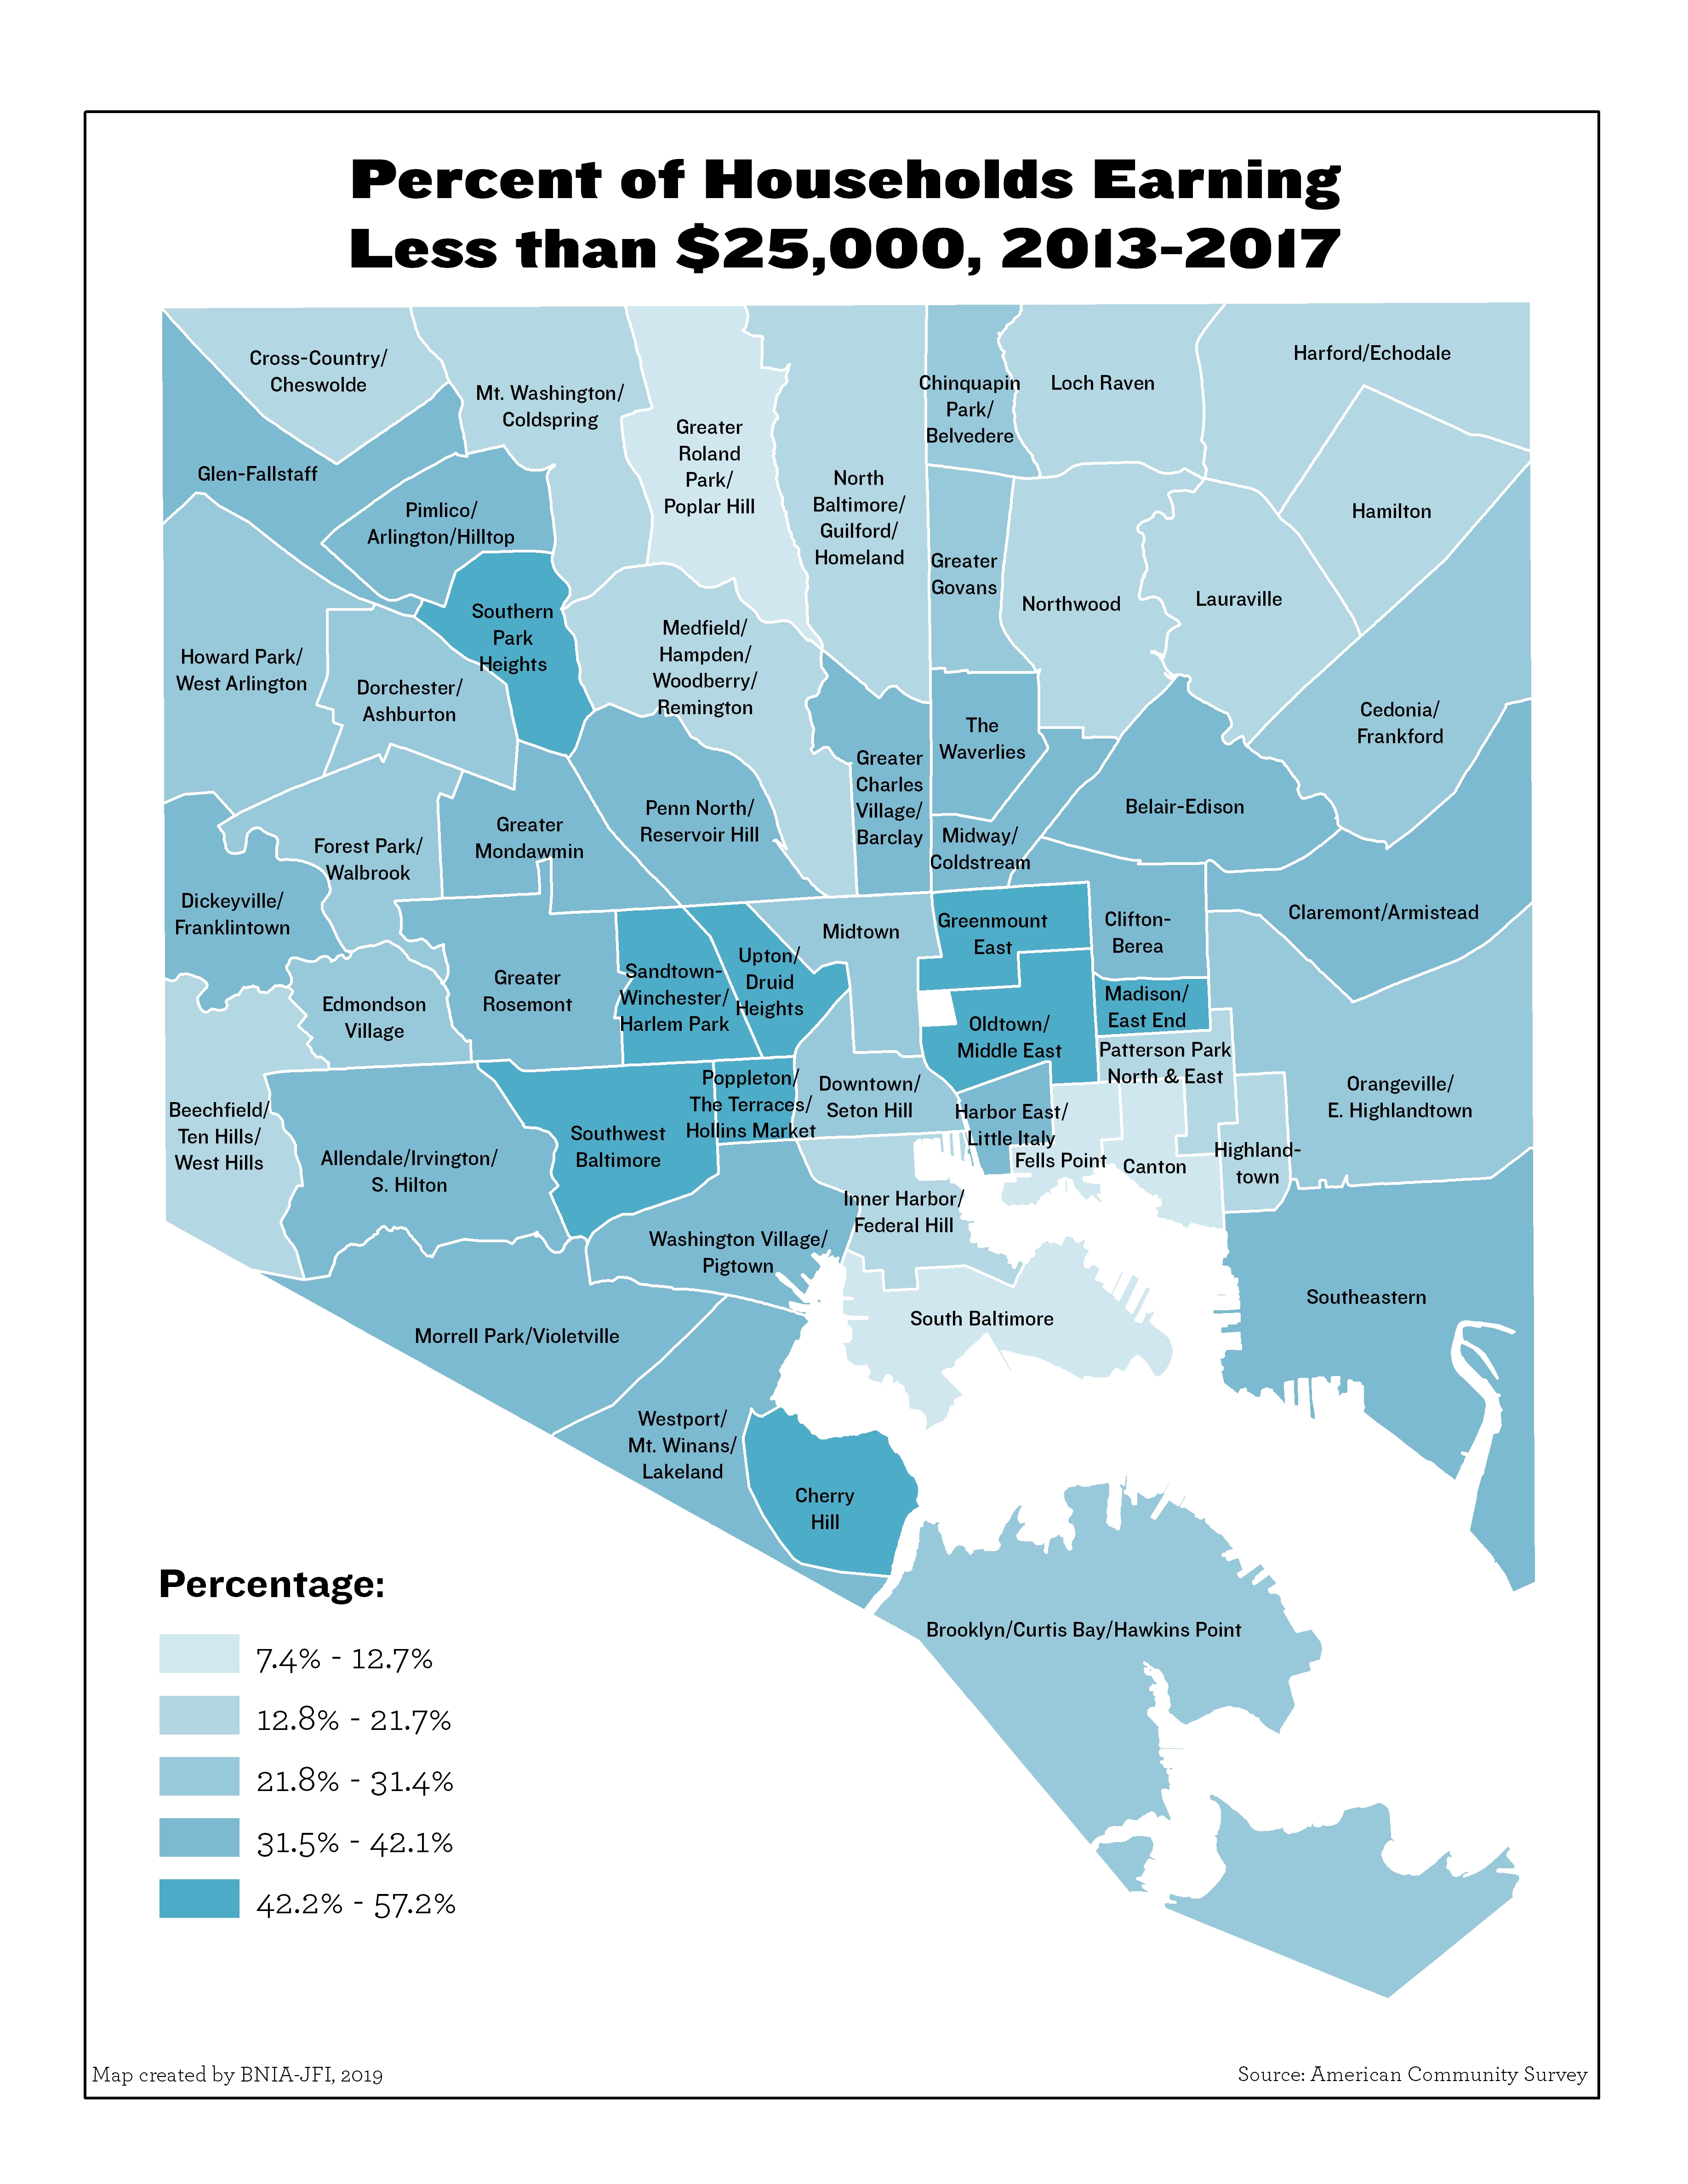
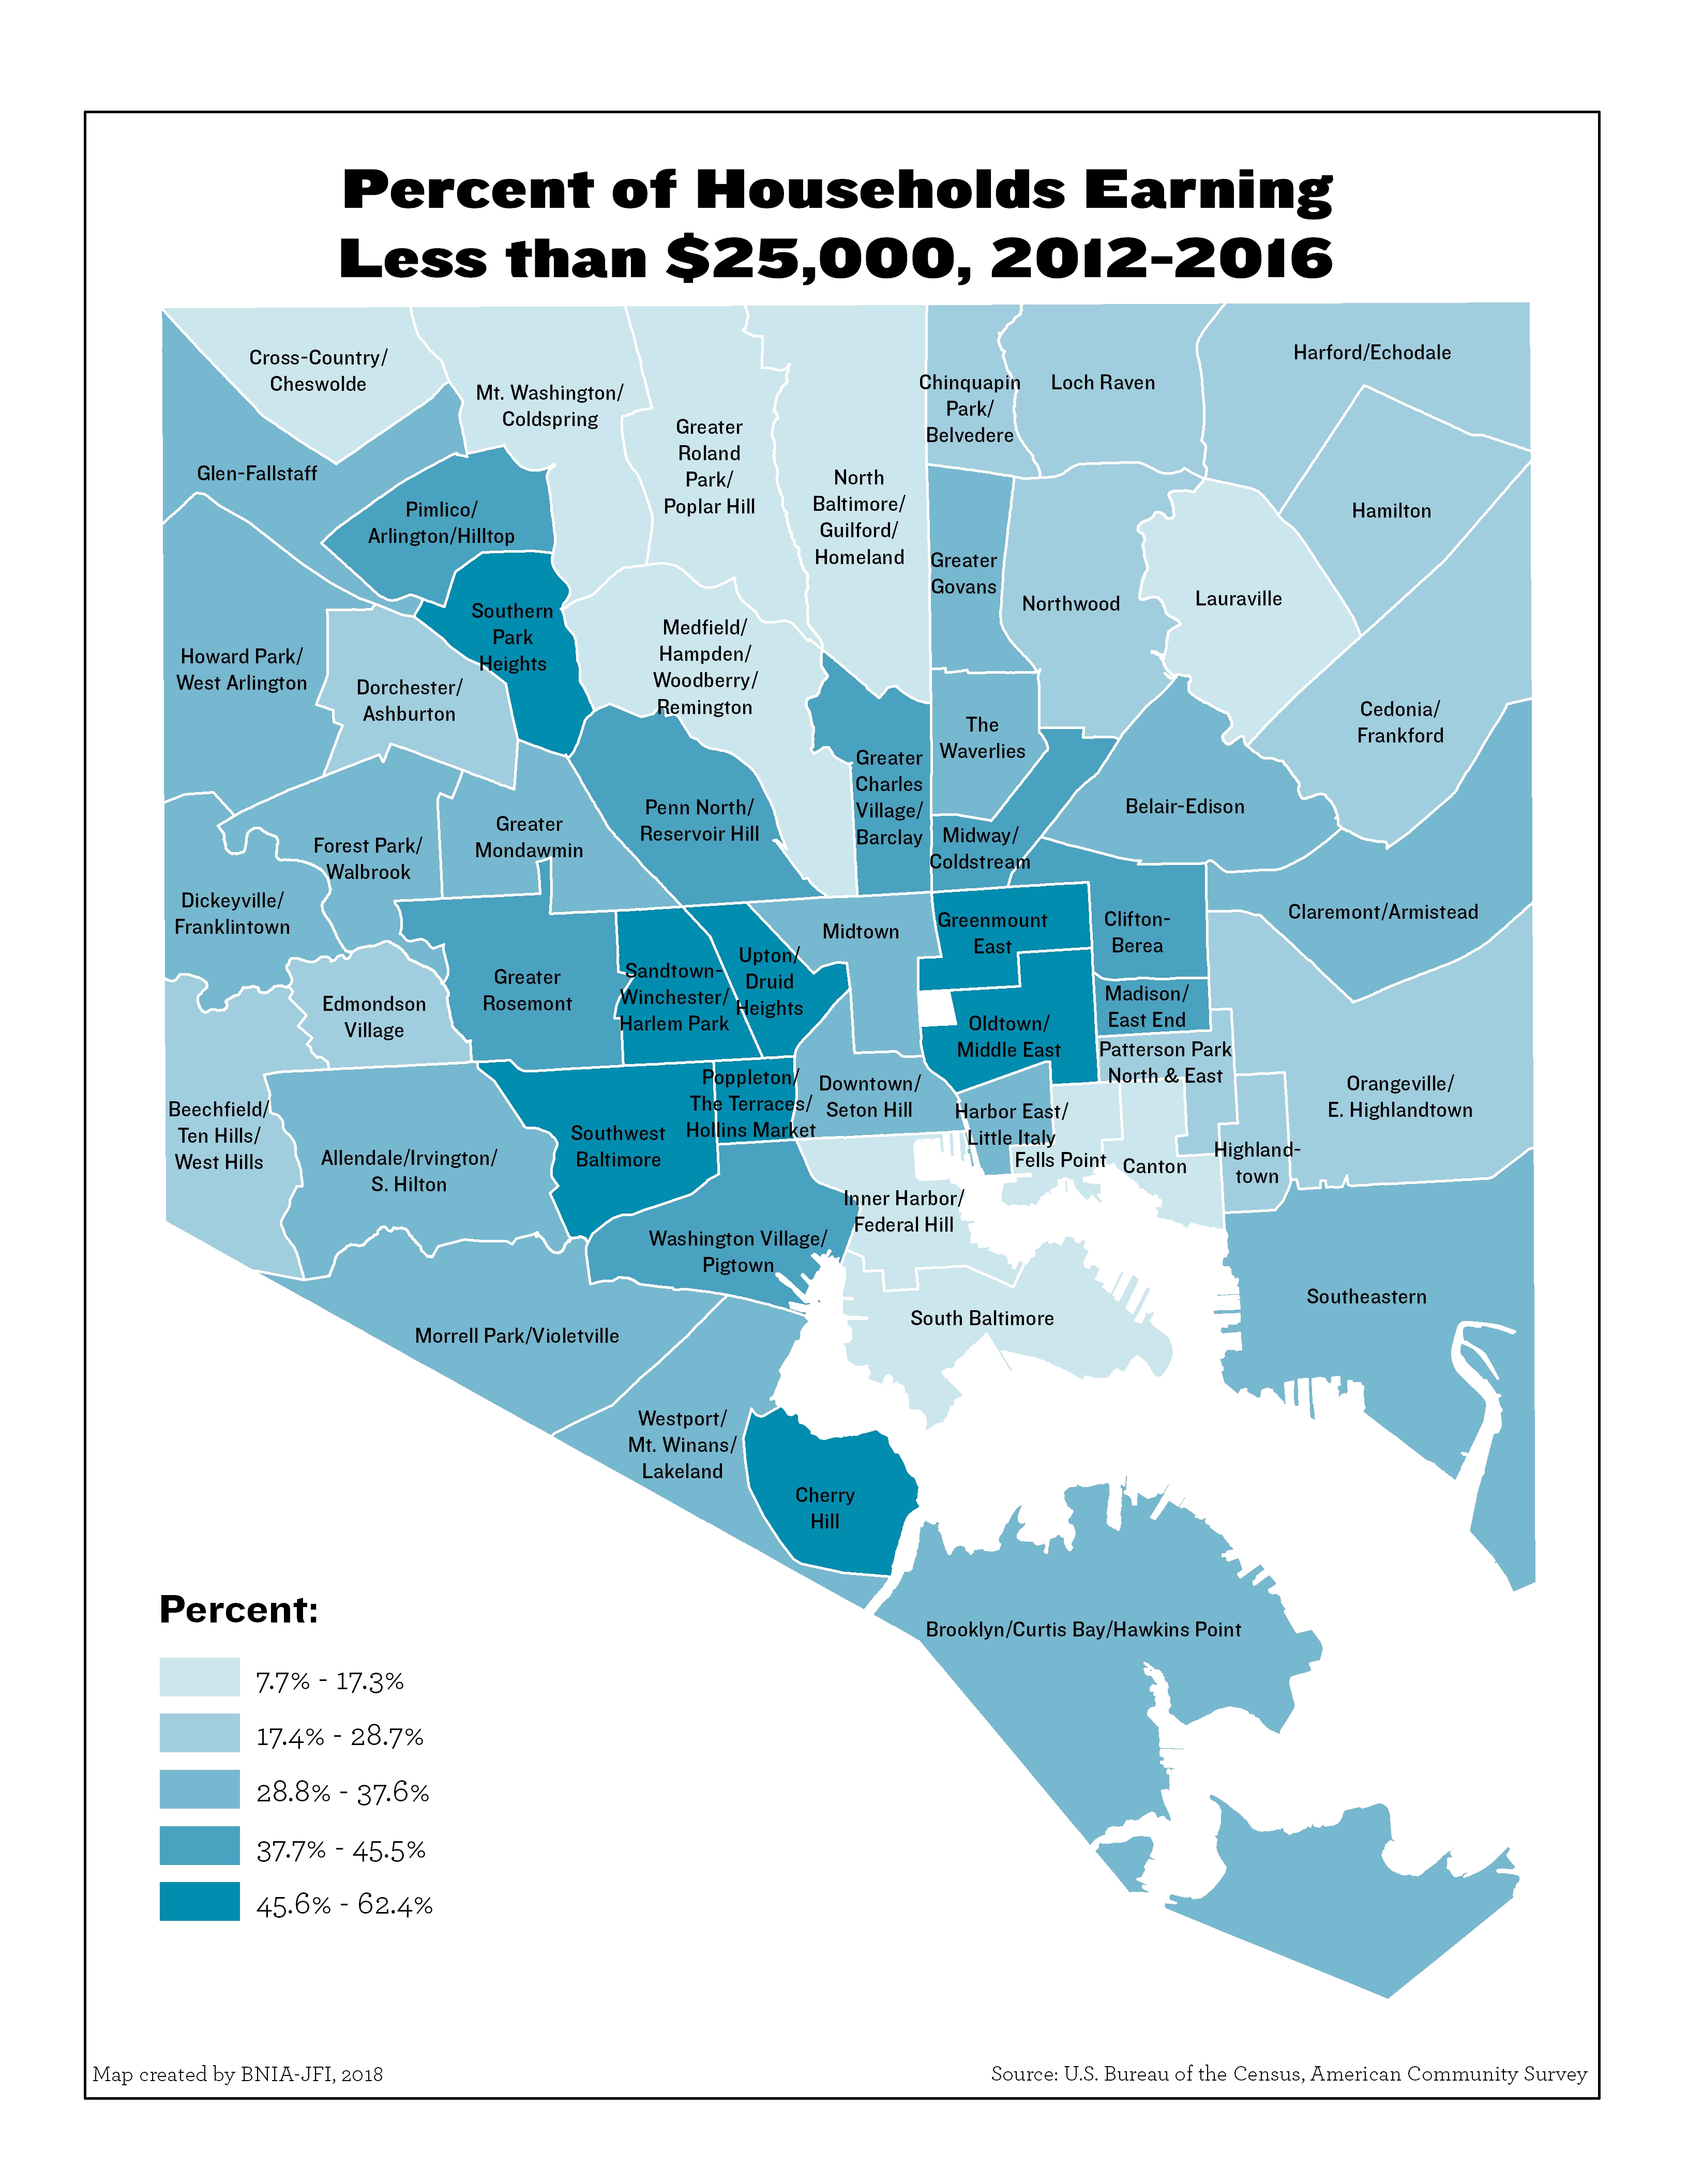
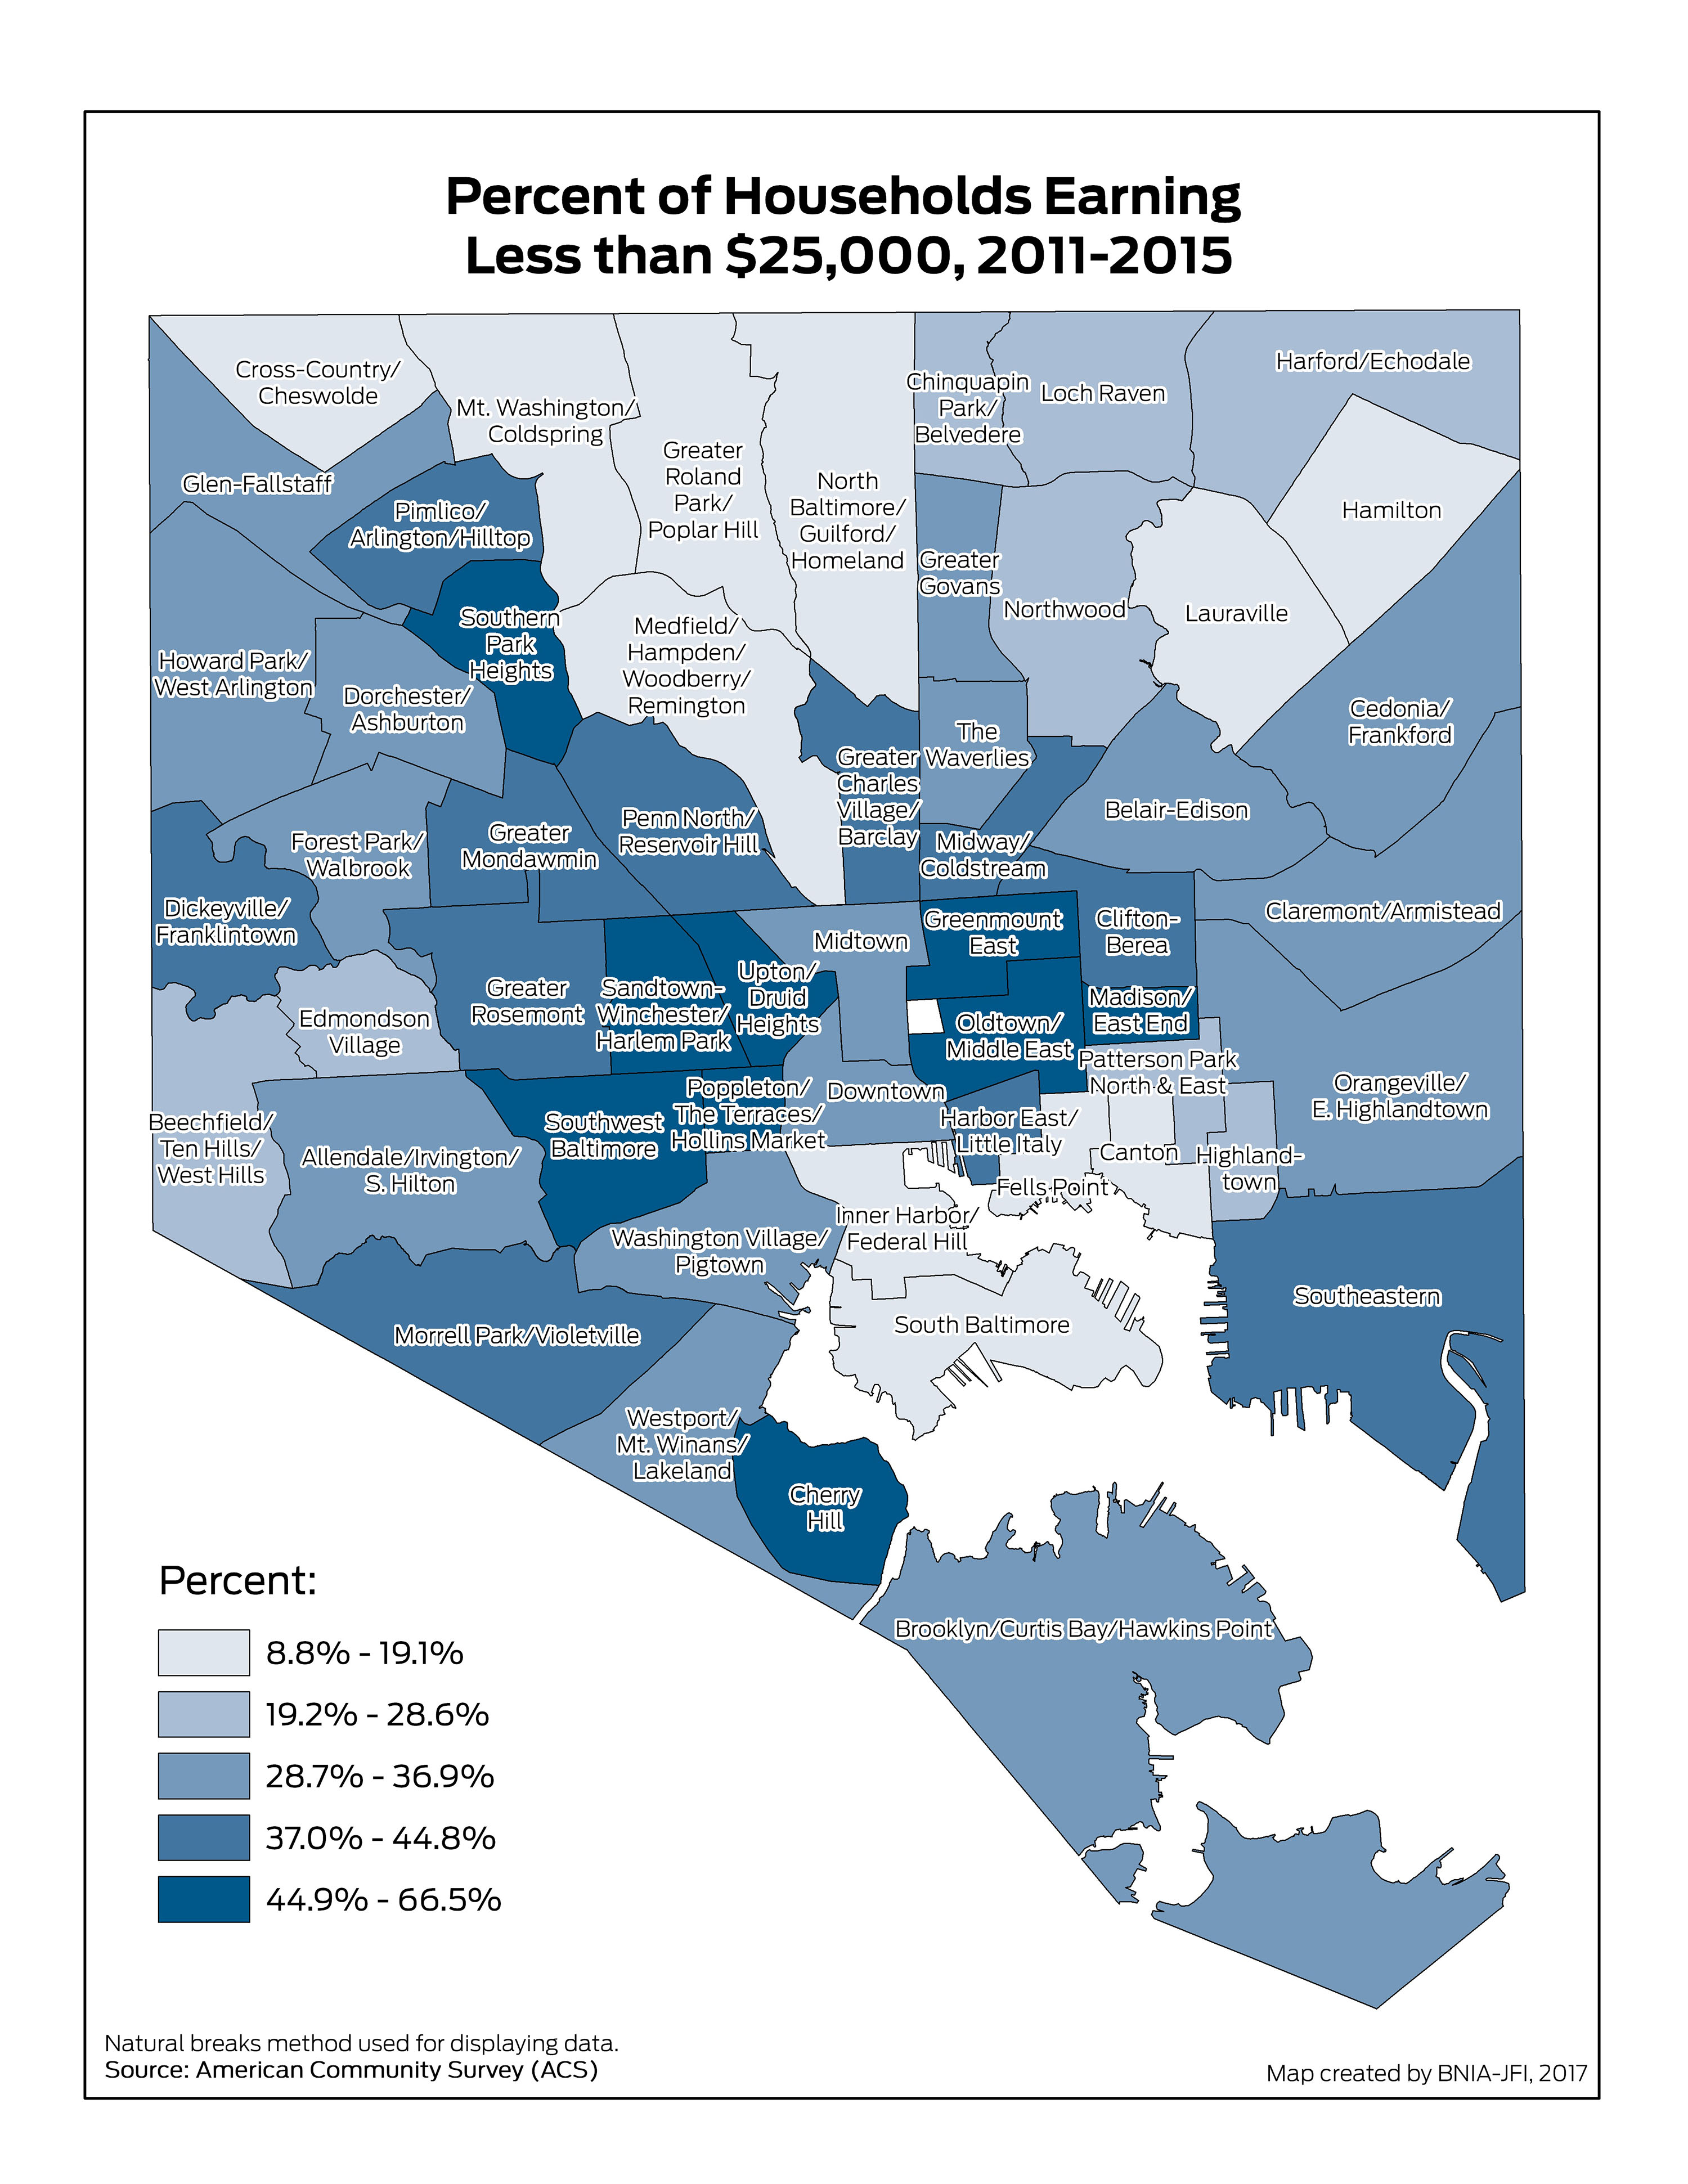
Percent of Households Earning Less than $25,000
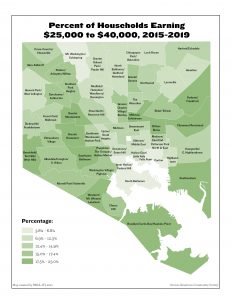
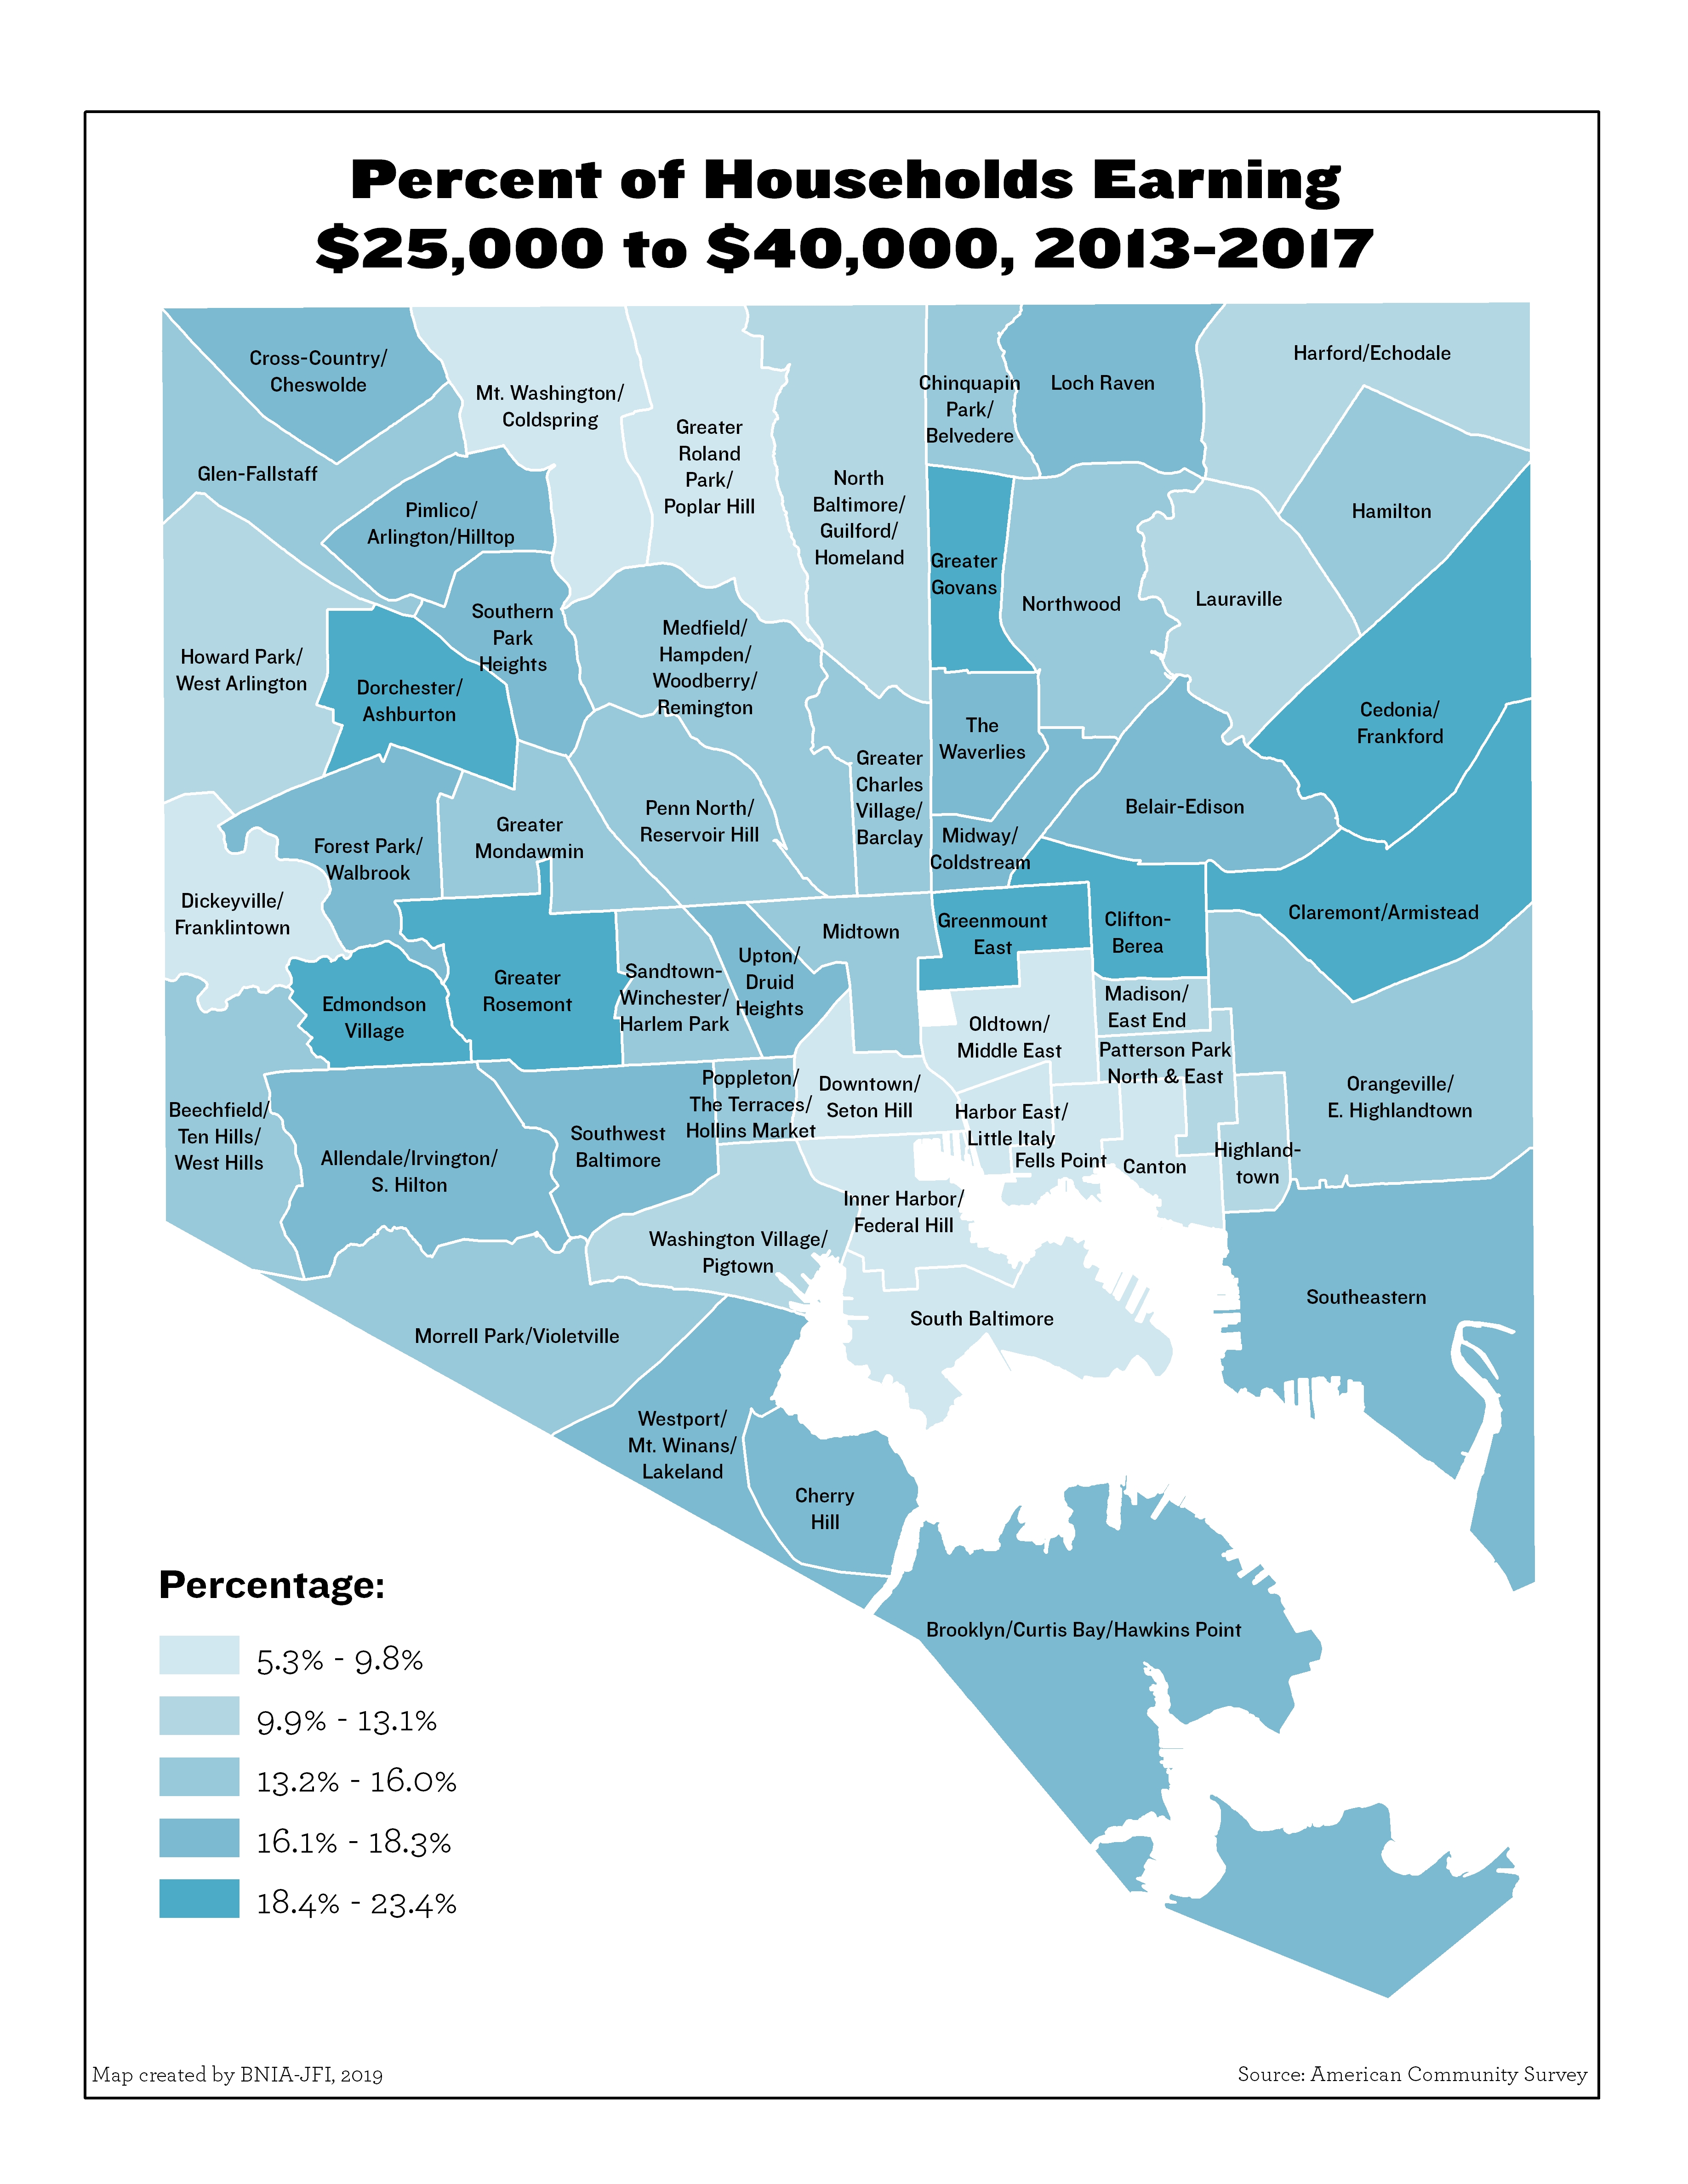
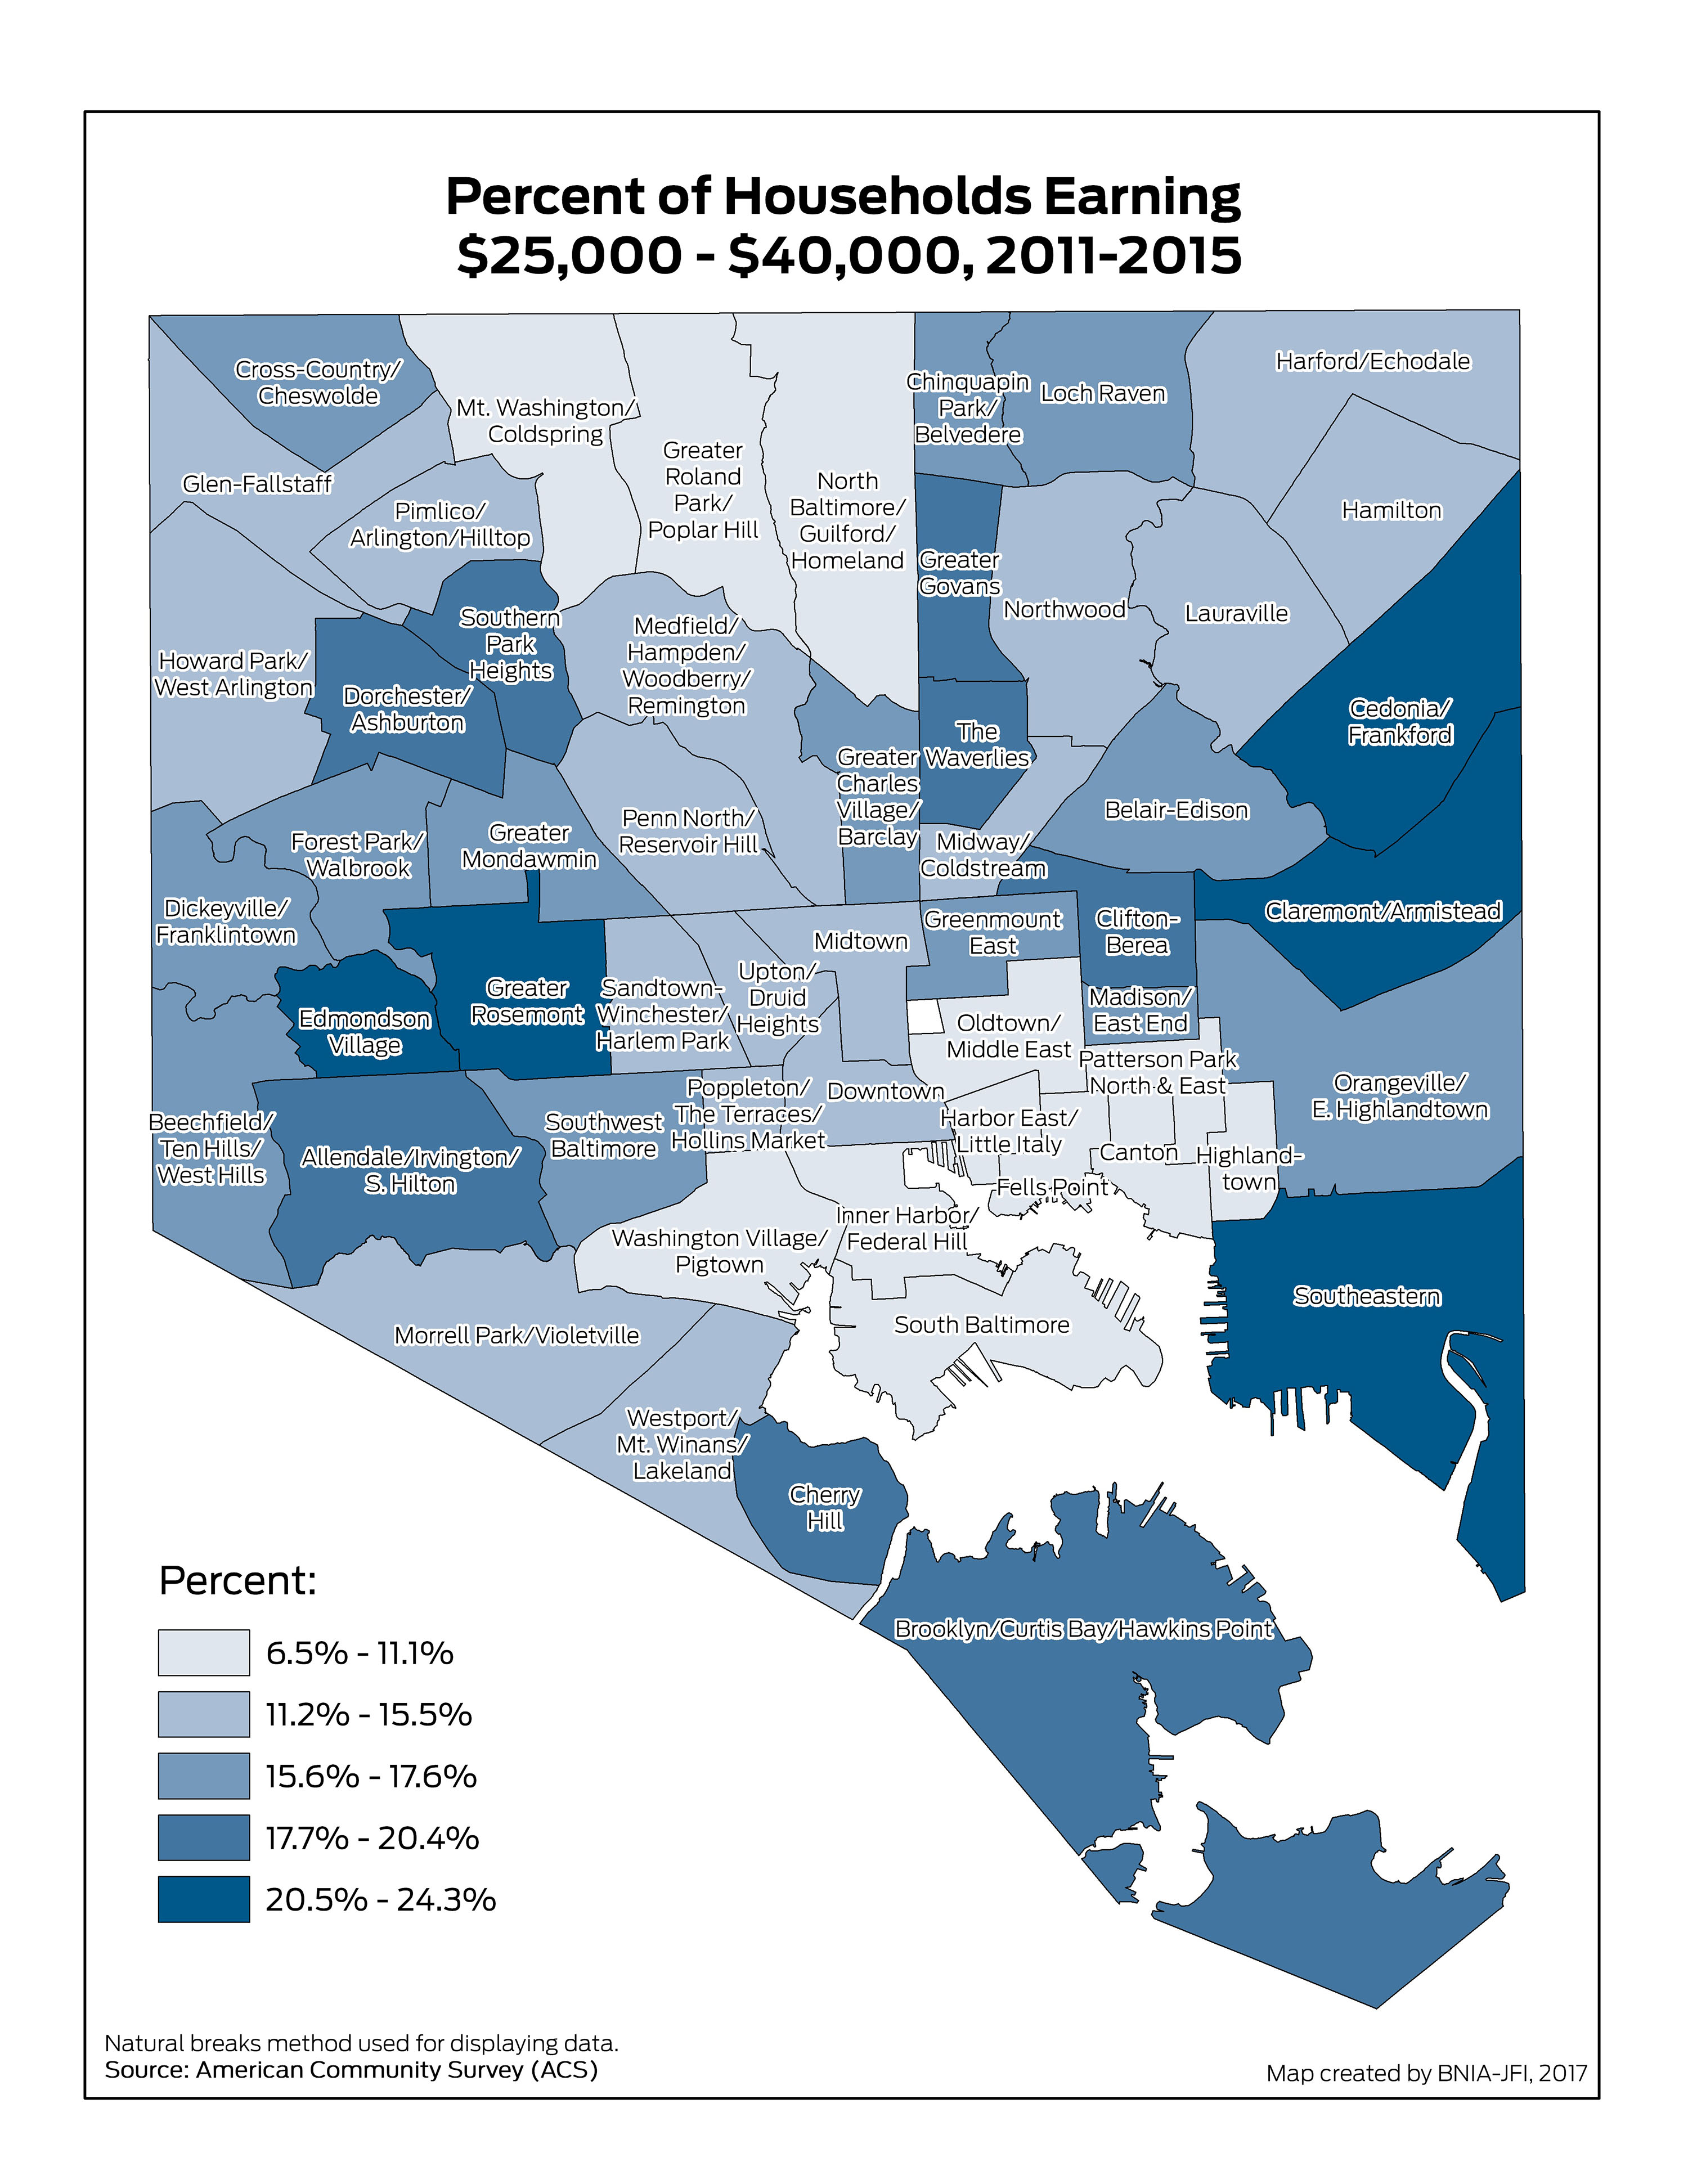
Percent of Households Earning $25,000 to $40,000
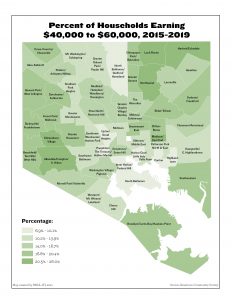
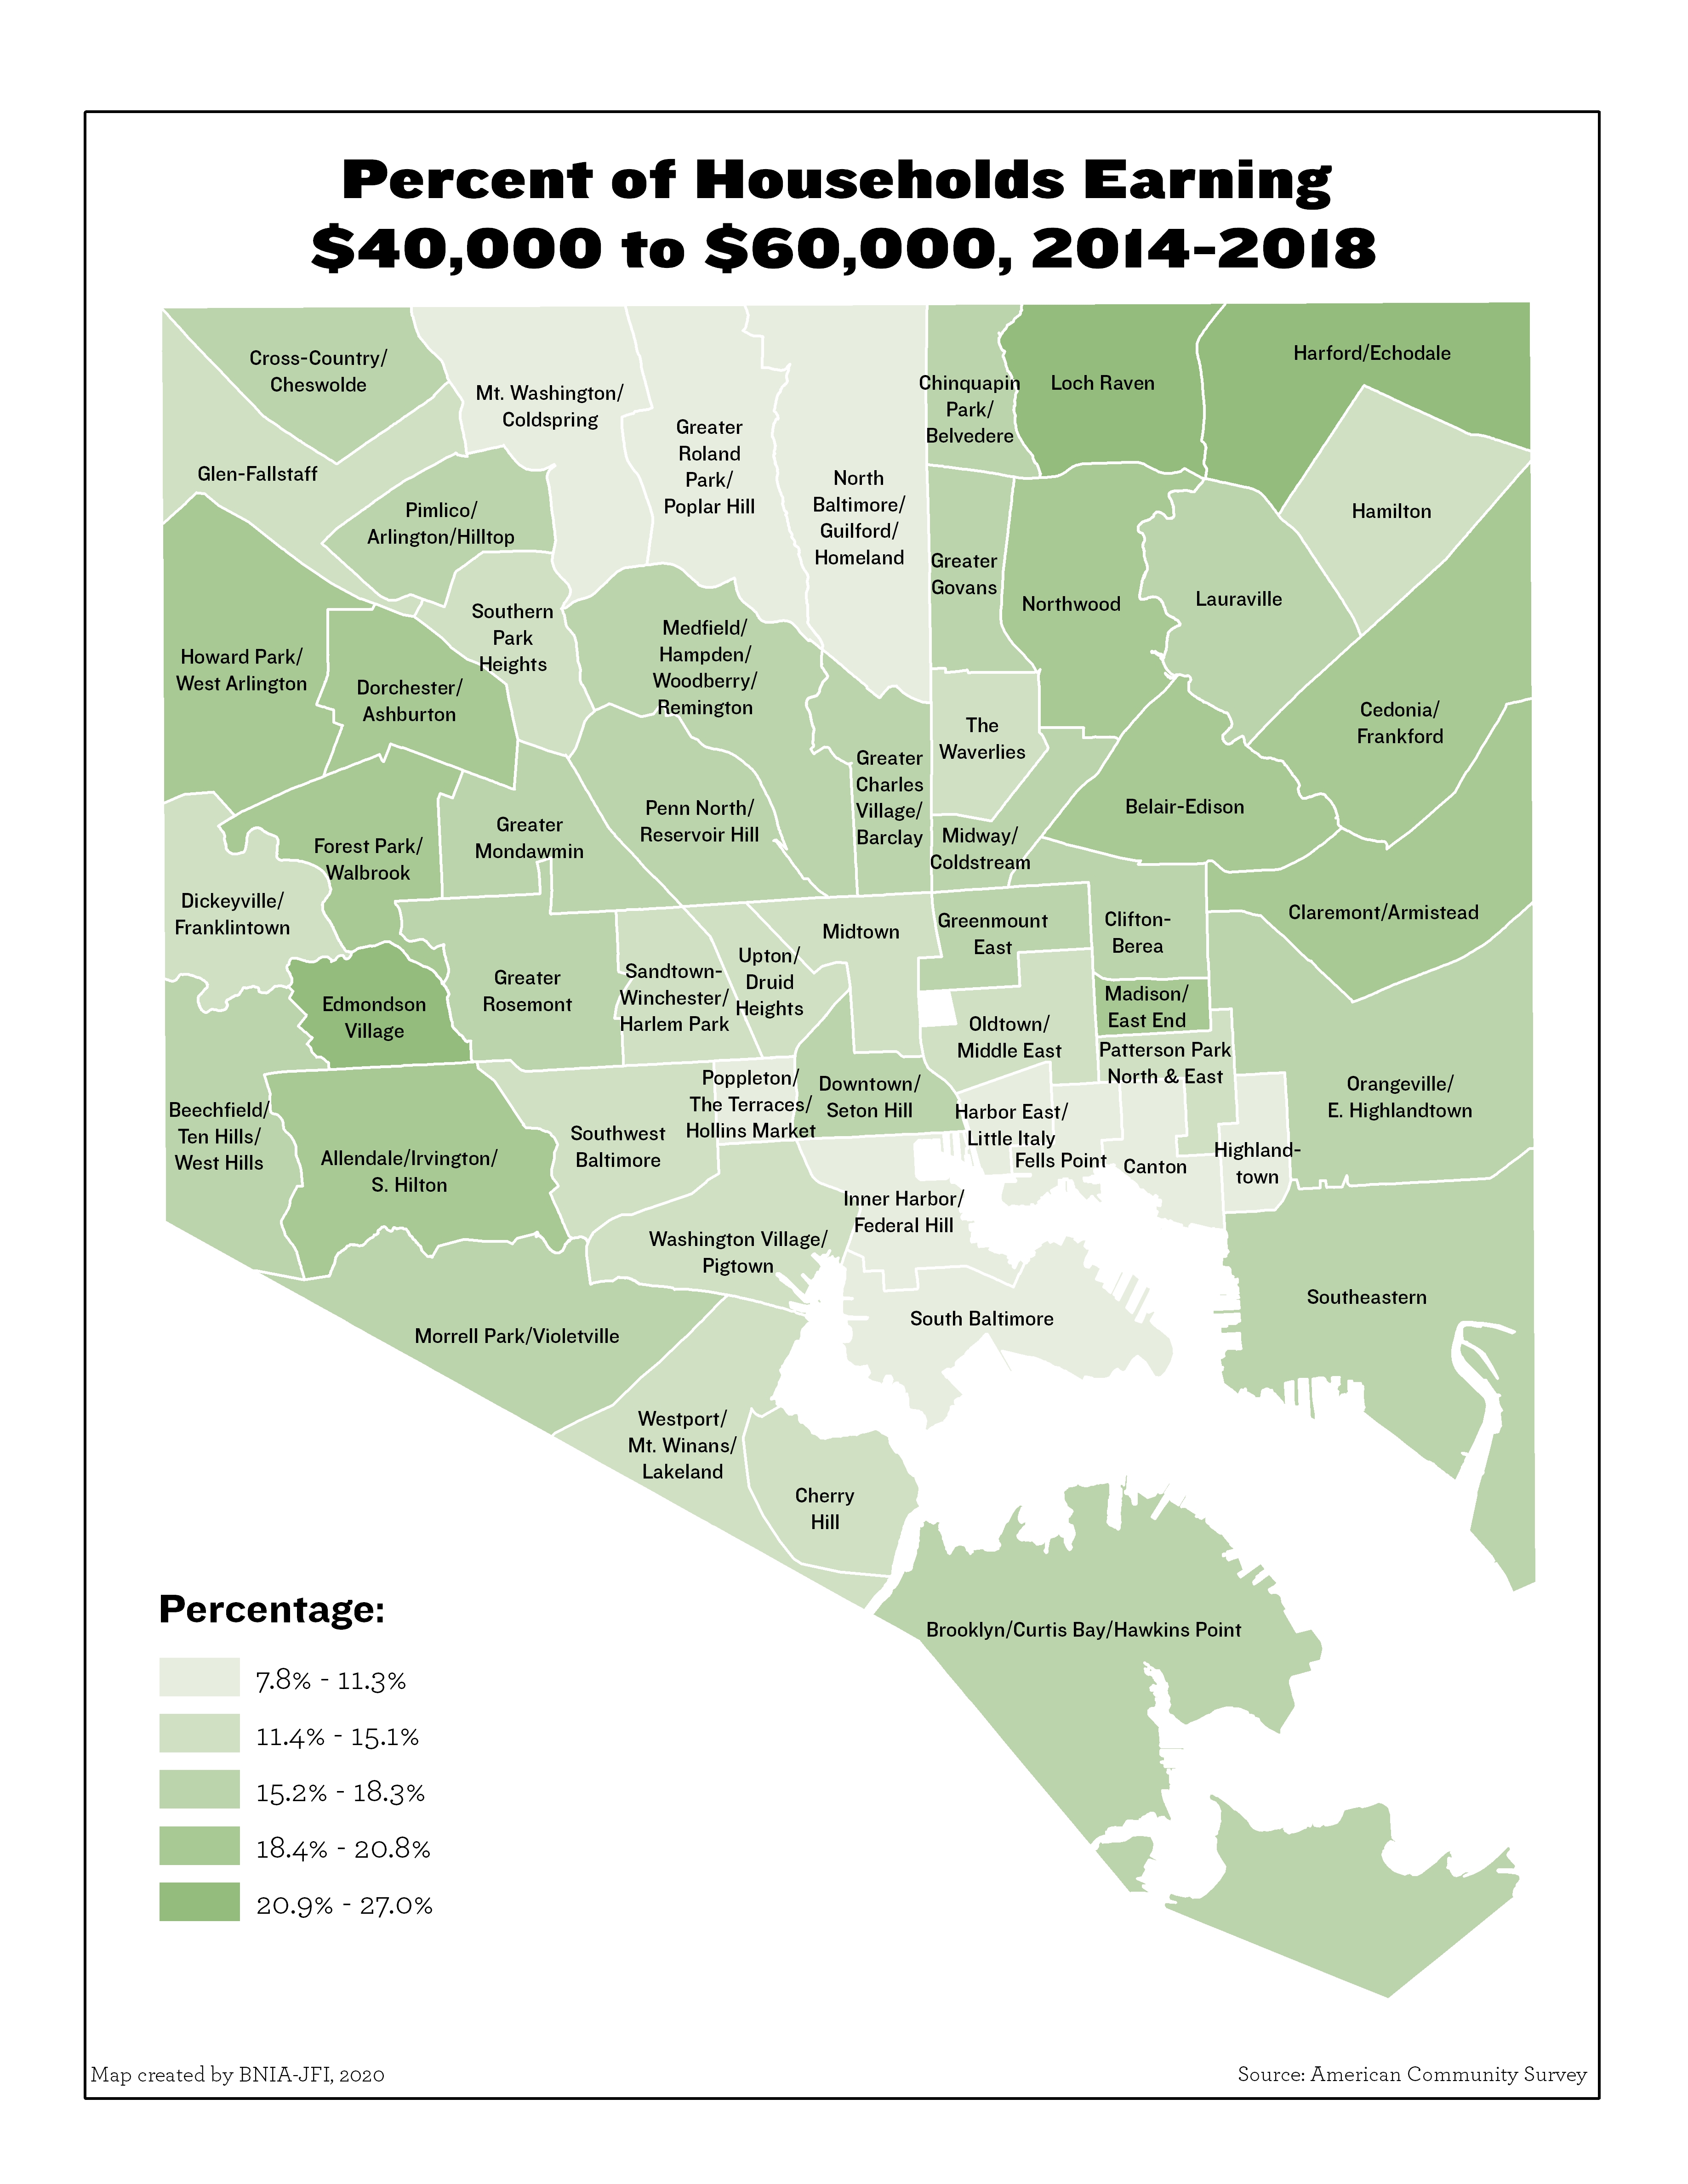
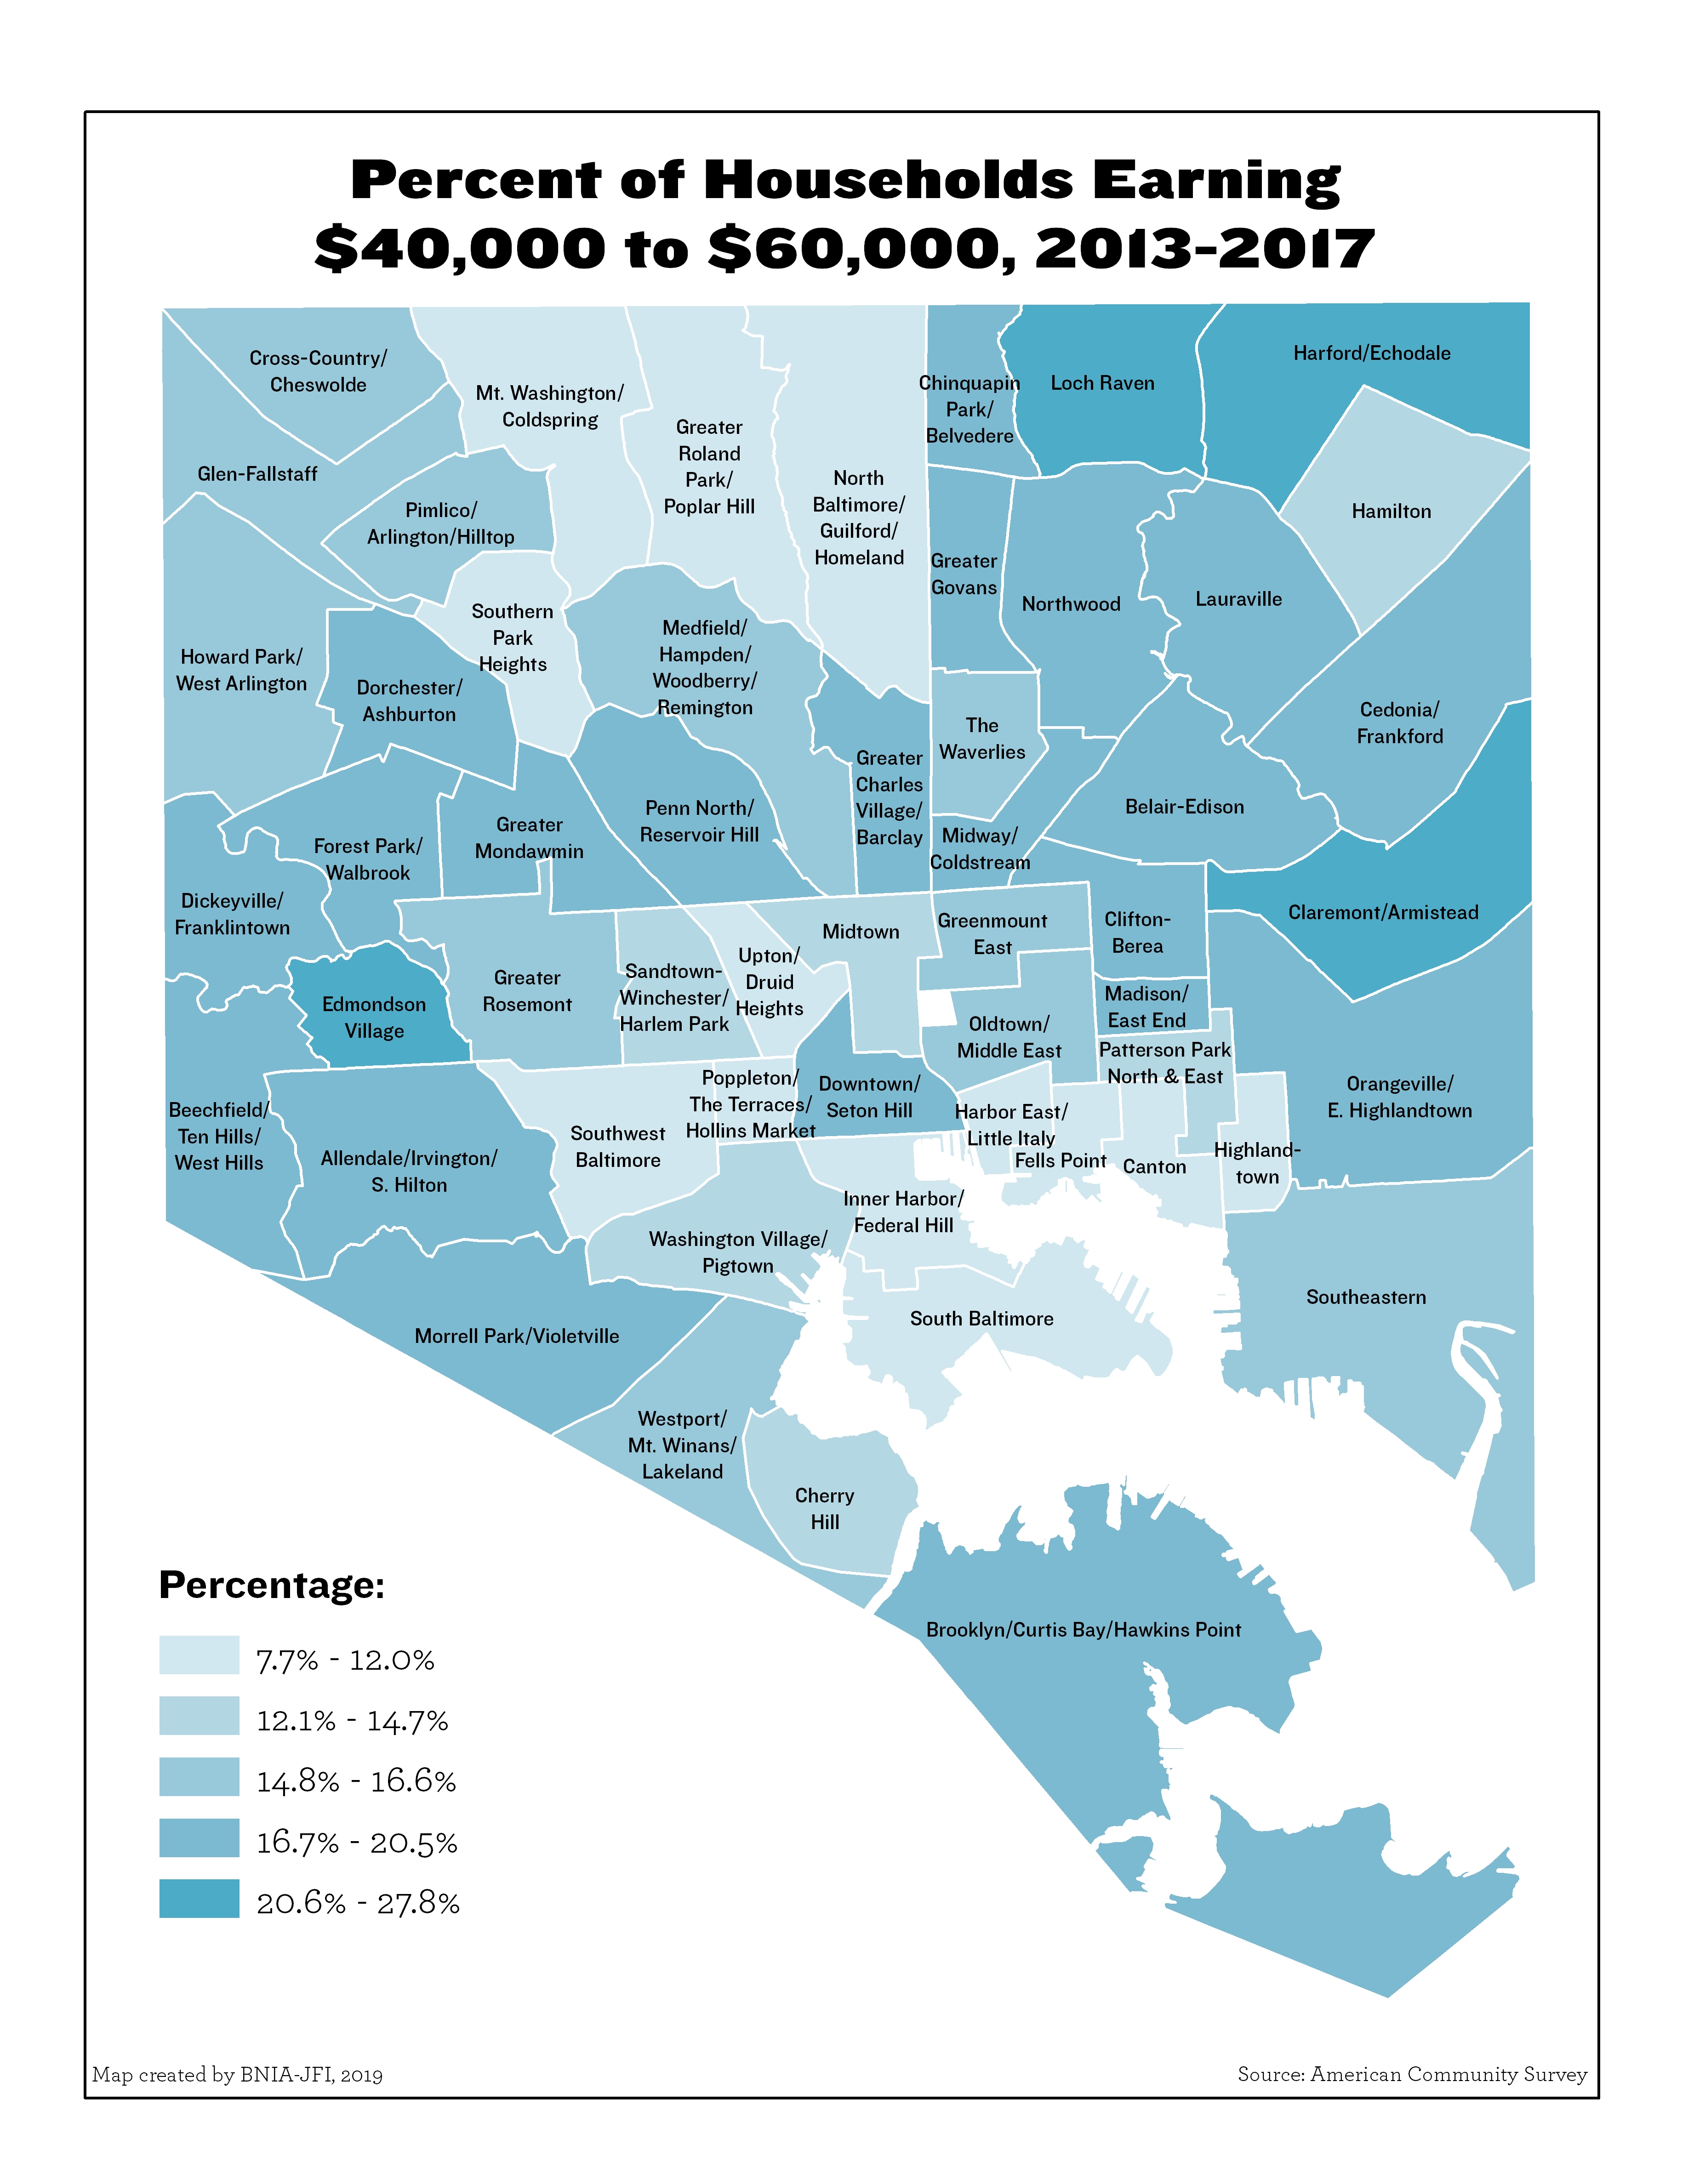
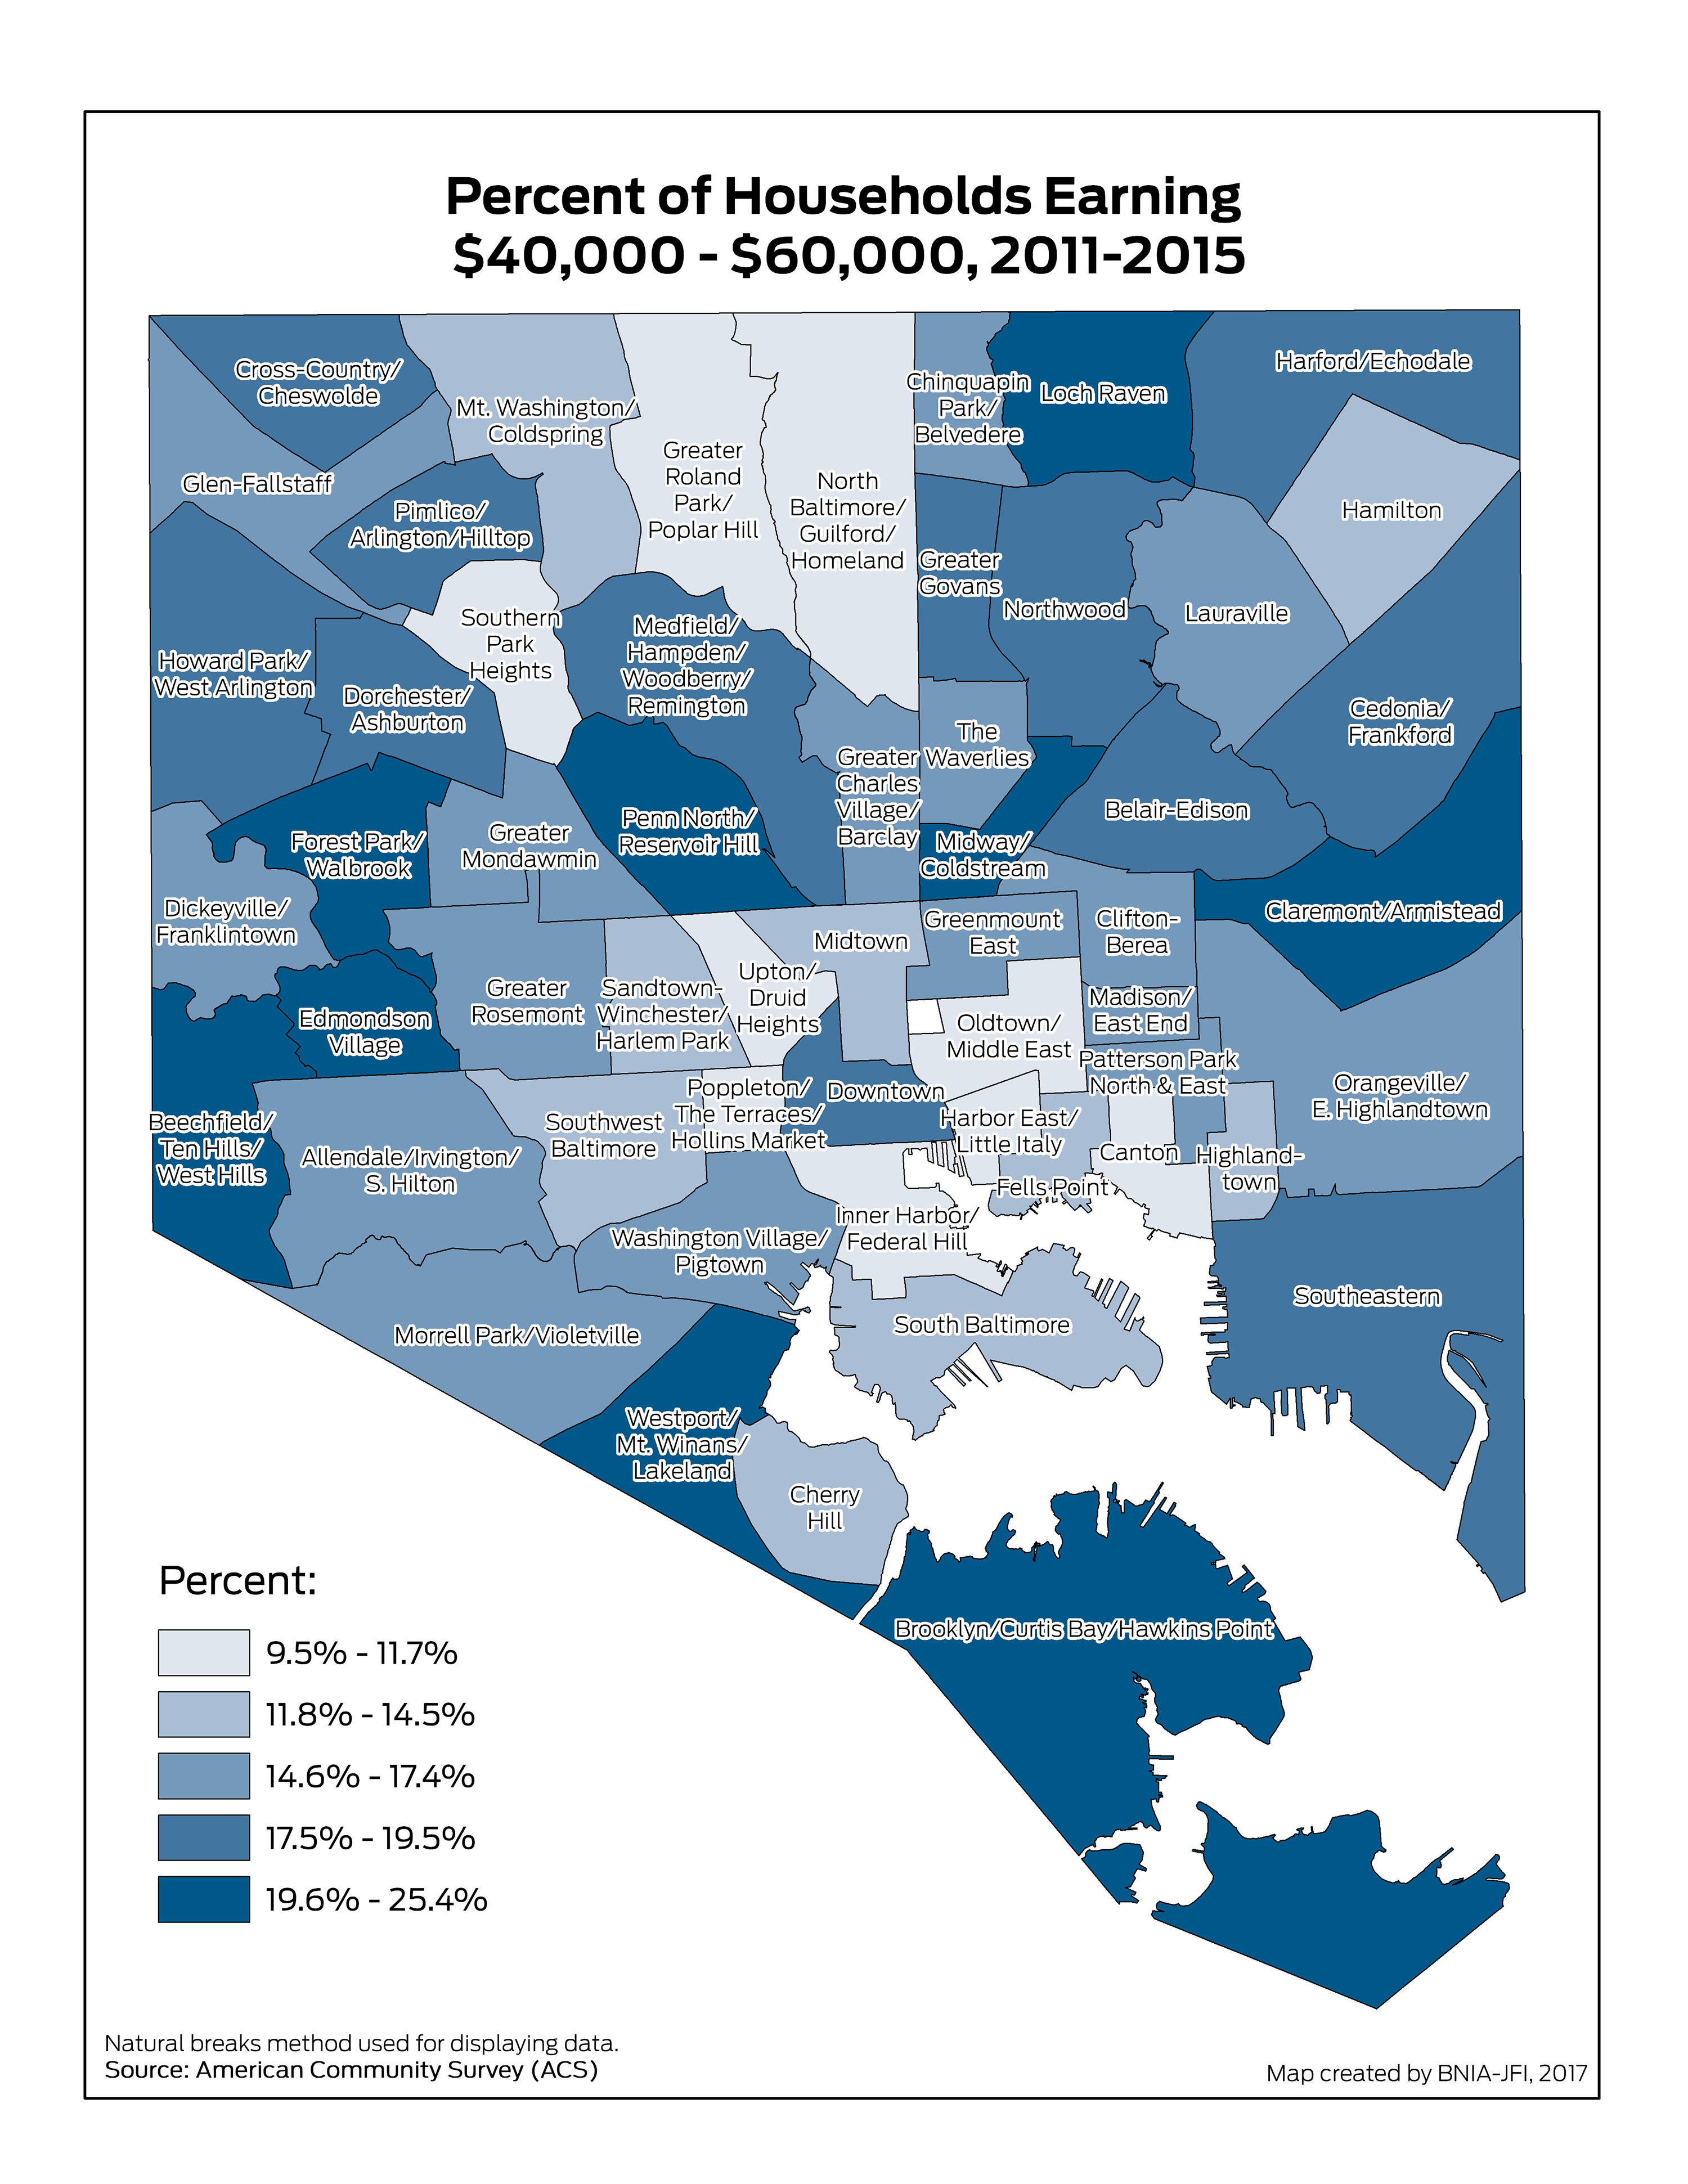
Percent of Households Earning $40,000 to $60,000
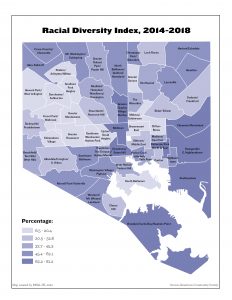
Racial Diversity Index
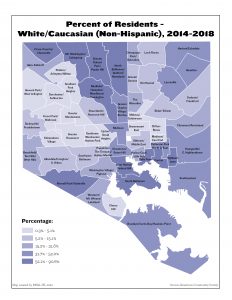
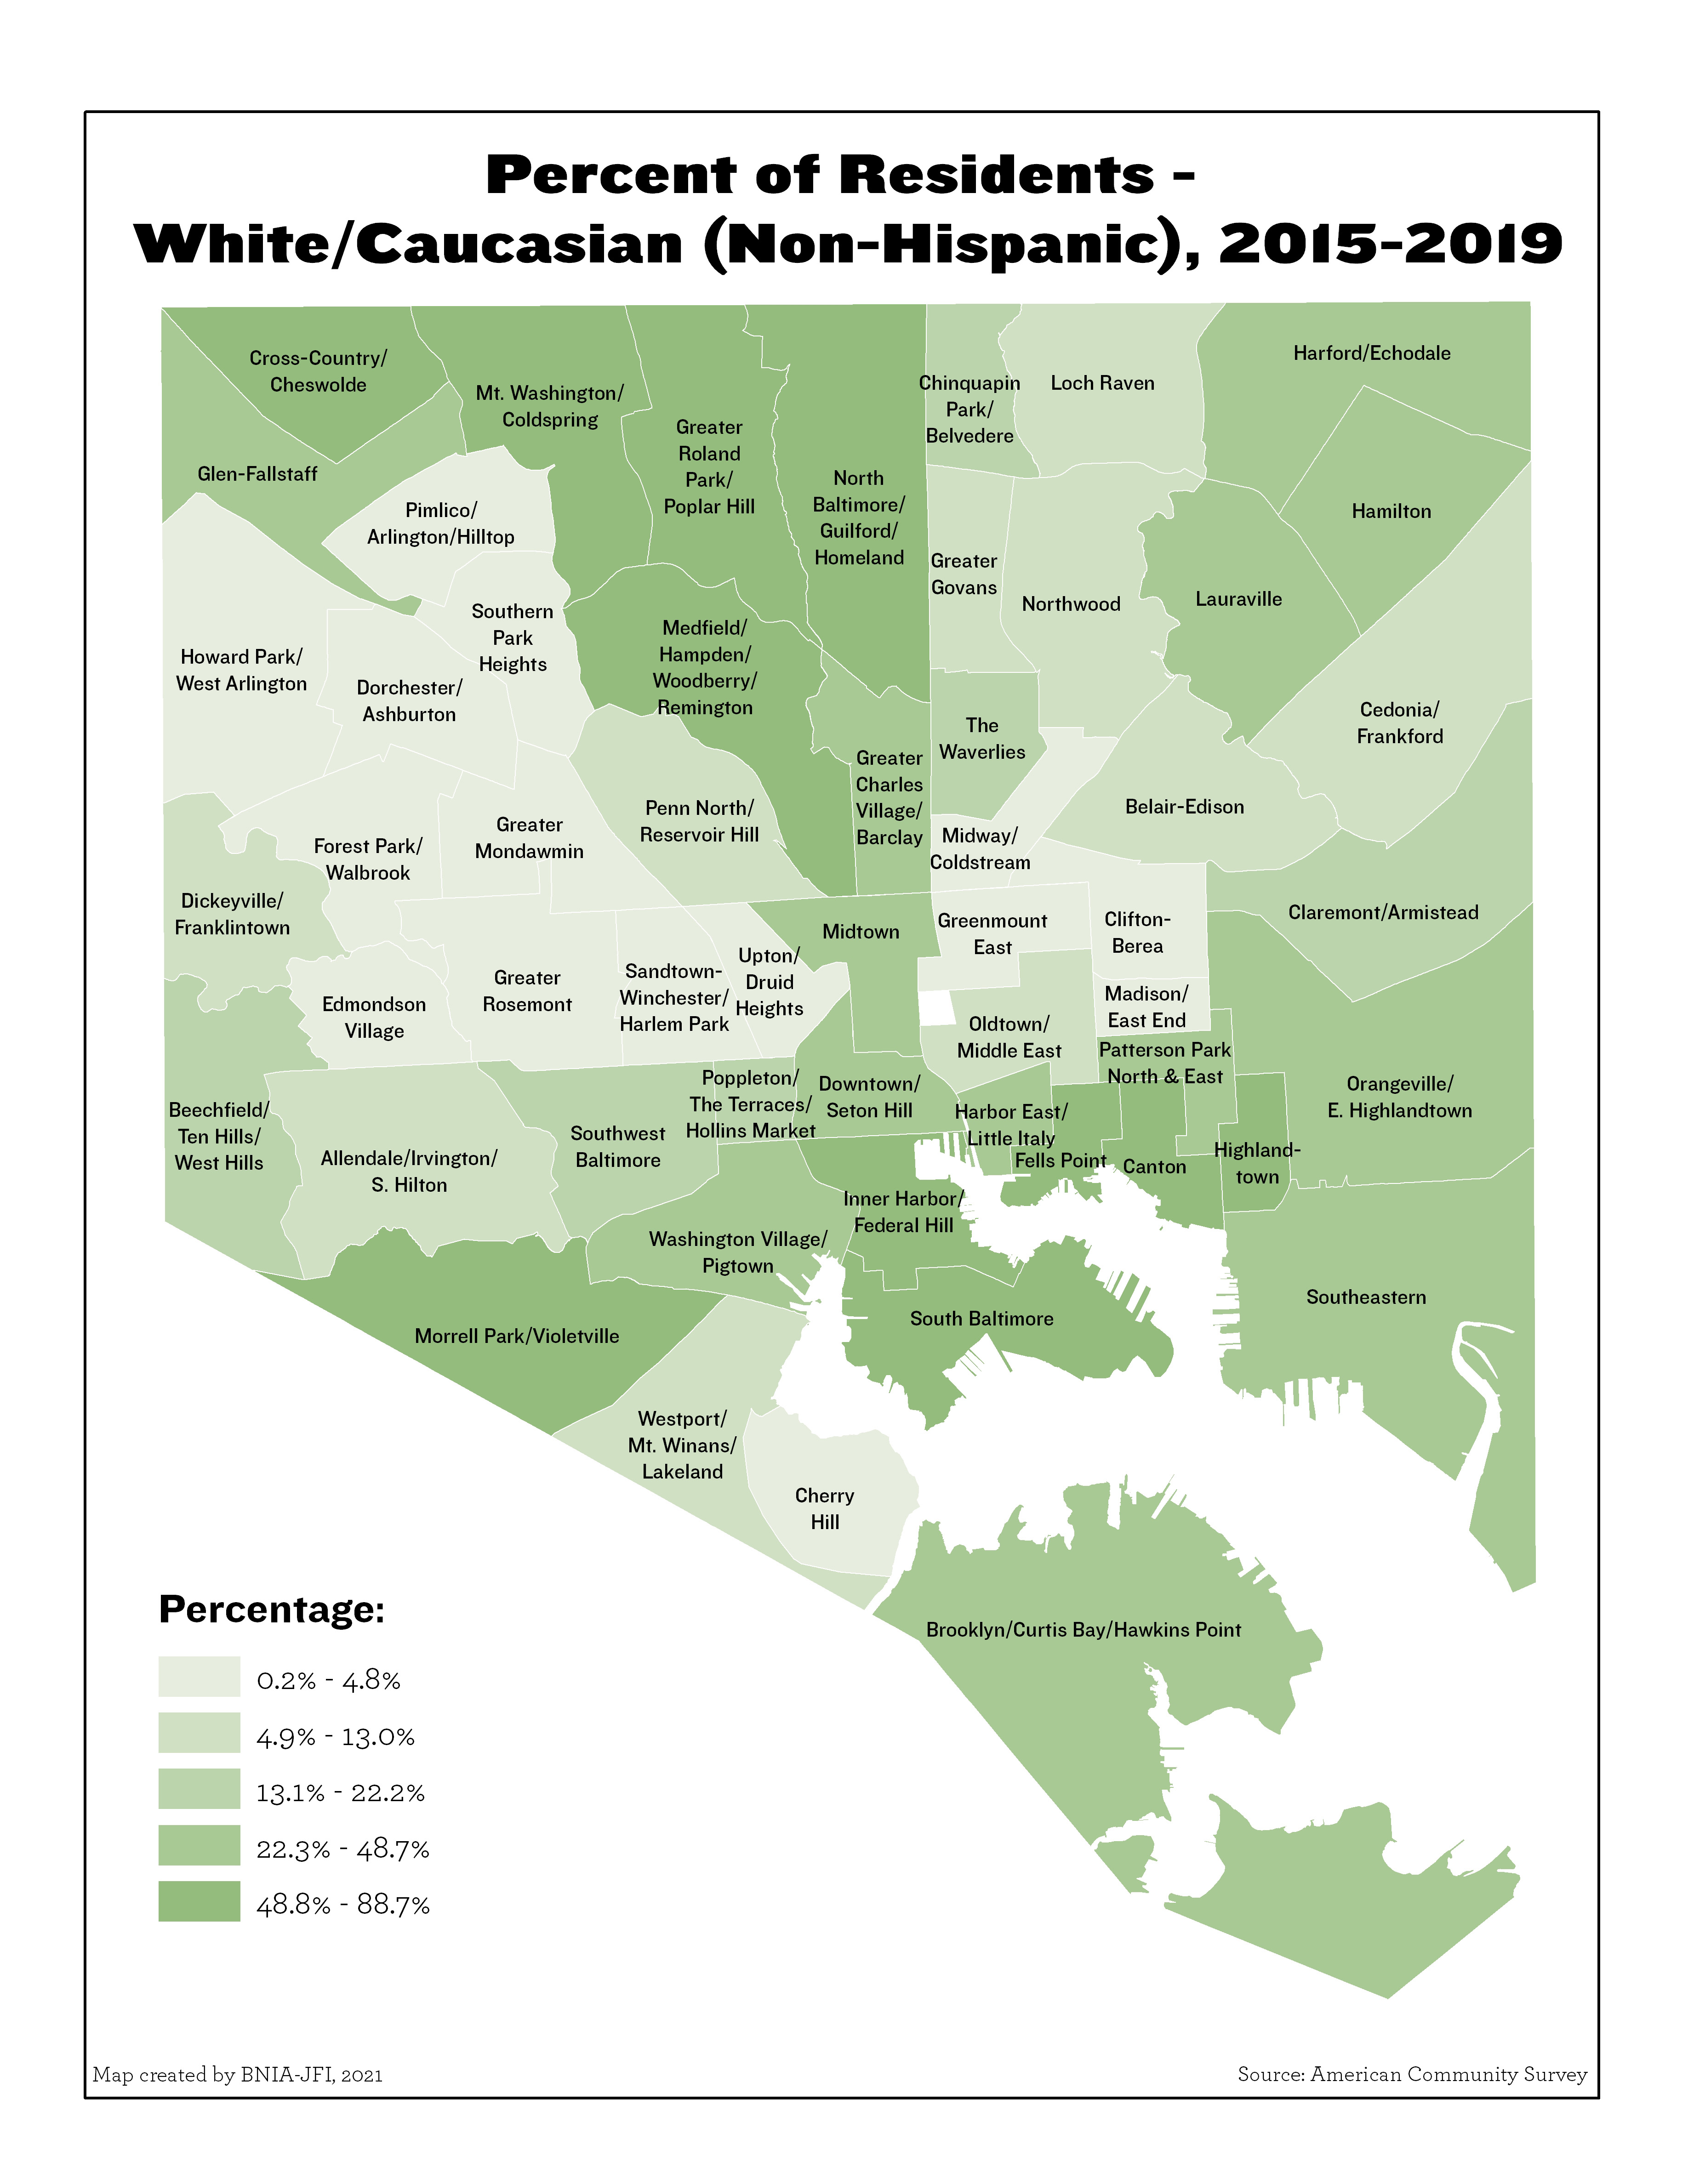
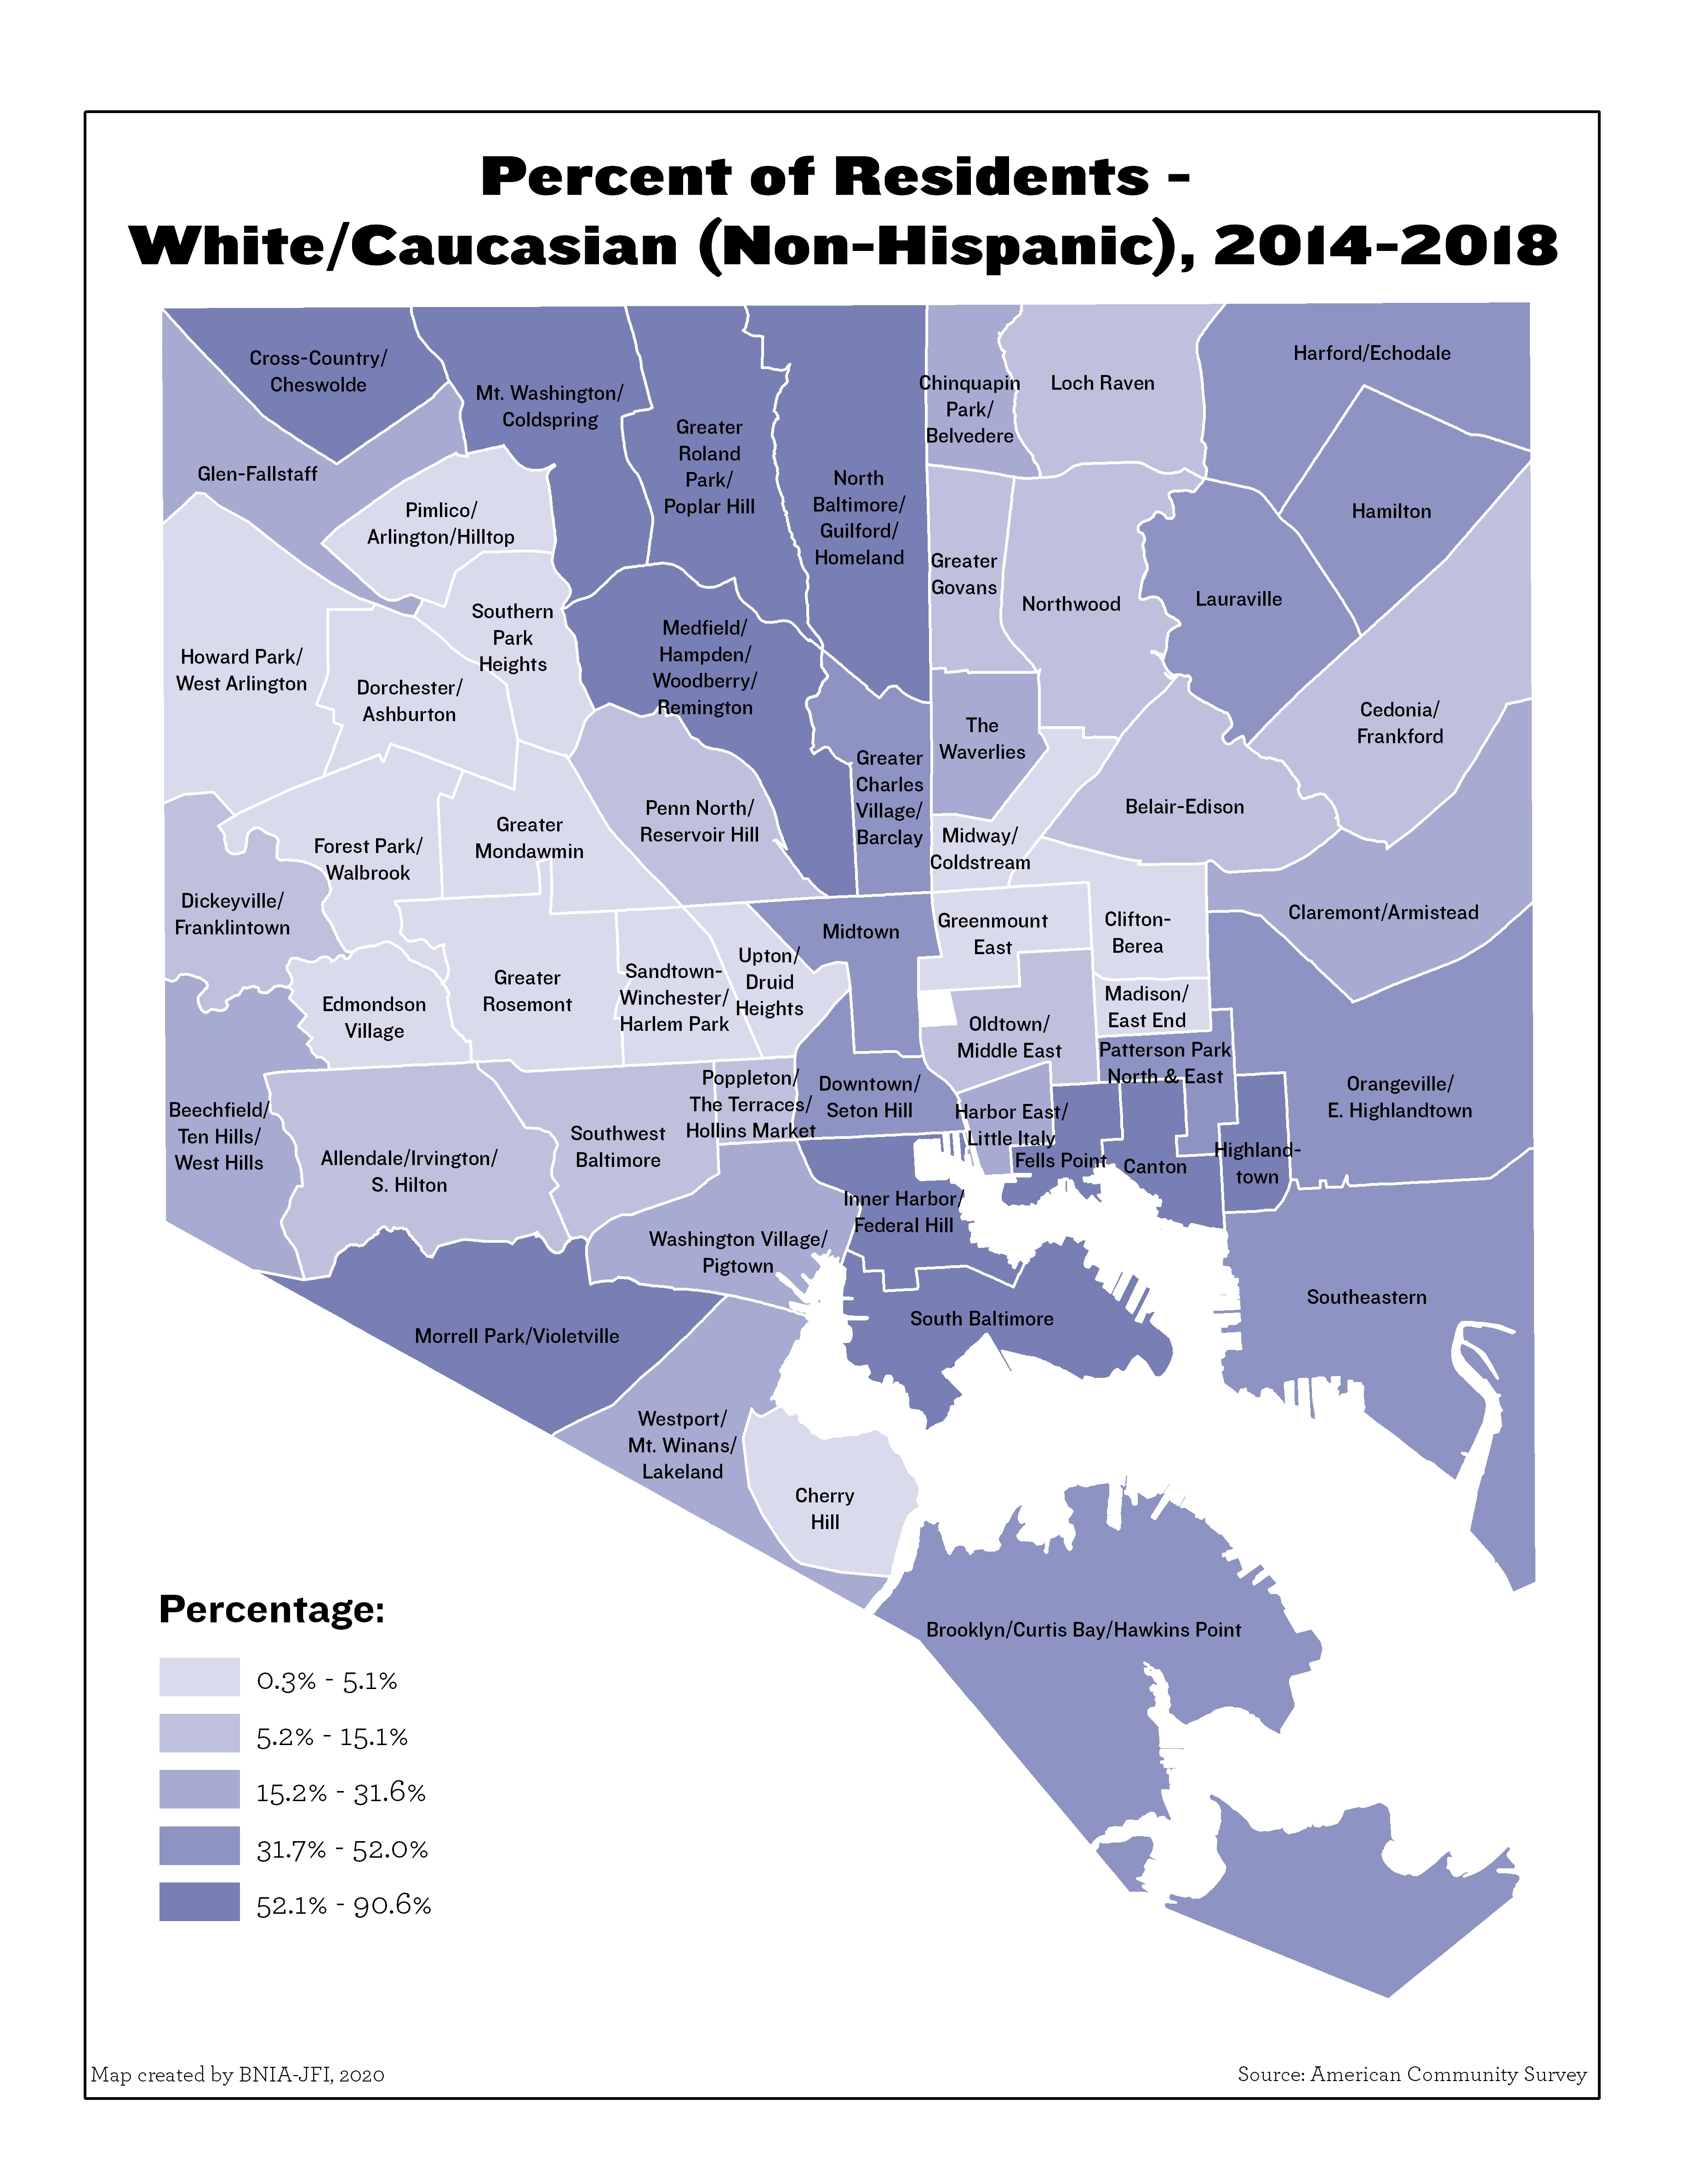
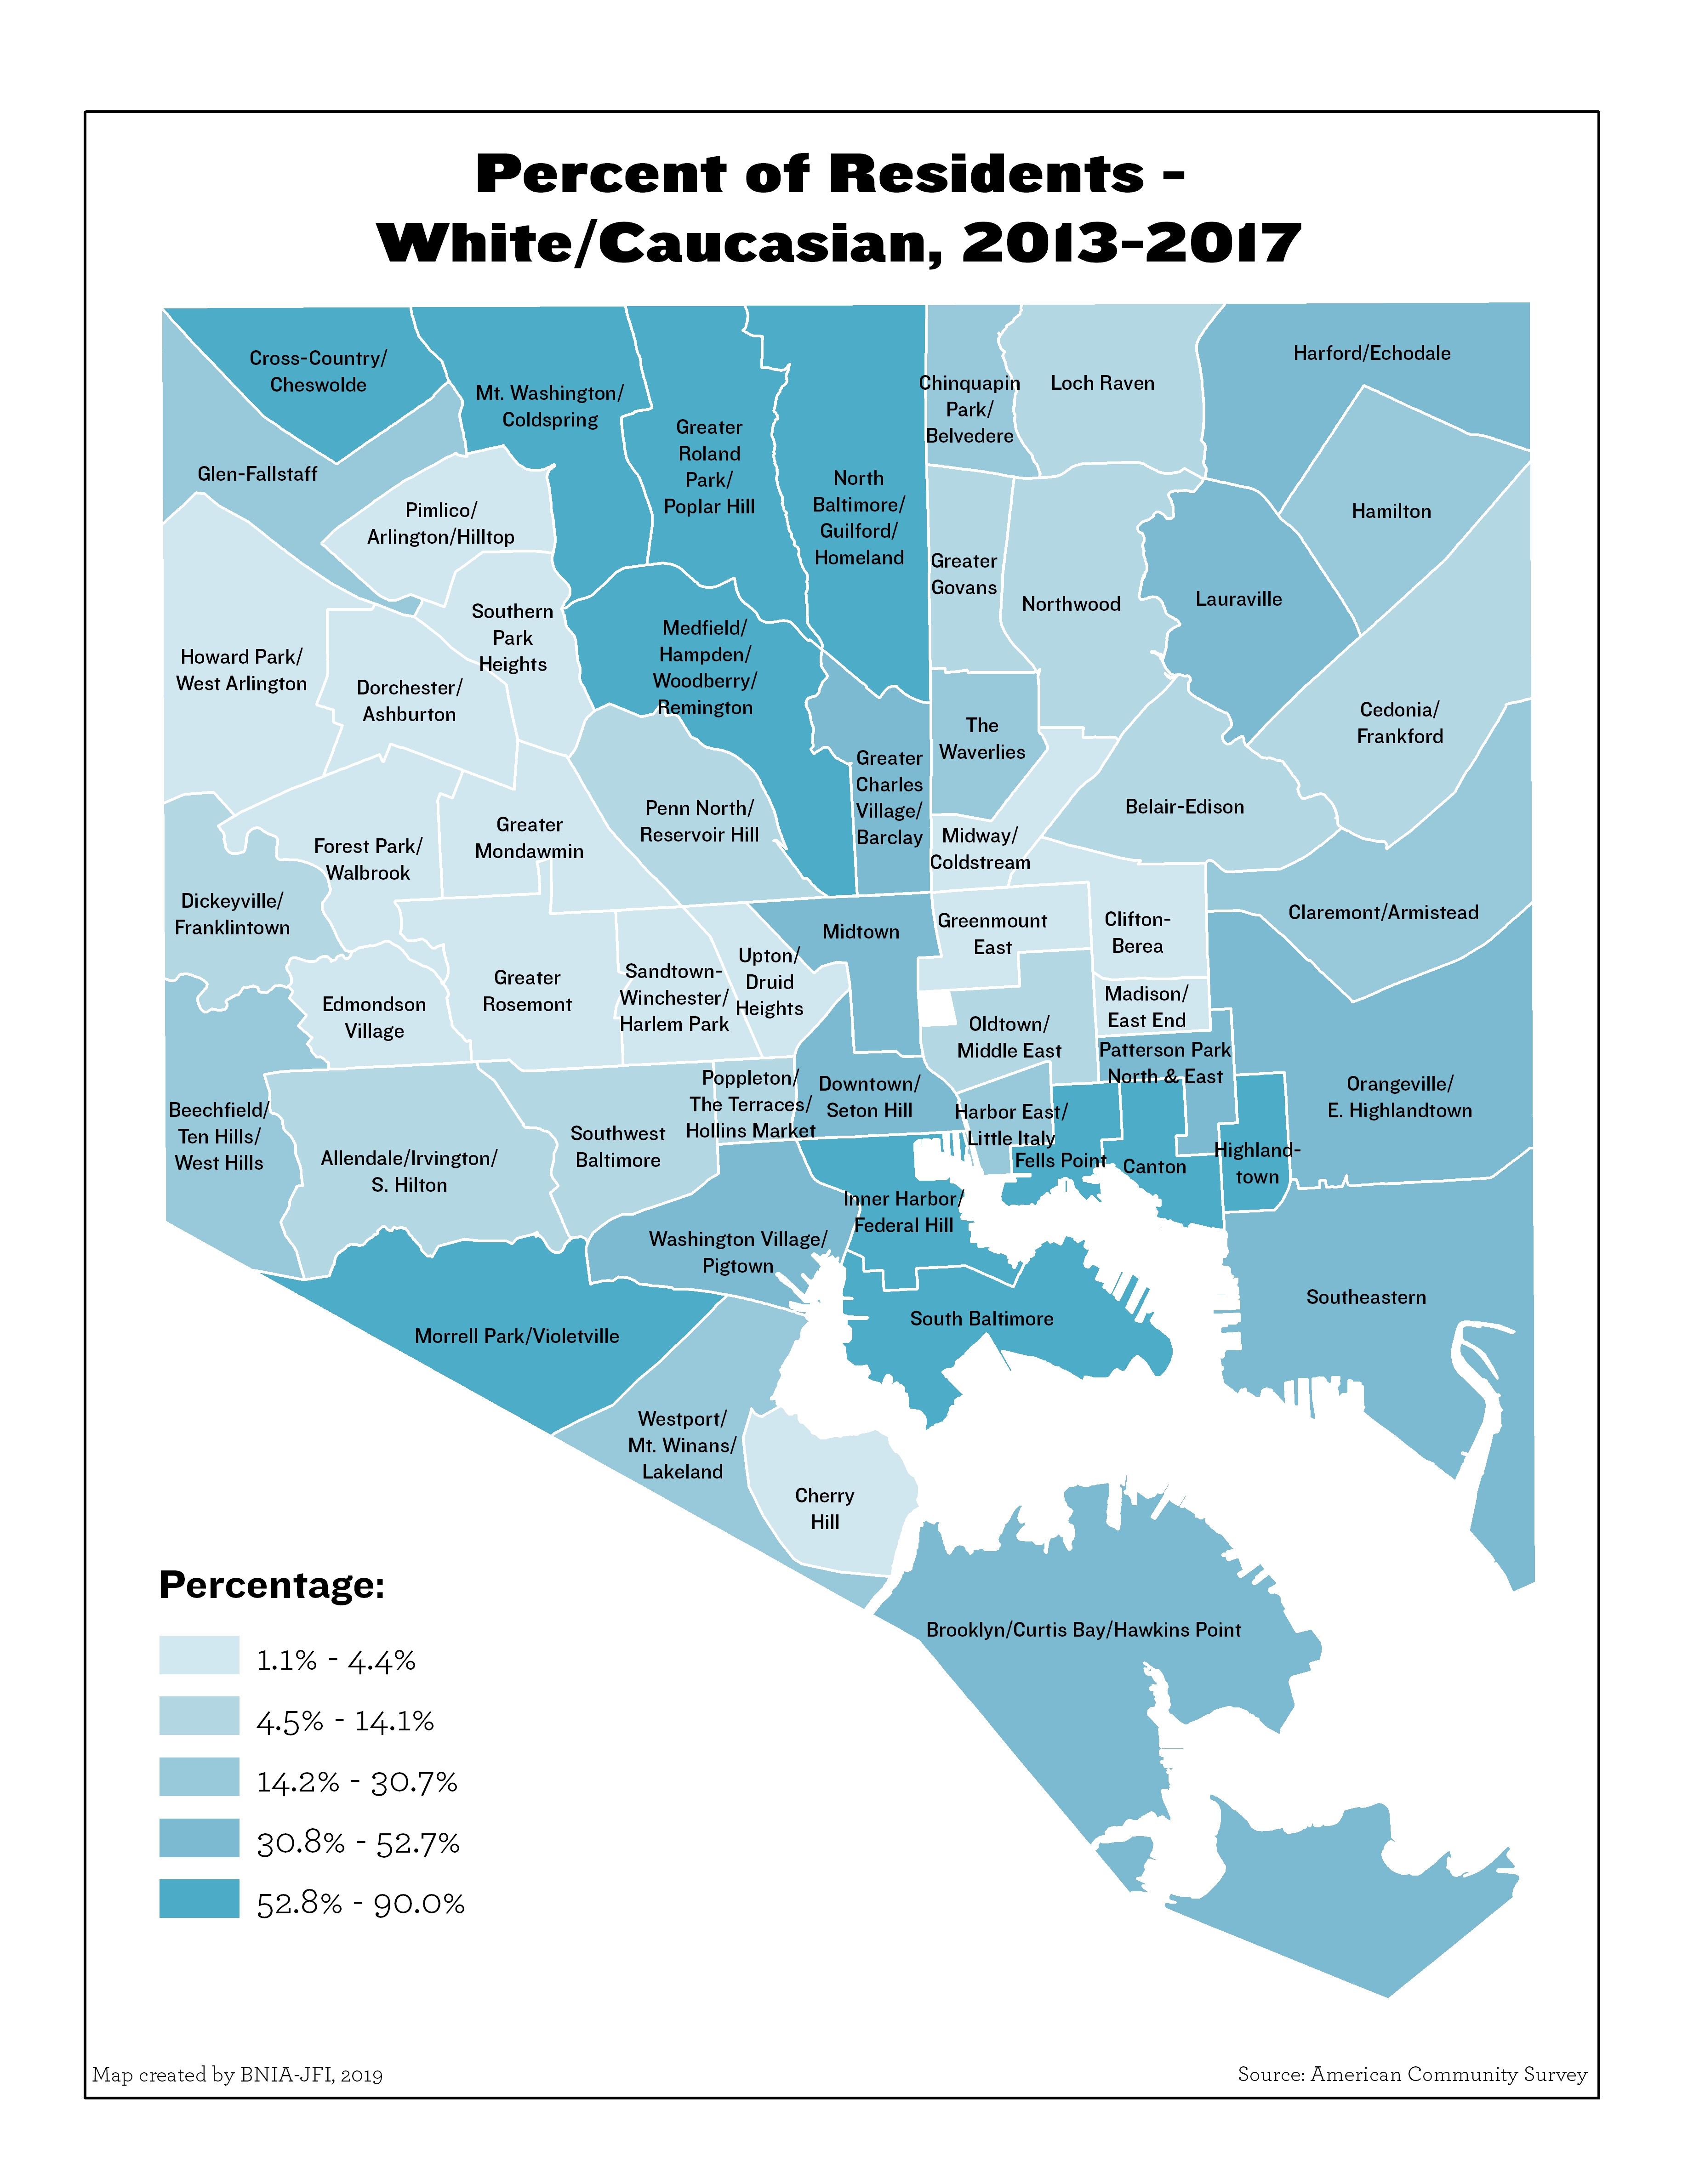
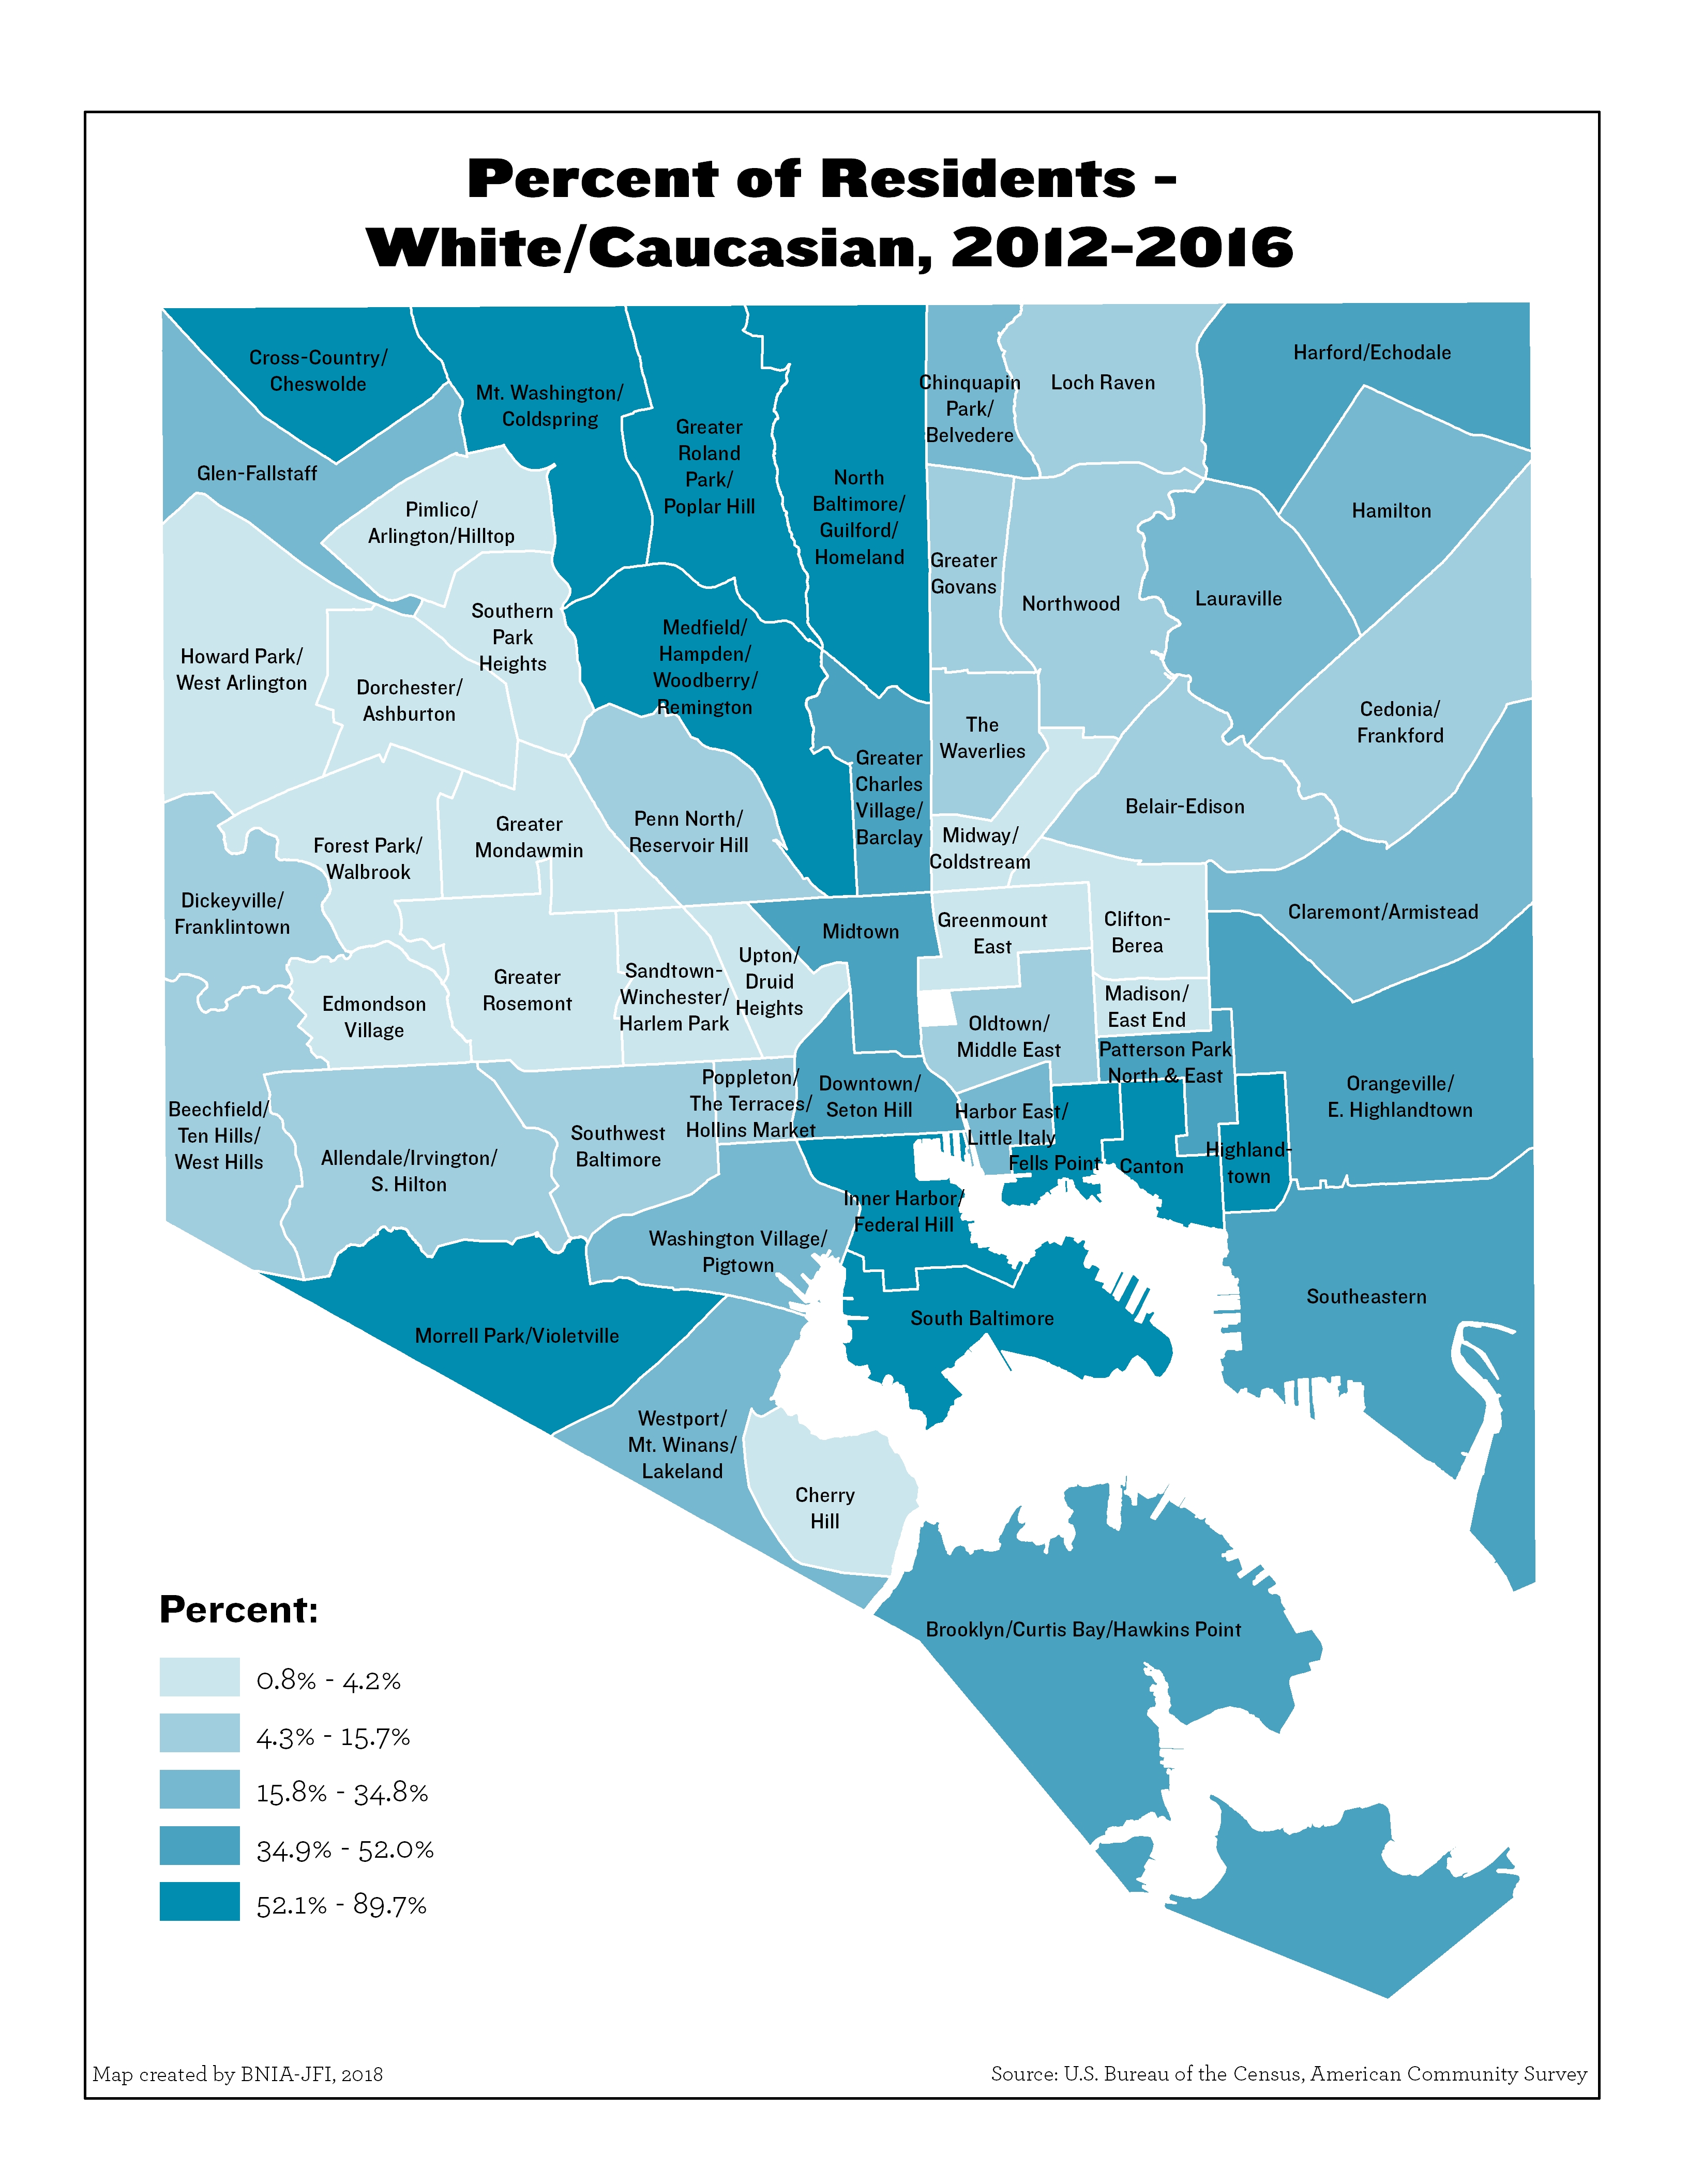
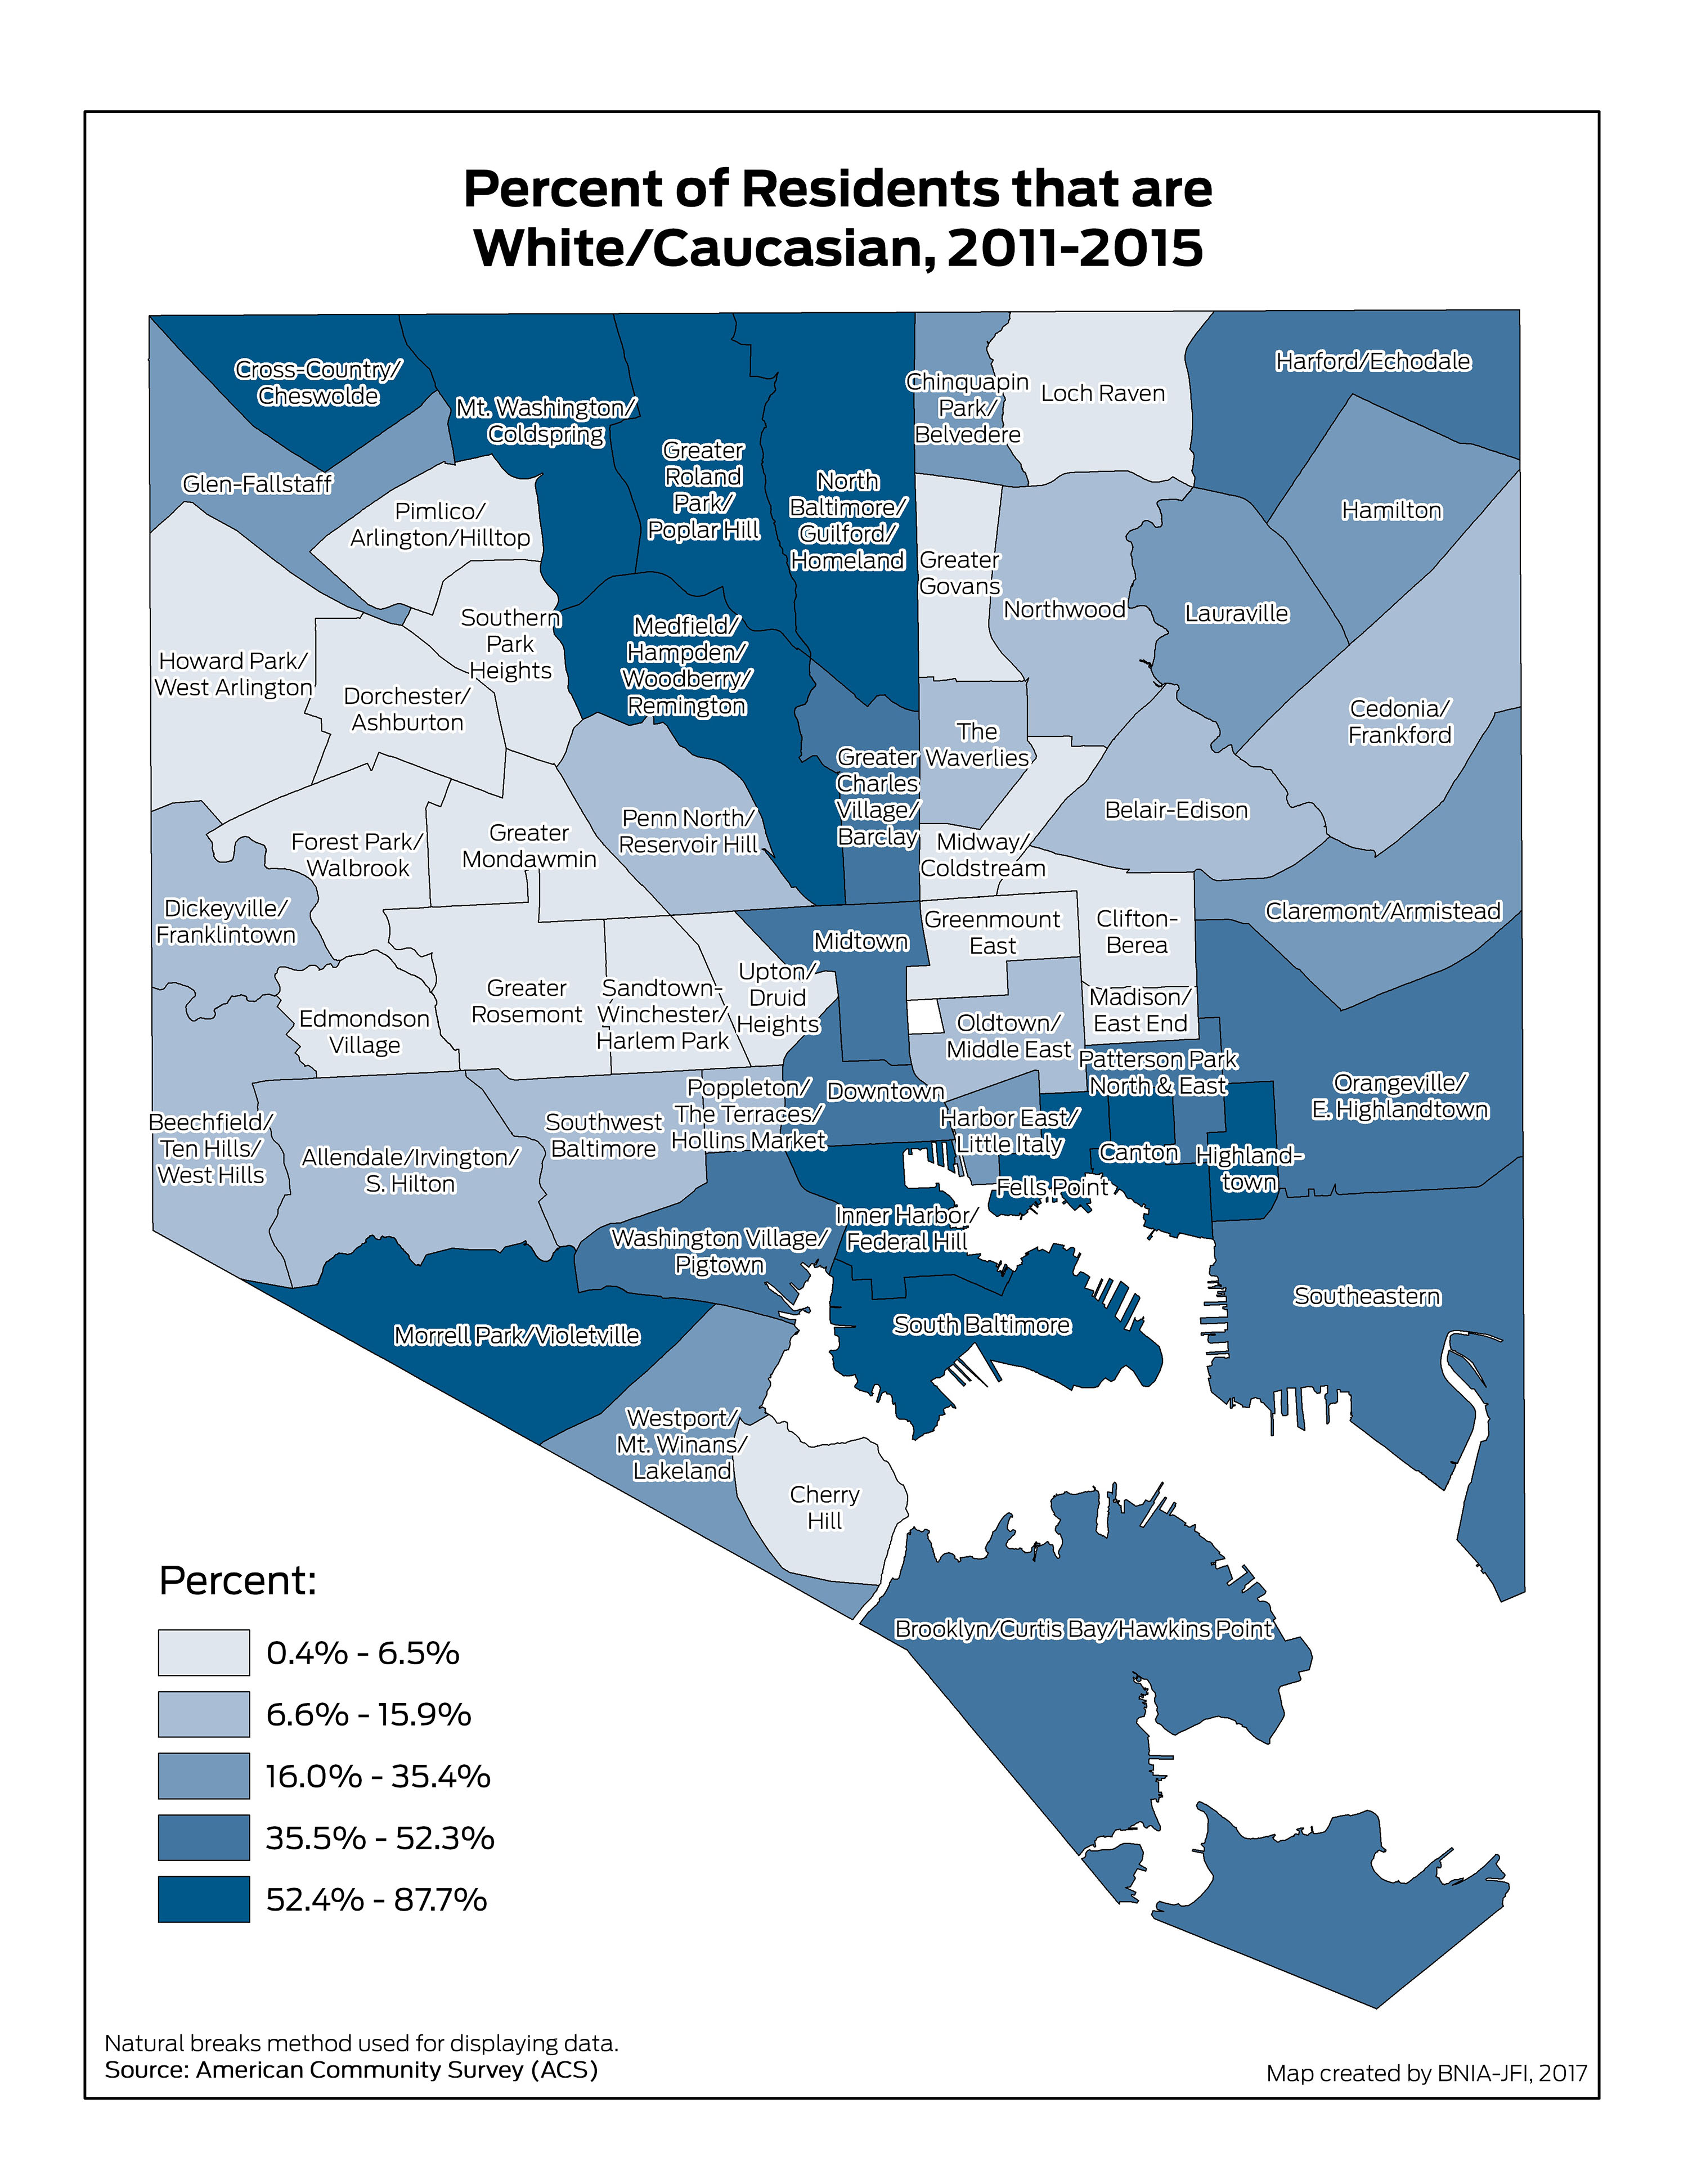
Percent of Residents – White/Caucasian (Non-Hispanic)
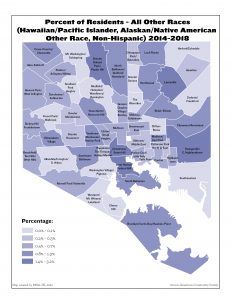
Percent of Residents – All Other Races (Hawaiian/Pacific Islander, Alaskan/Native American, Other Race, Non-Hispanic)
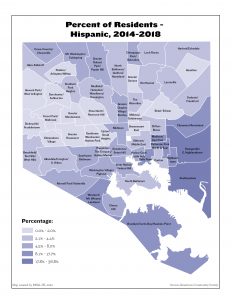
Percent of Residents – Hispanic
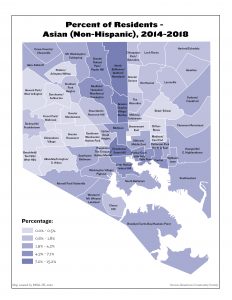
Percent of Residents – Asian (Non-Hispanic)
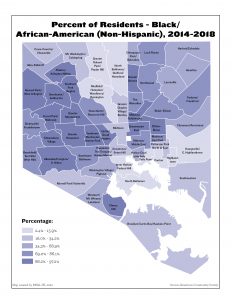
Percent of Residents – Black/African-American (Non-Hispanic)
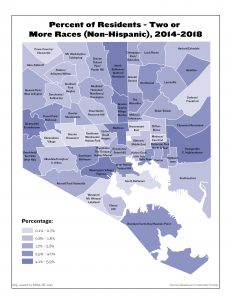
Percent of Residents – Two or More Races (Non-Hispanic)
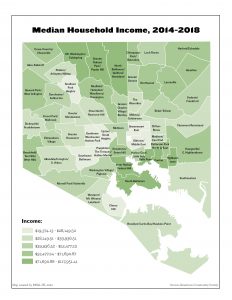
Median Household Income
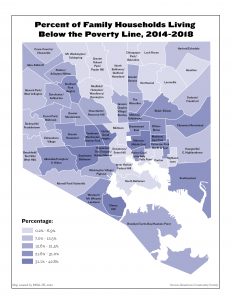
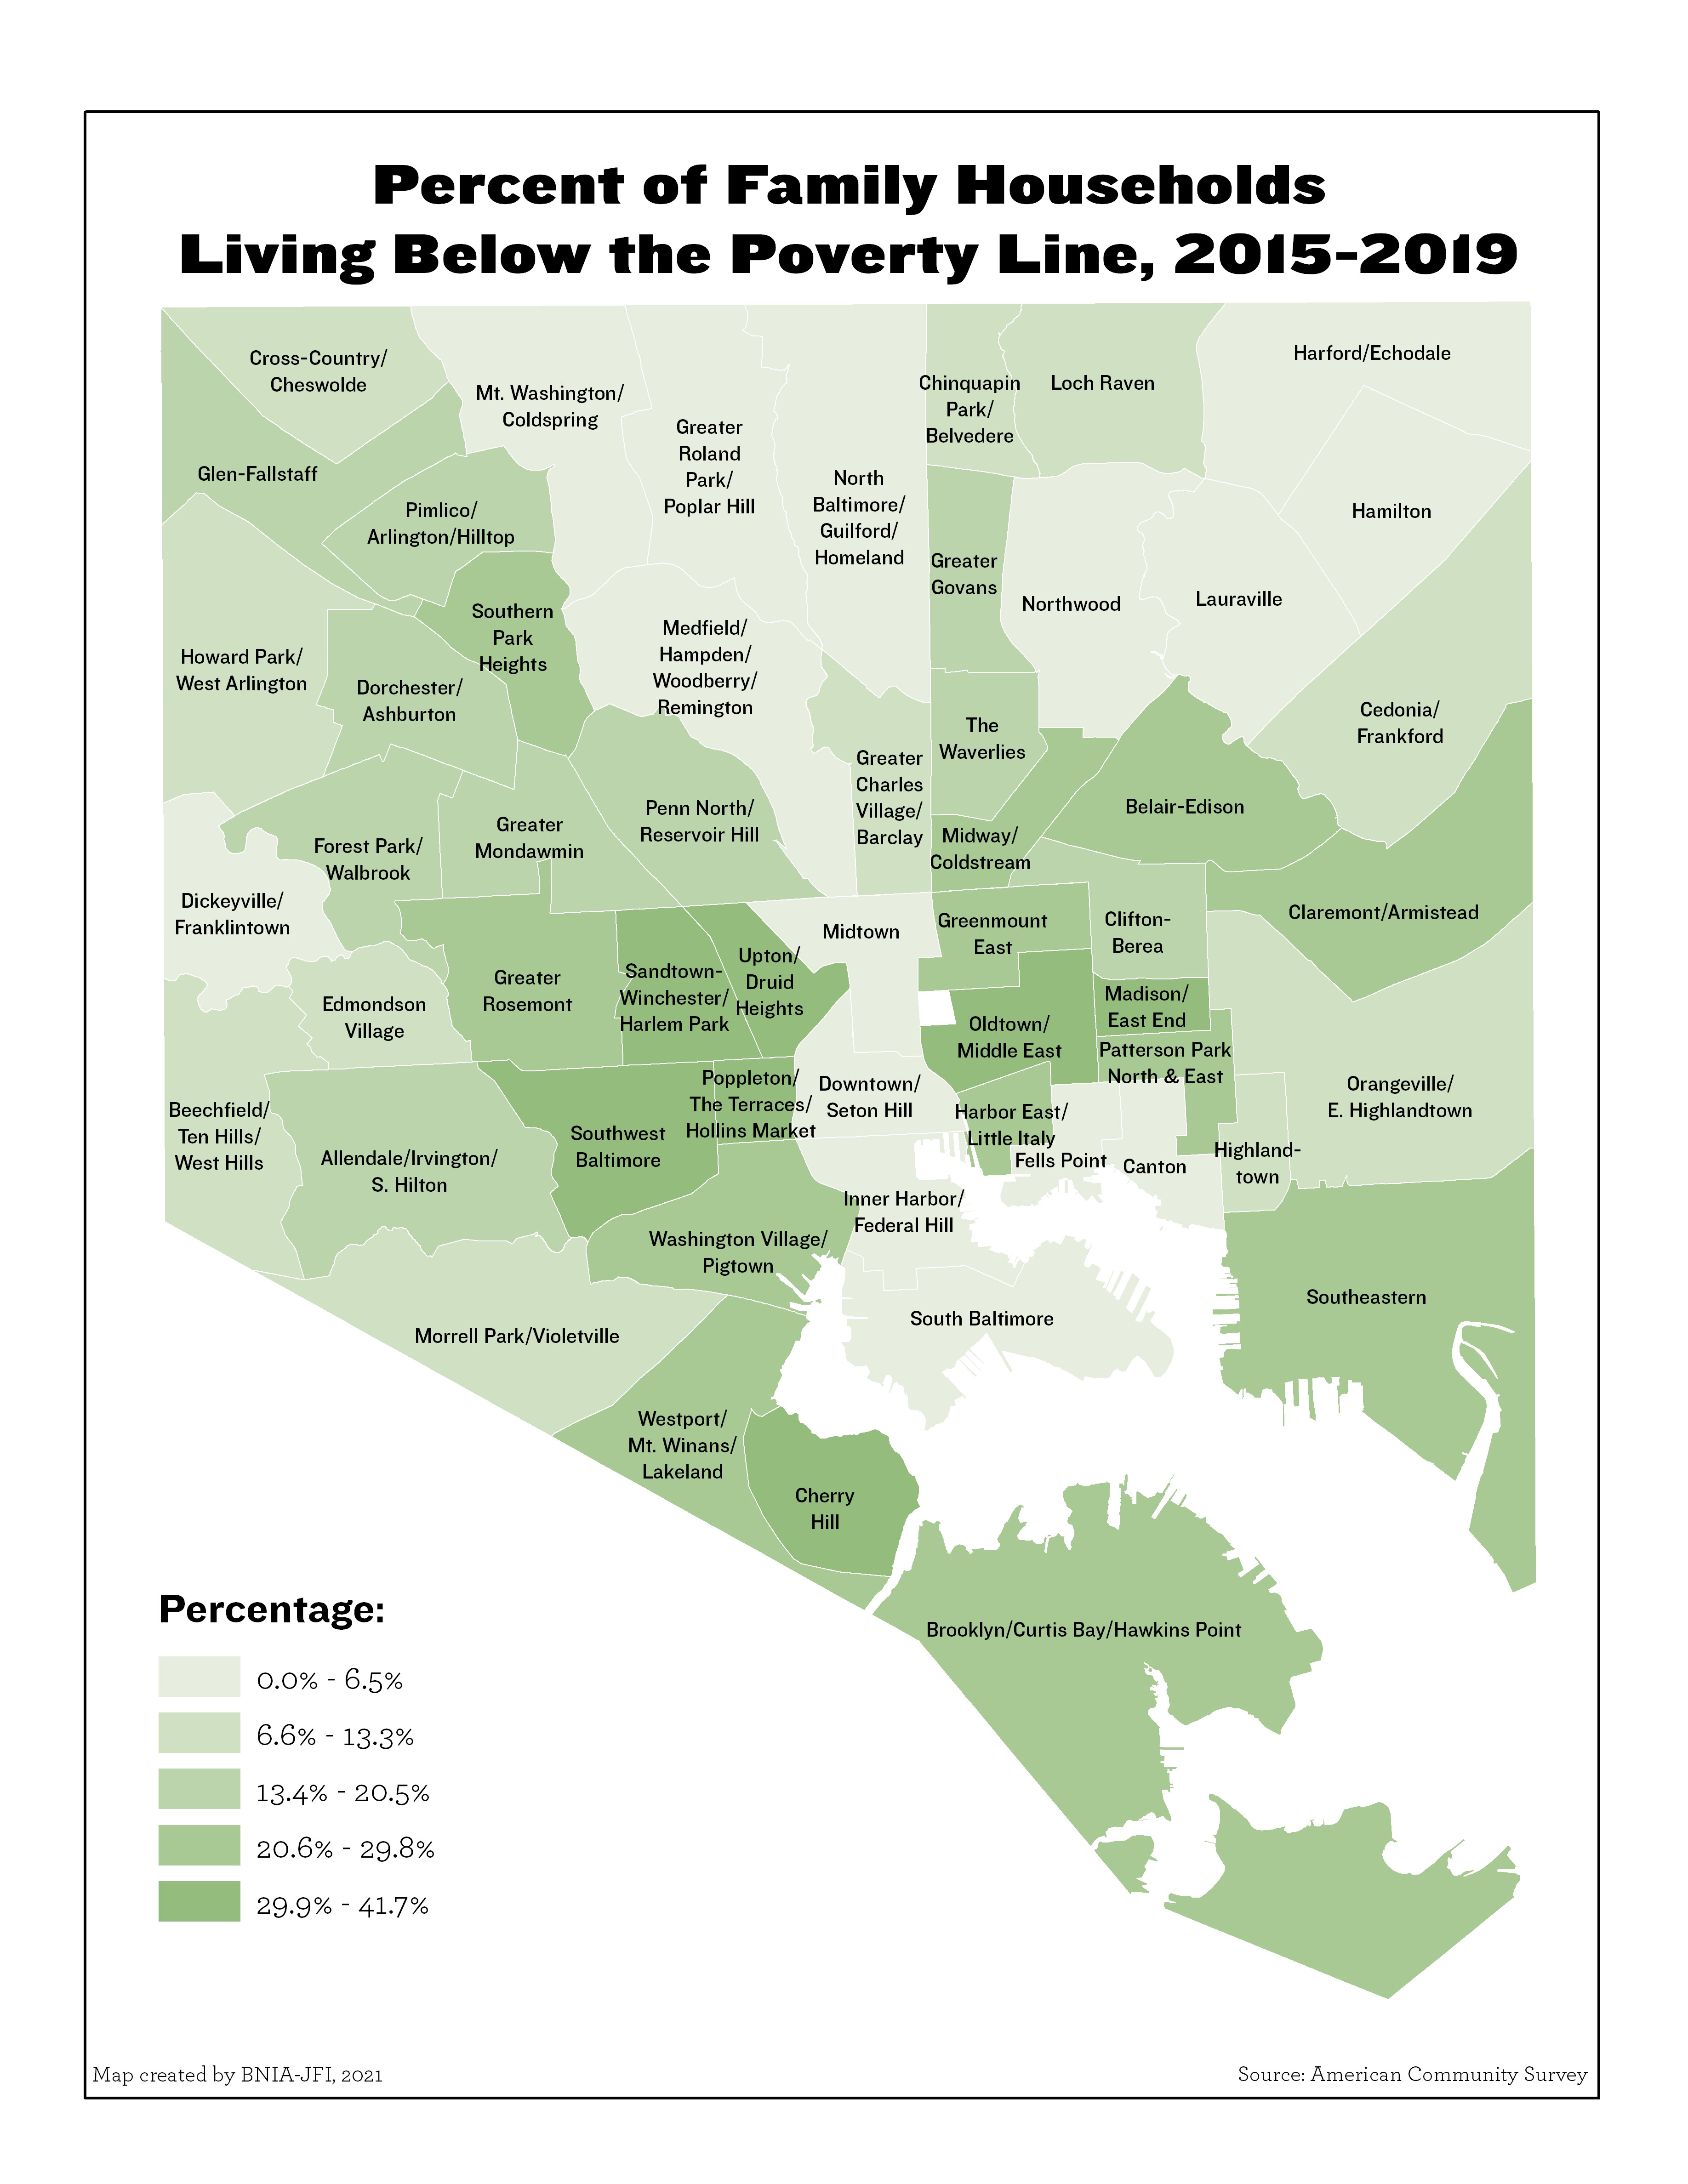
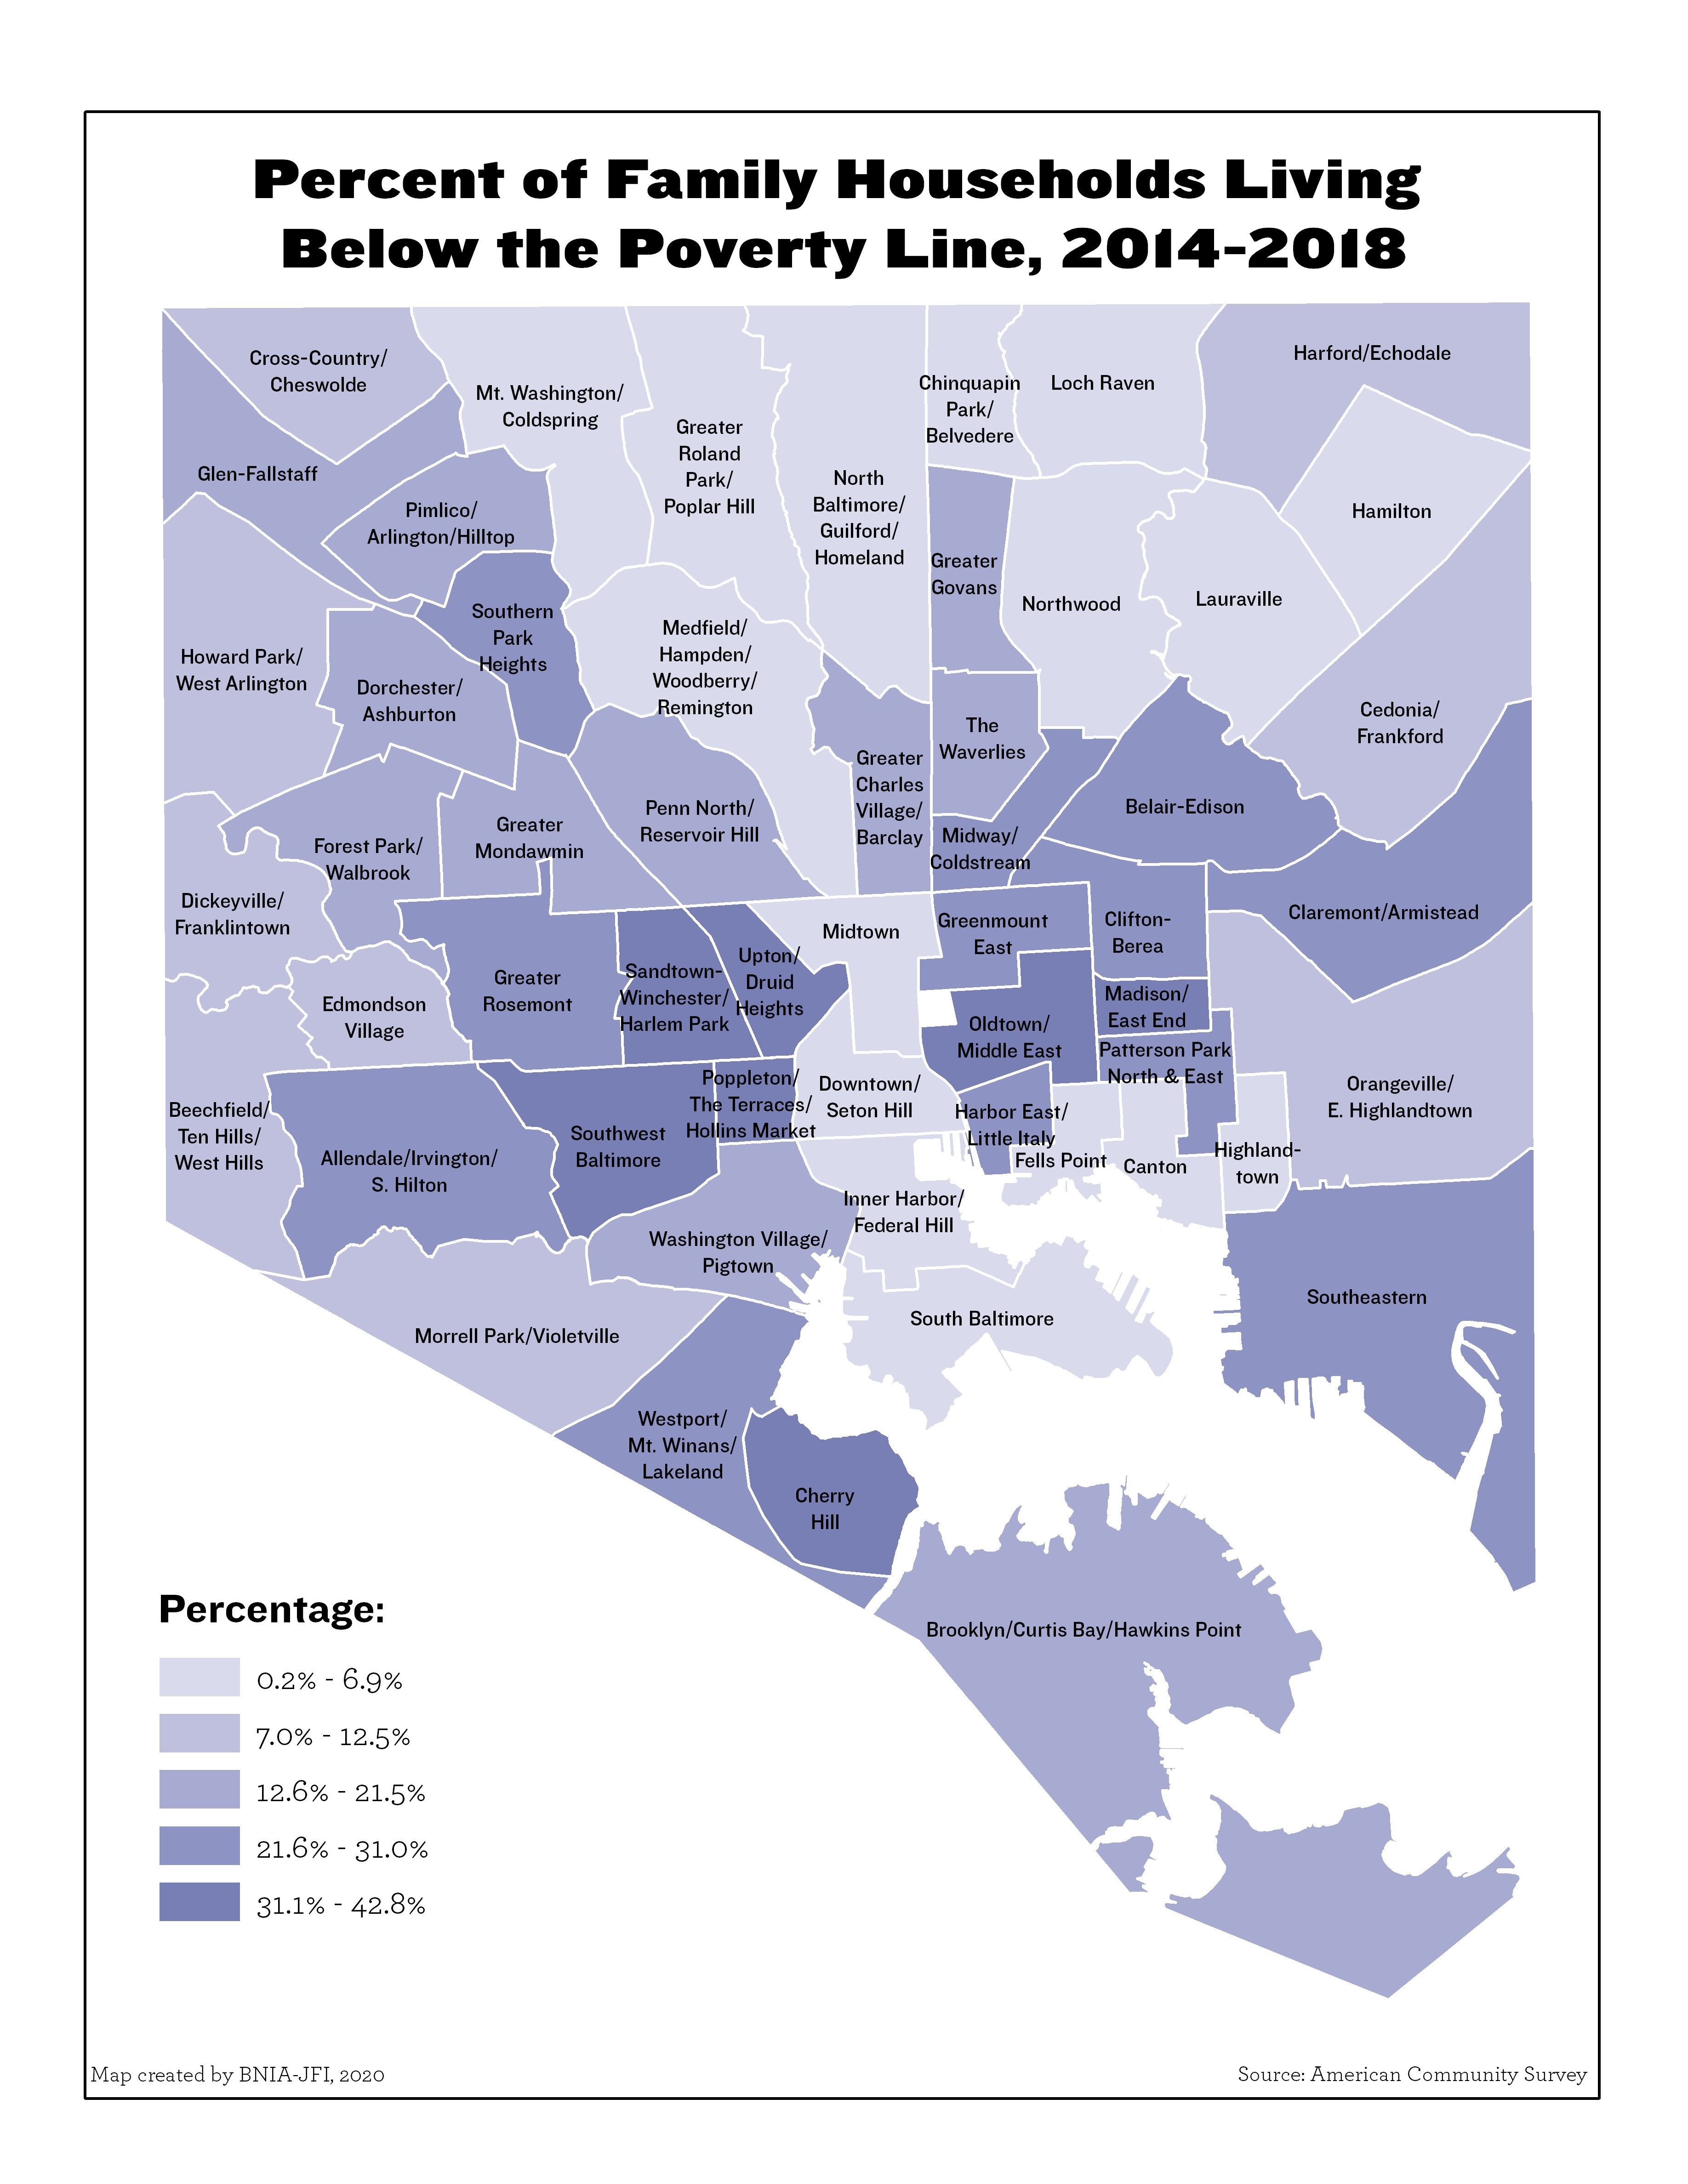
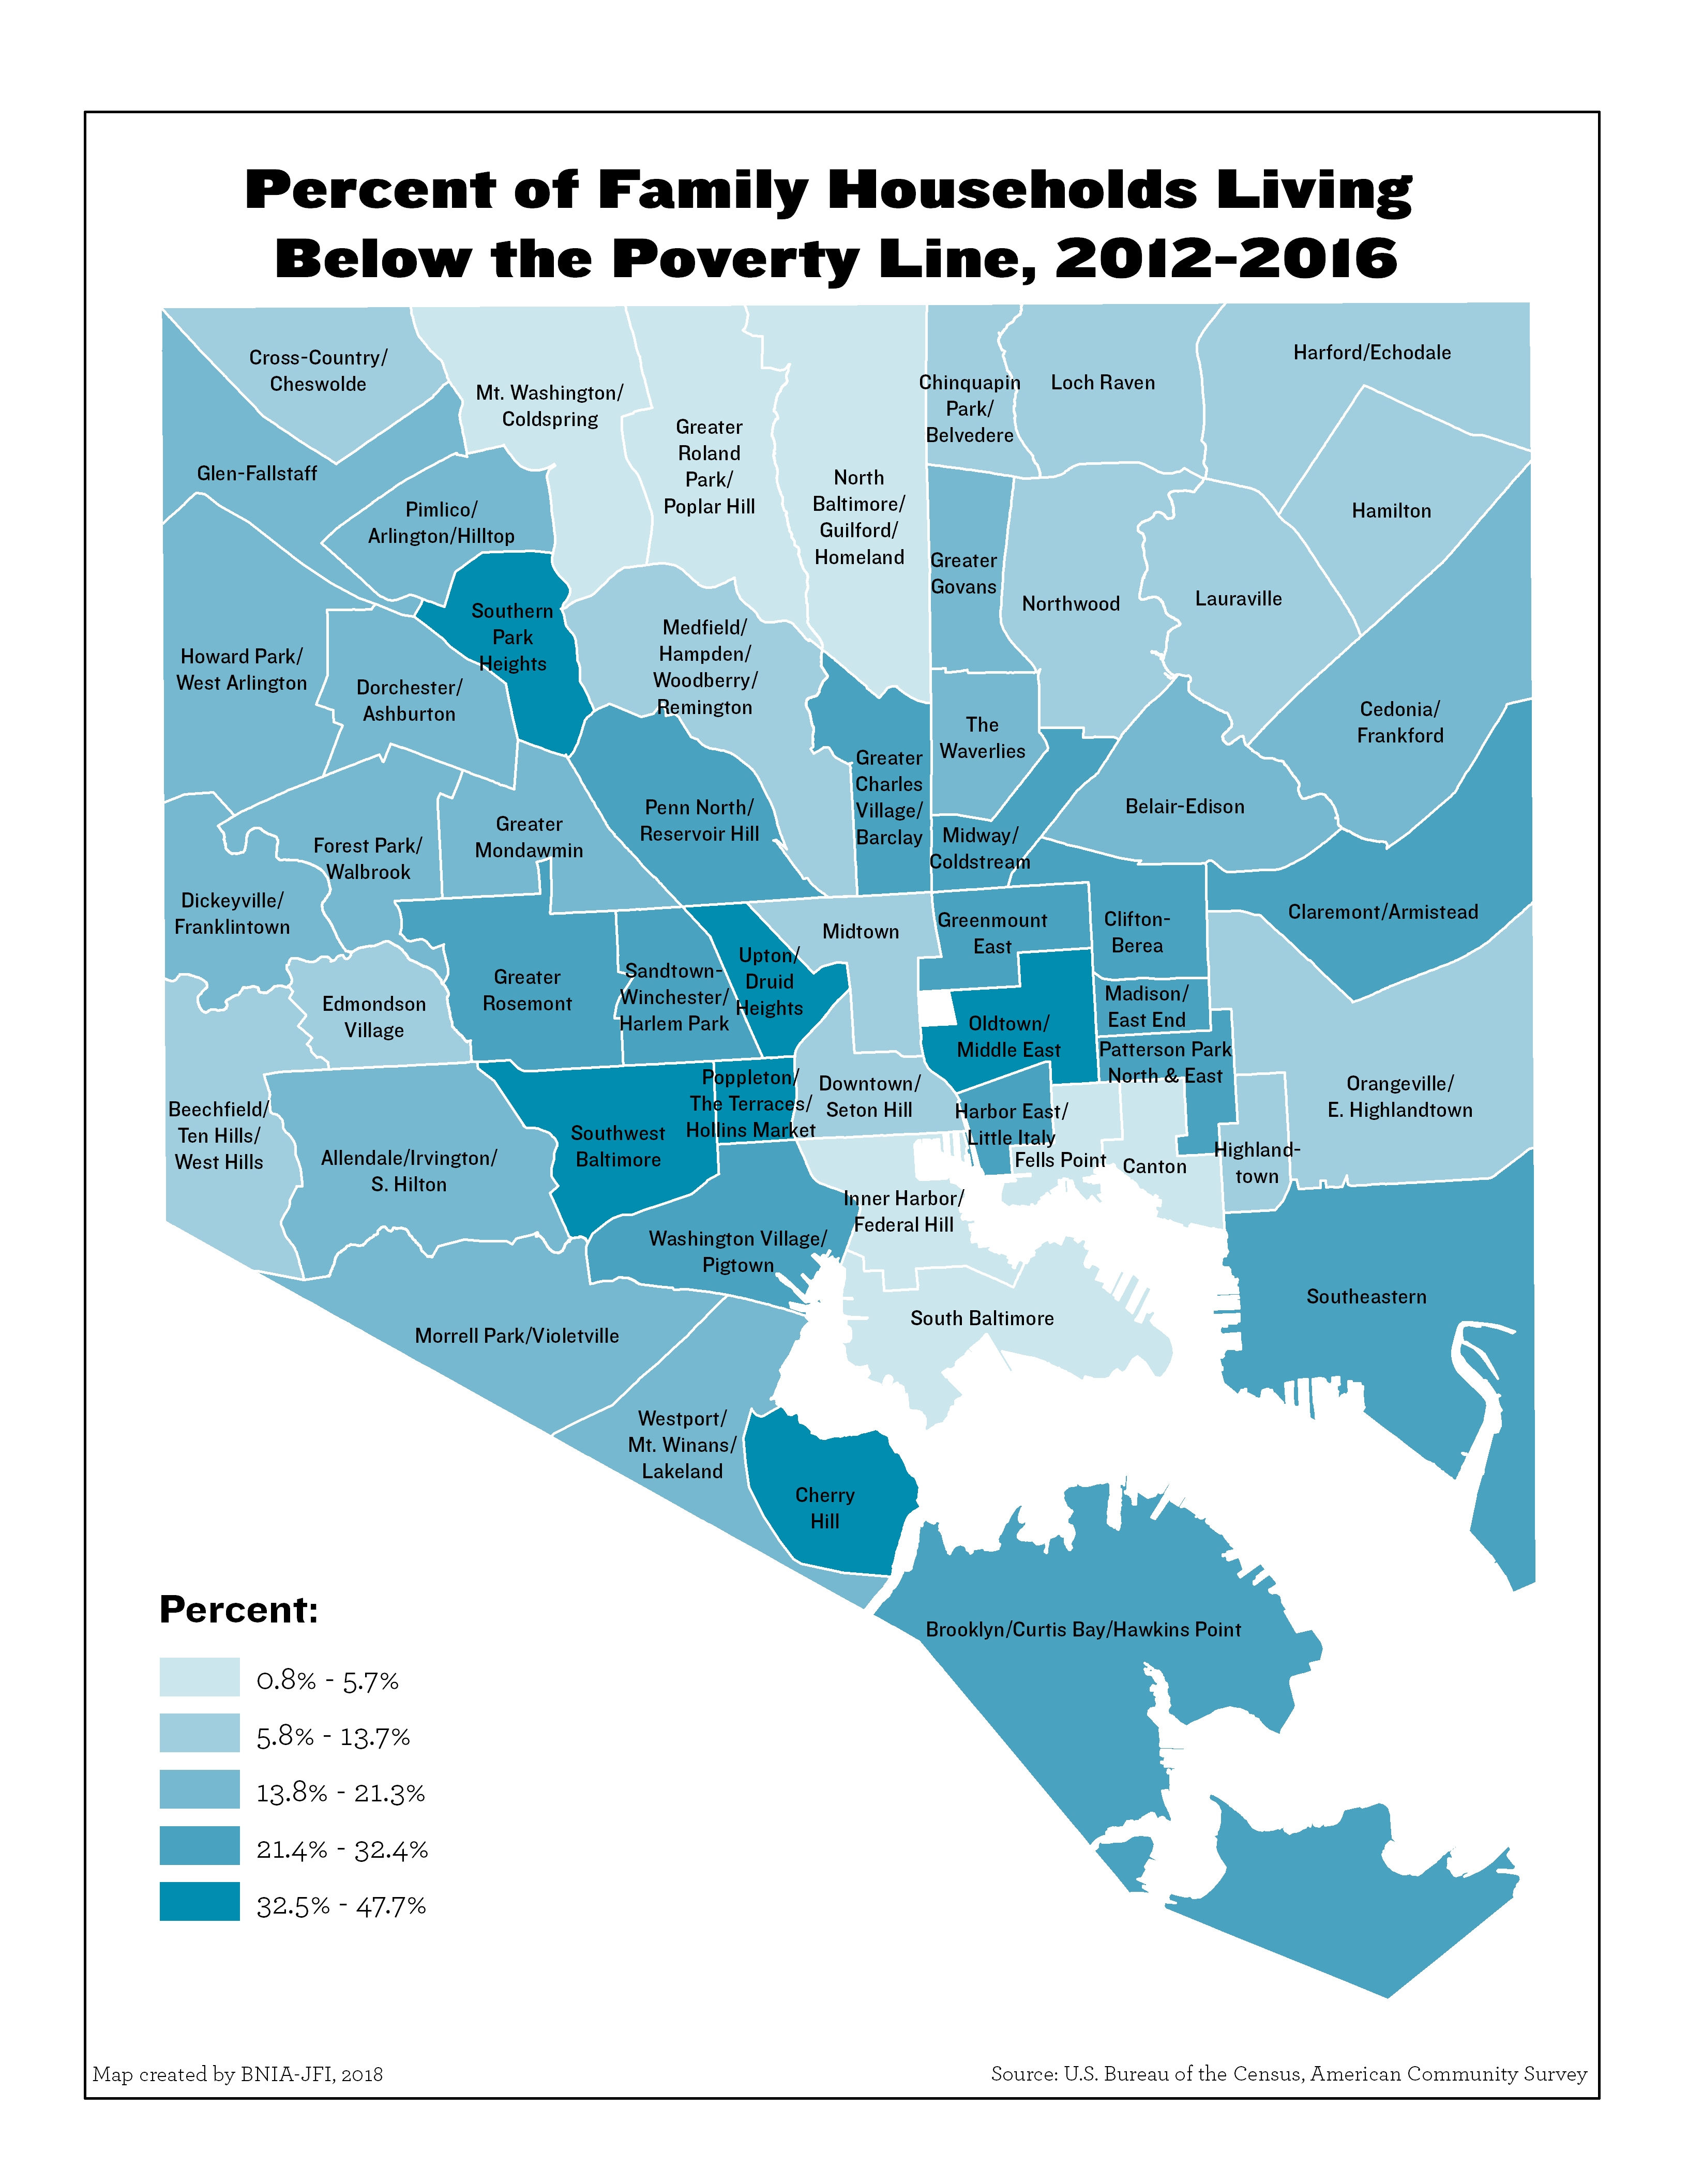
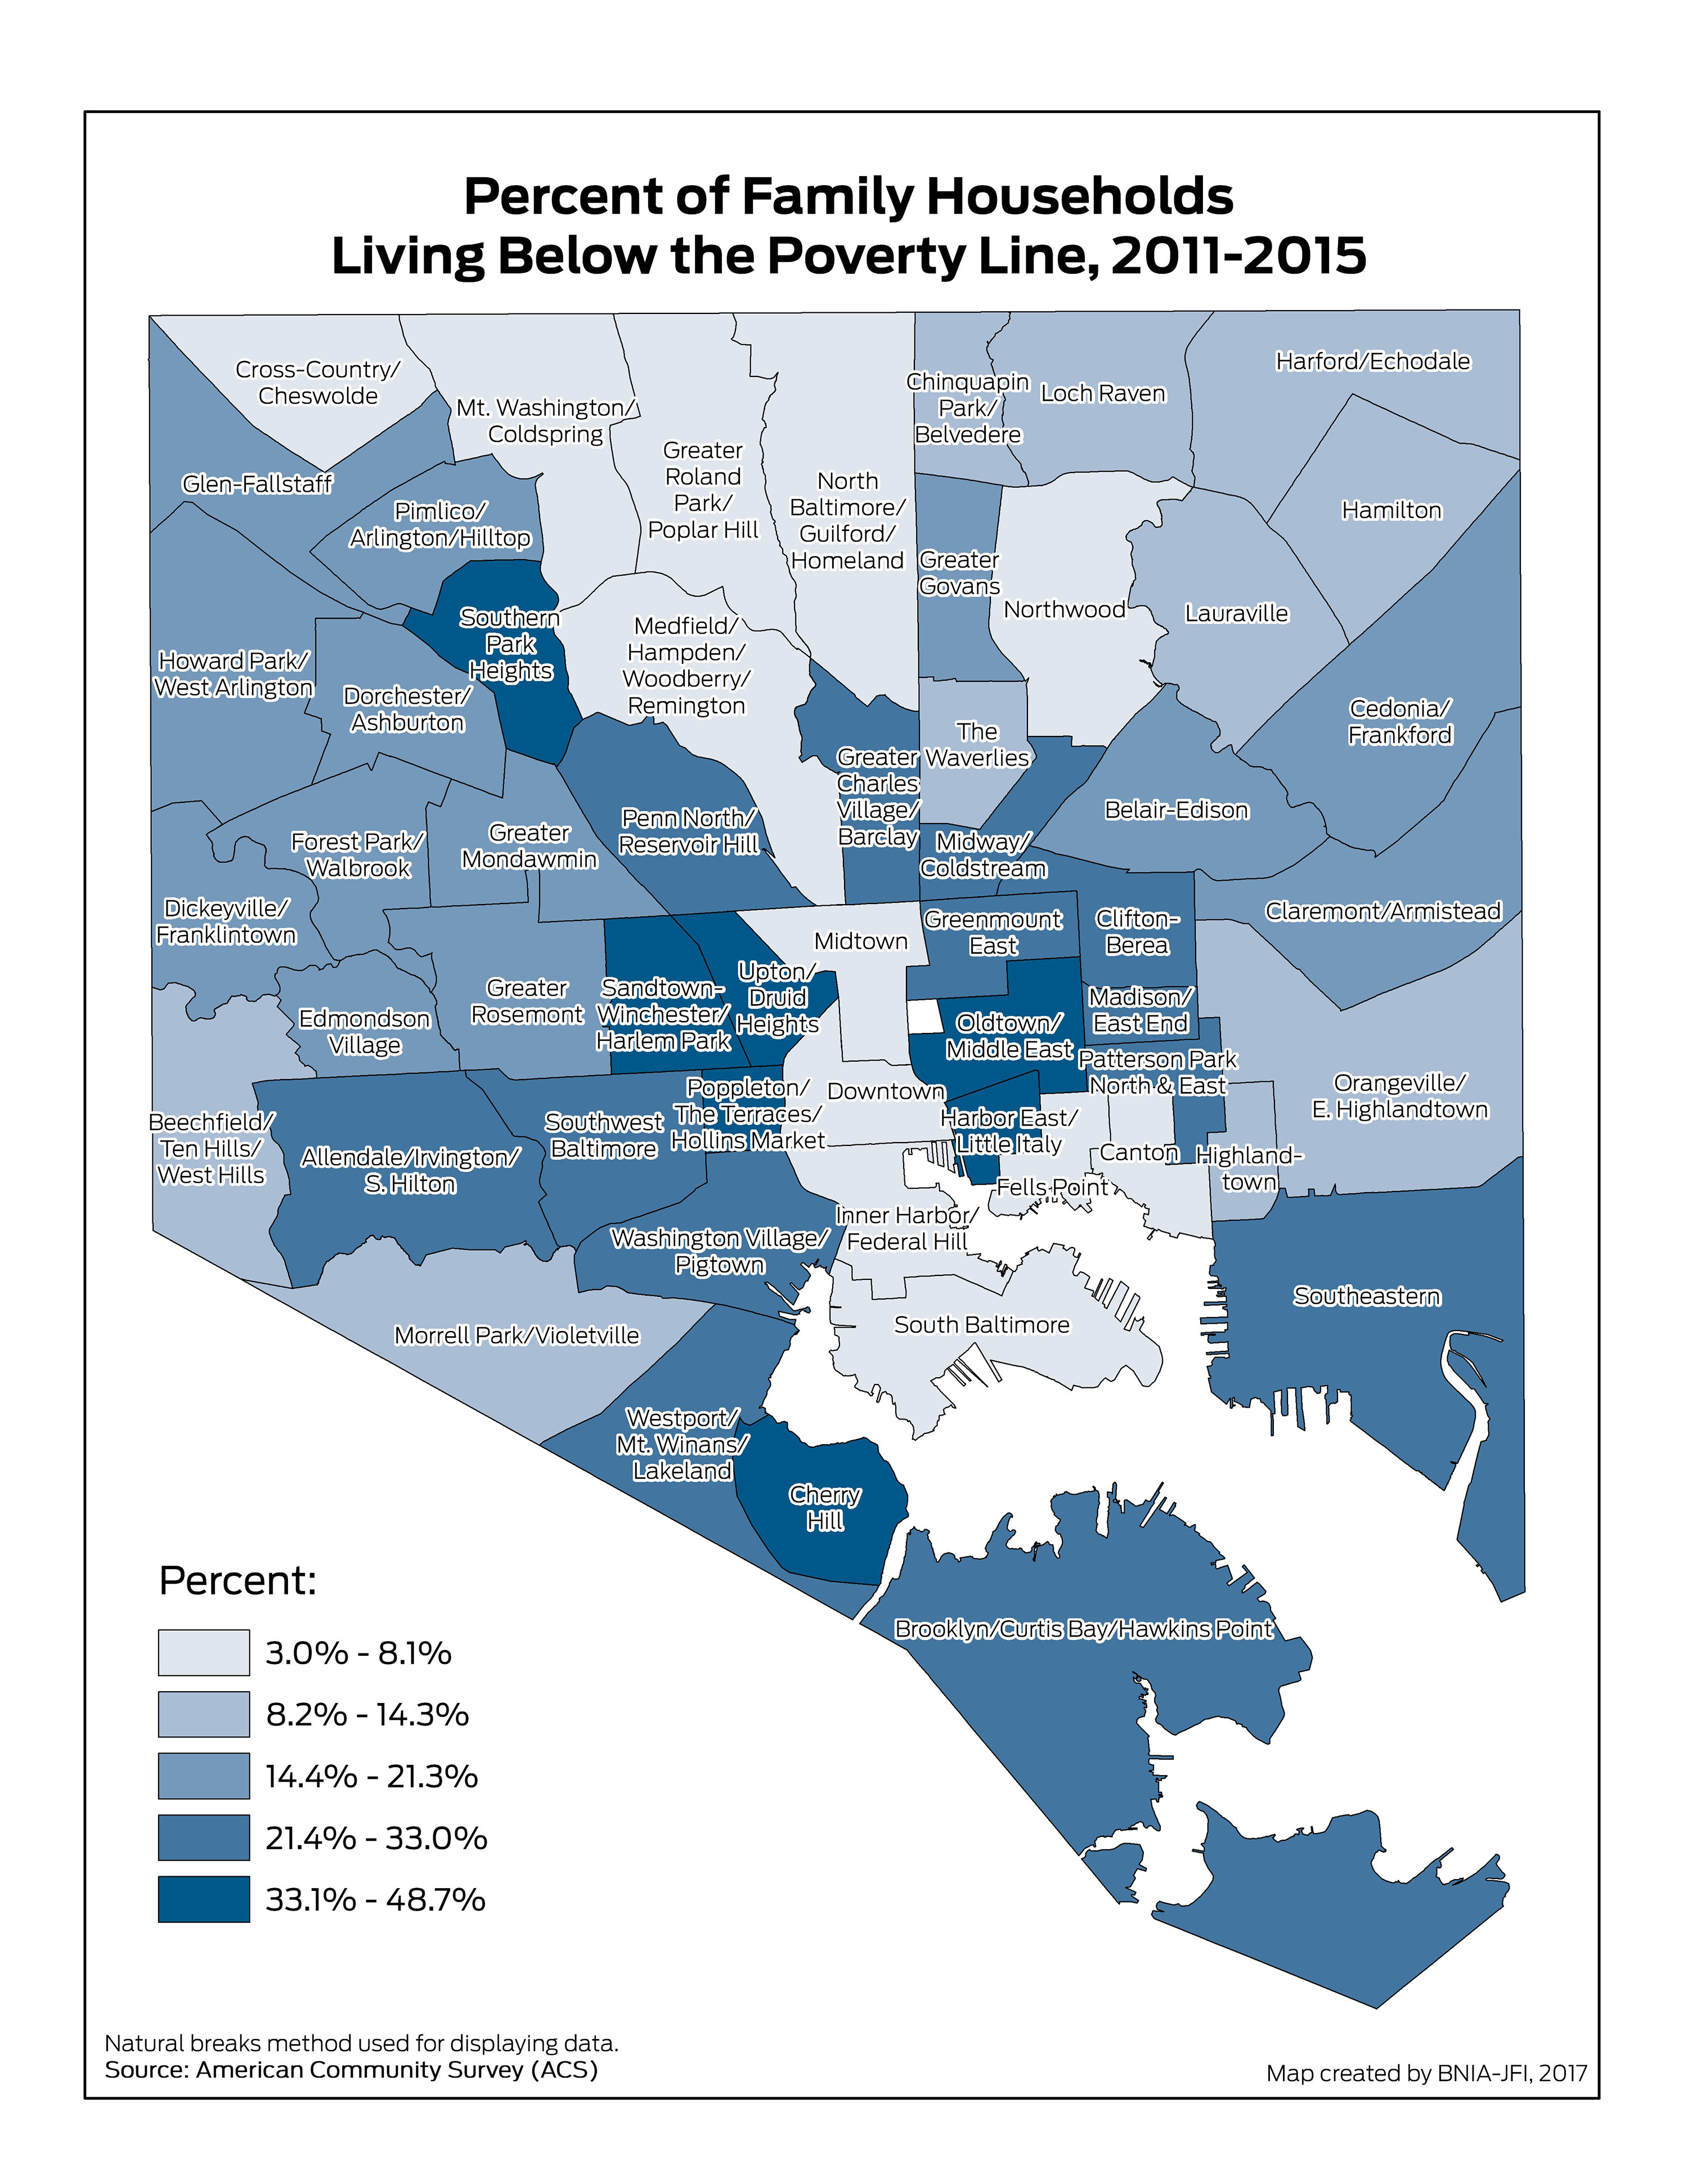
Percent of Family Households Living Below the Poverty Line
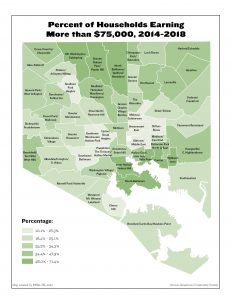
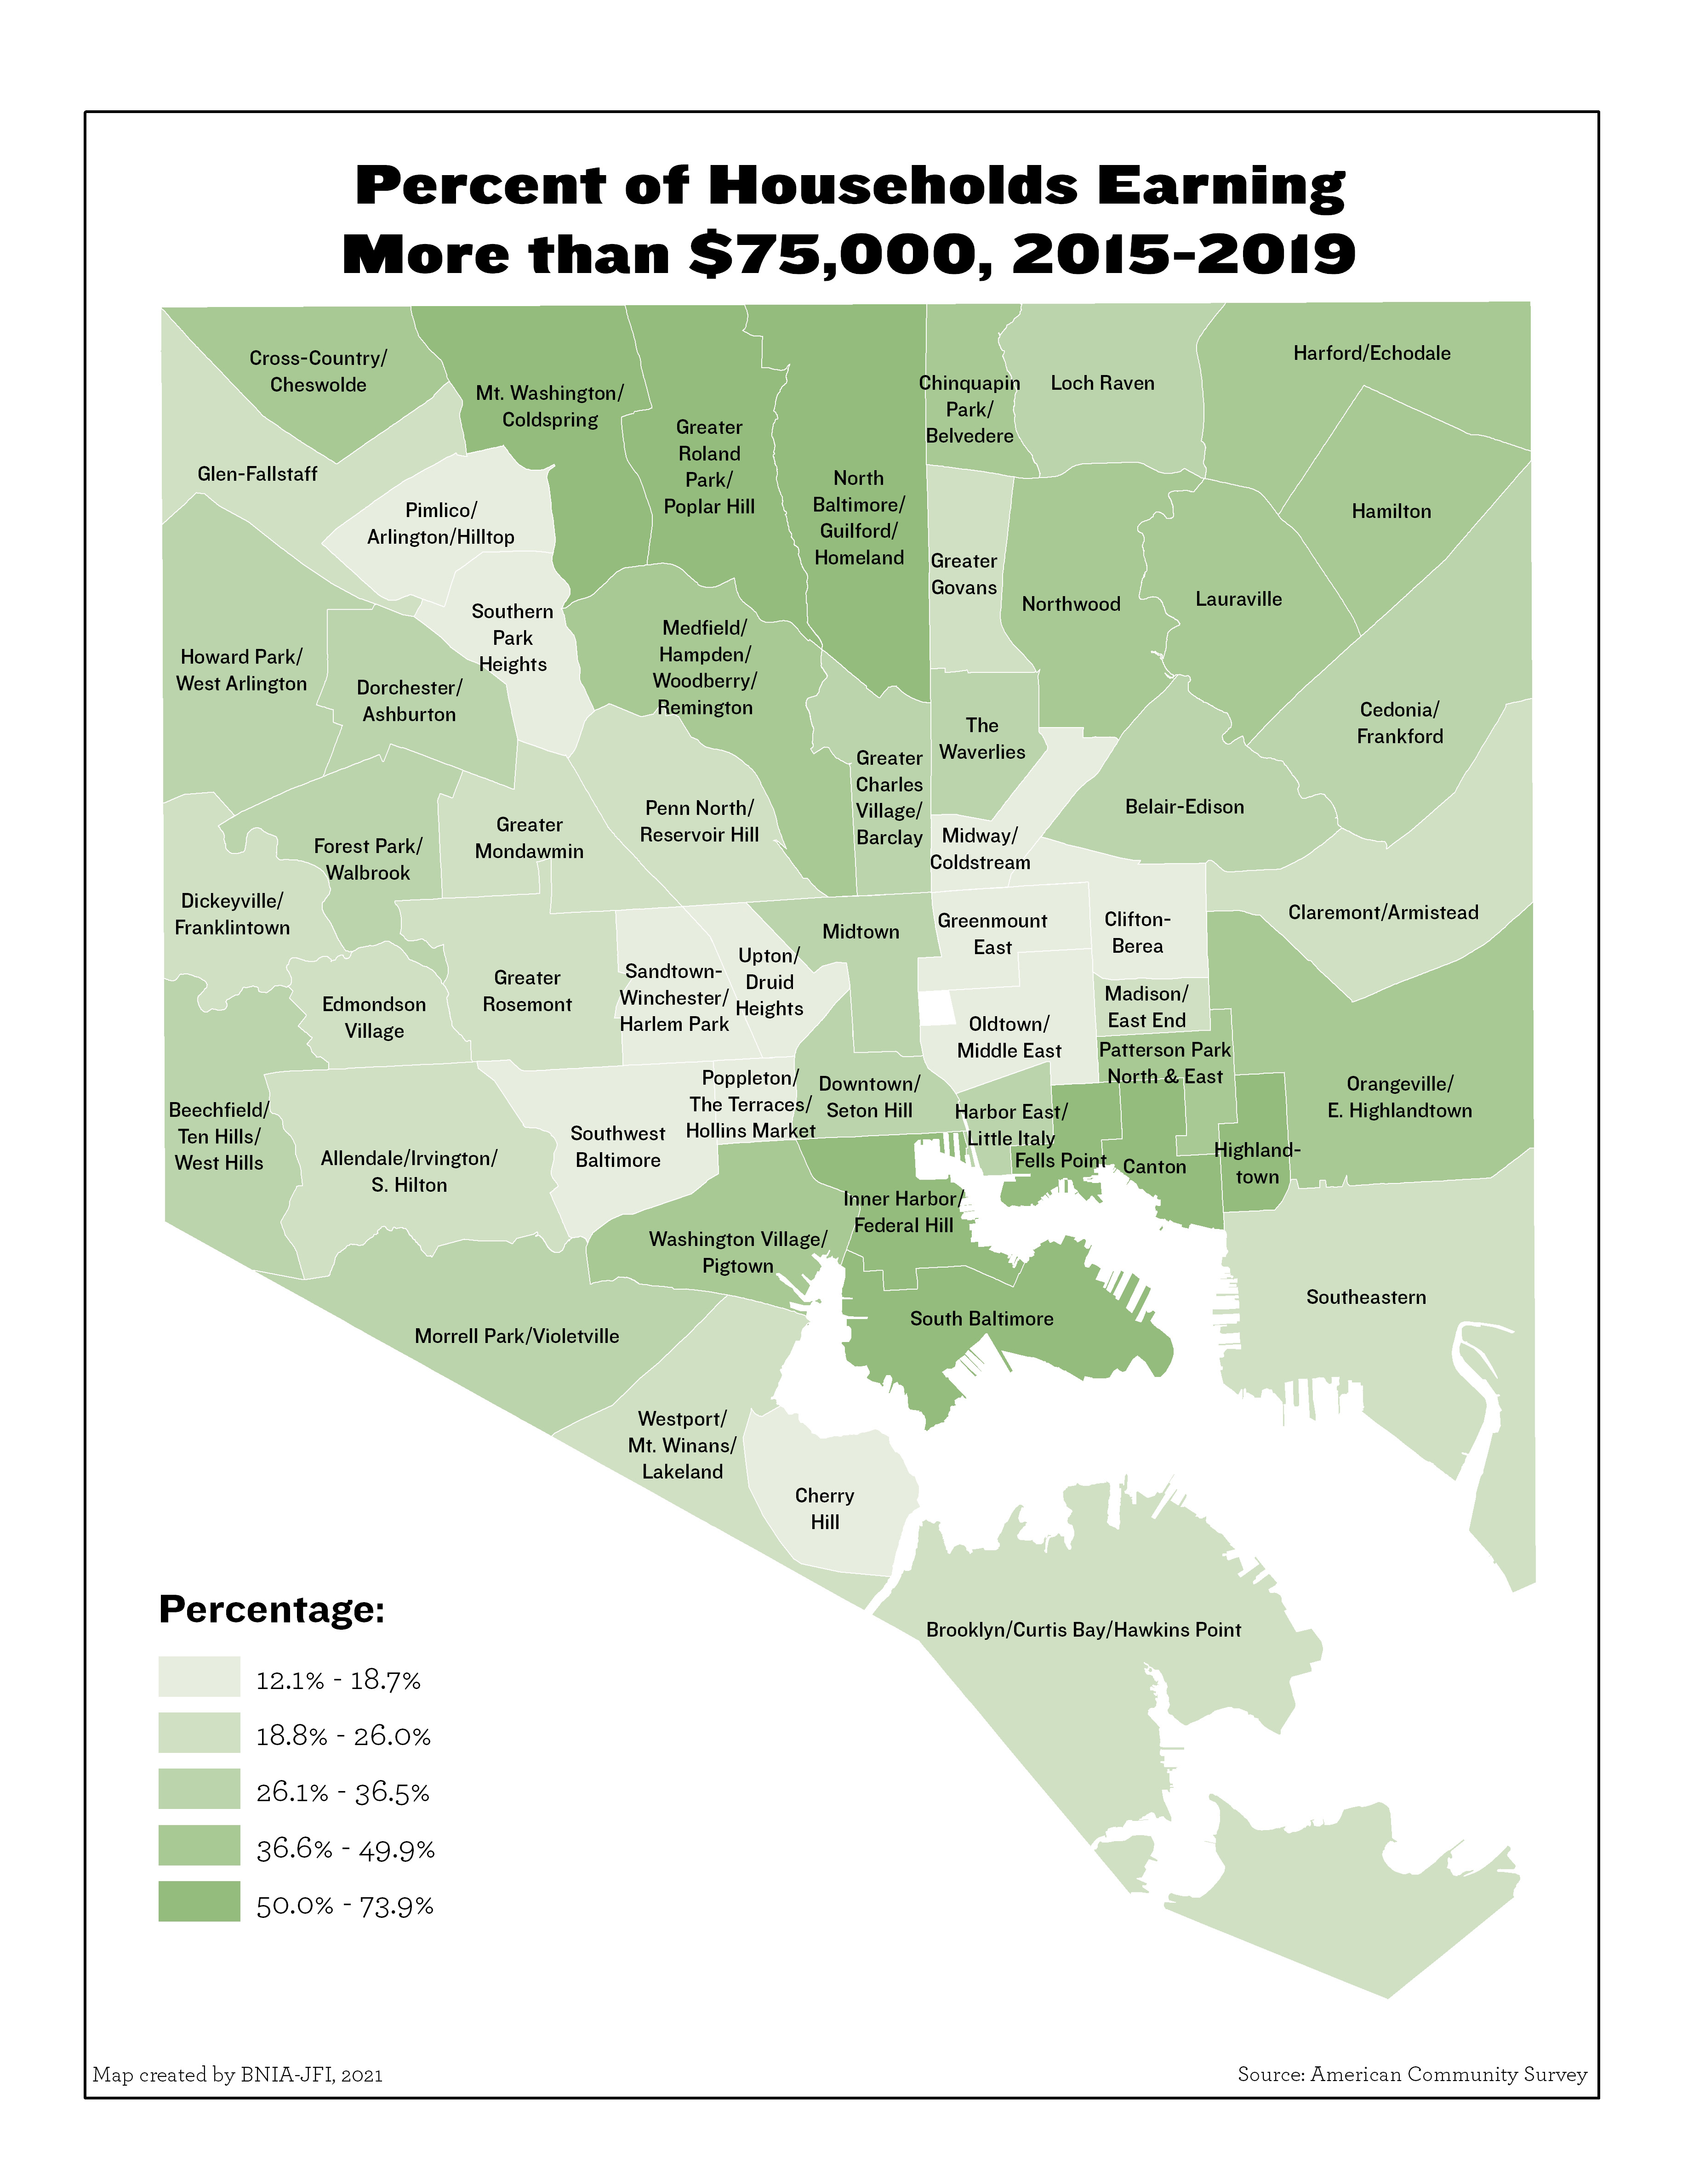
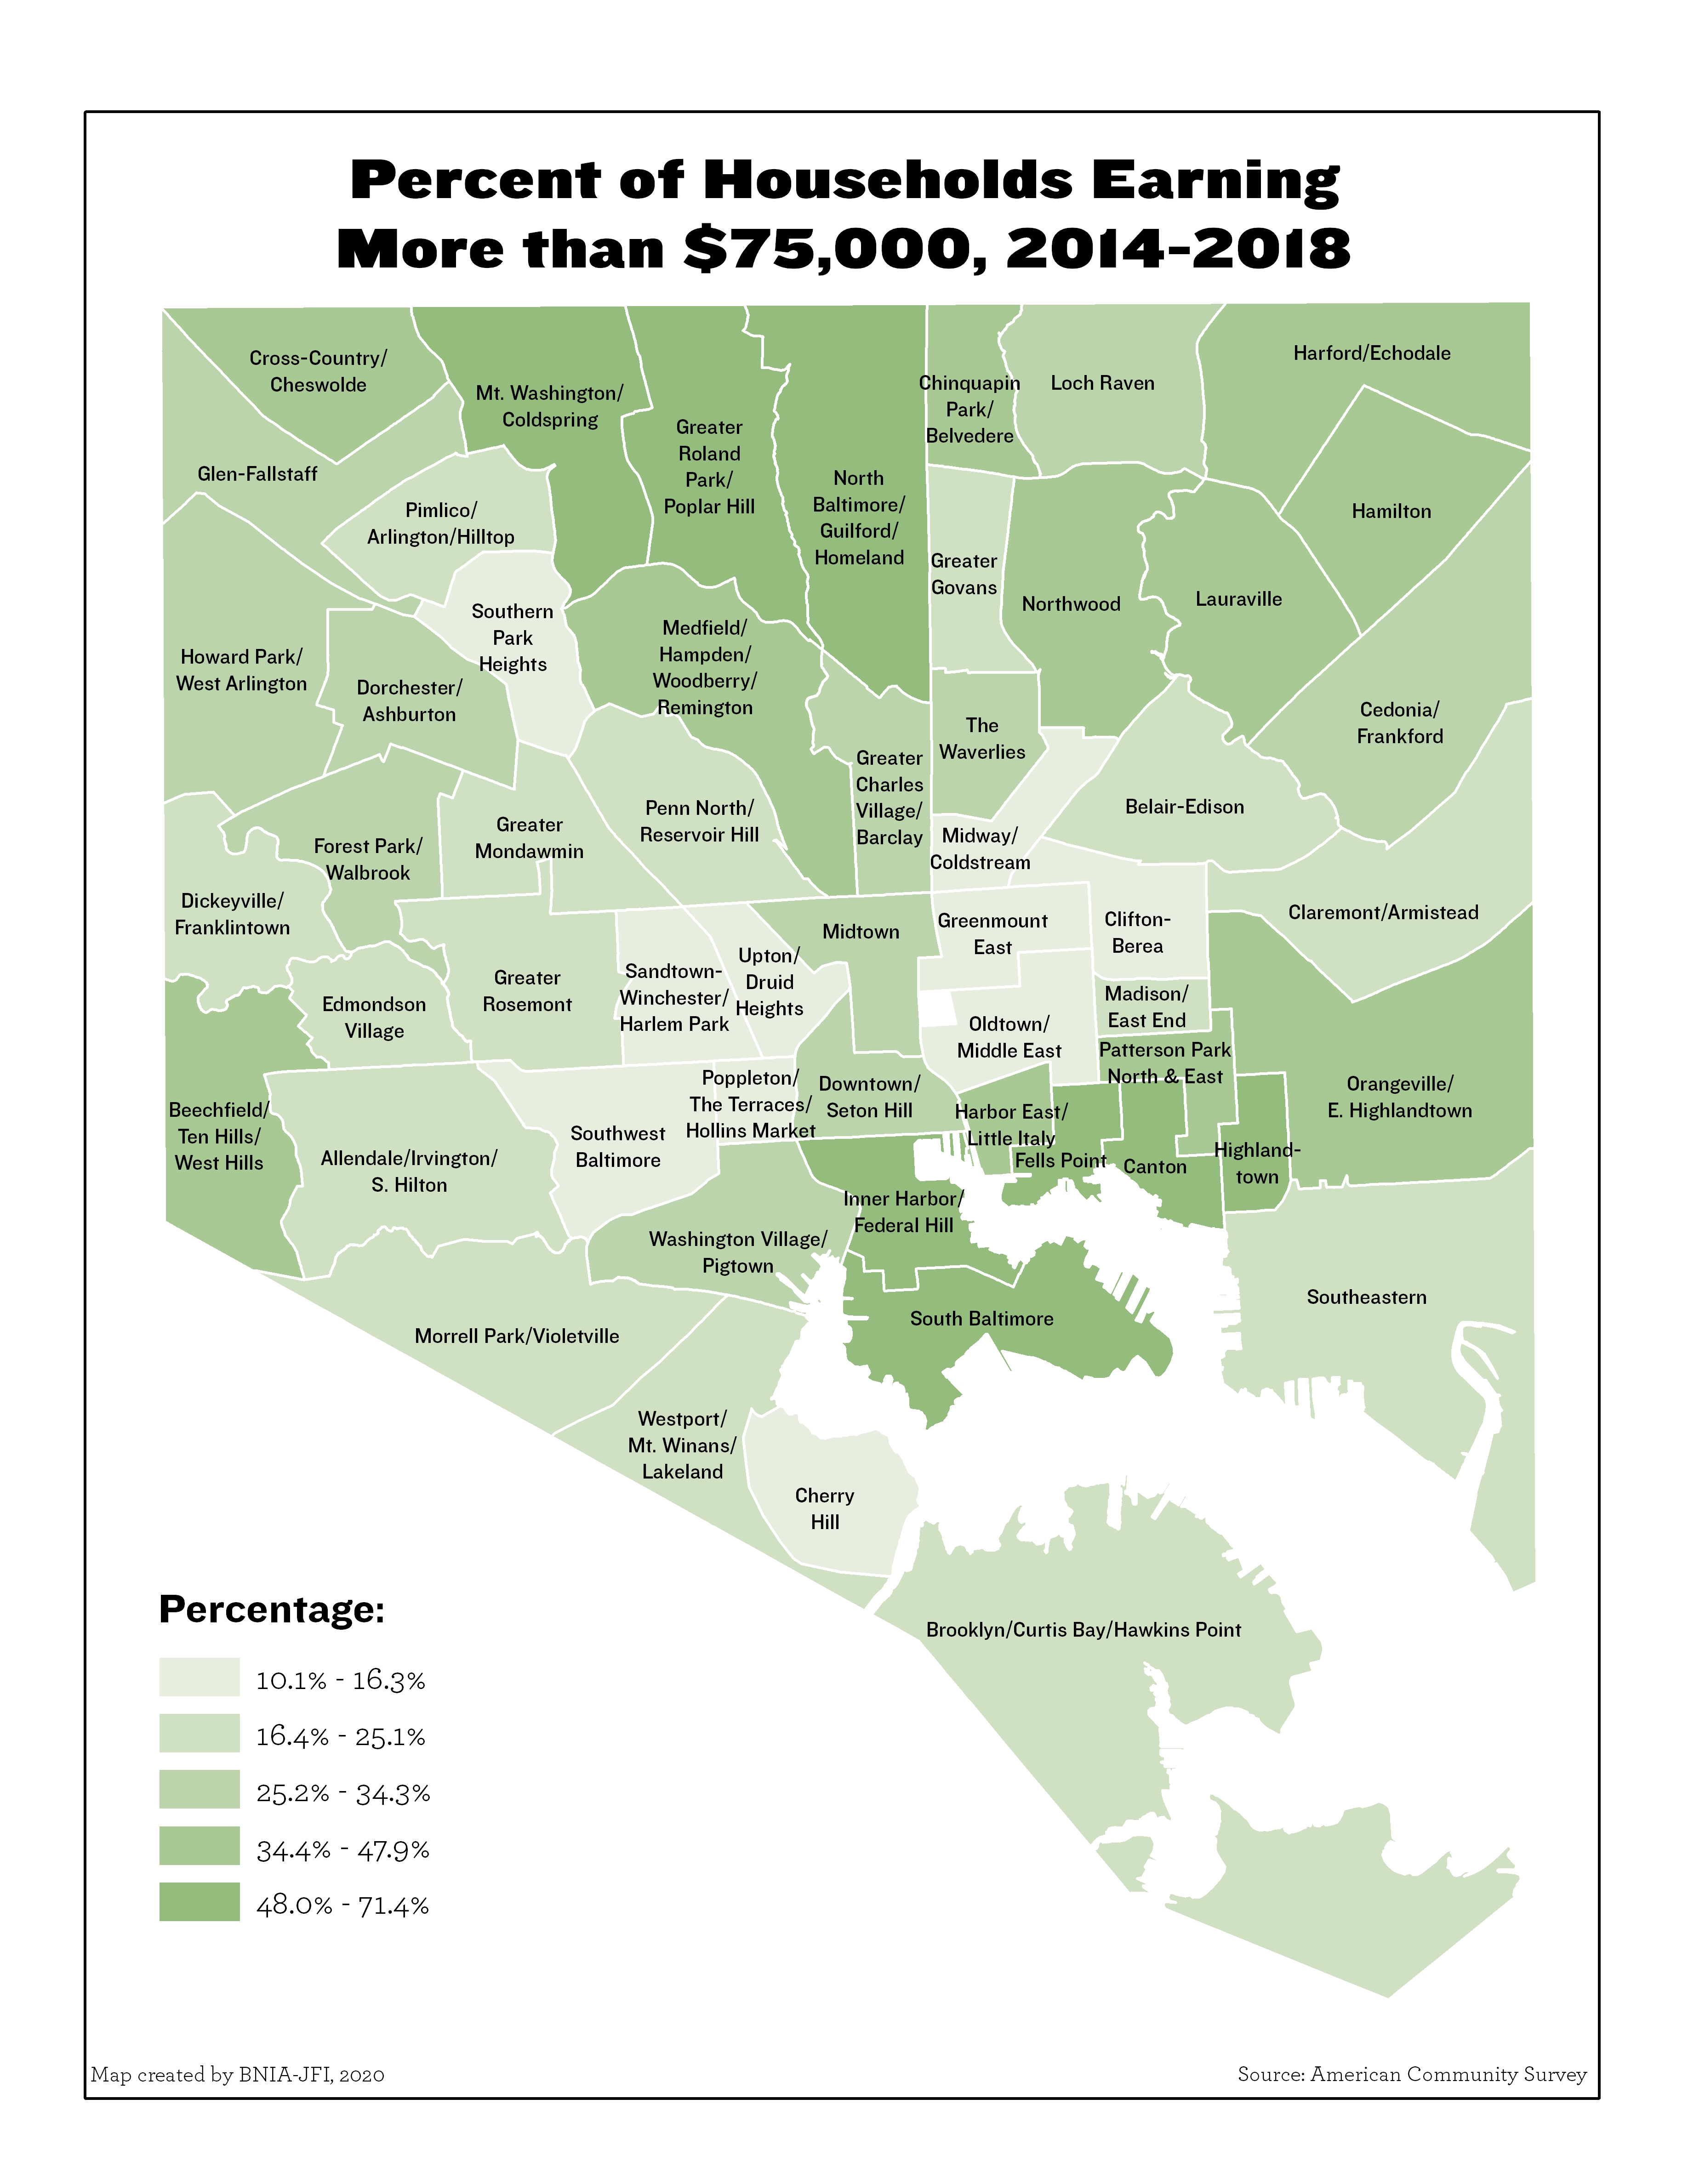
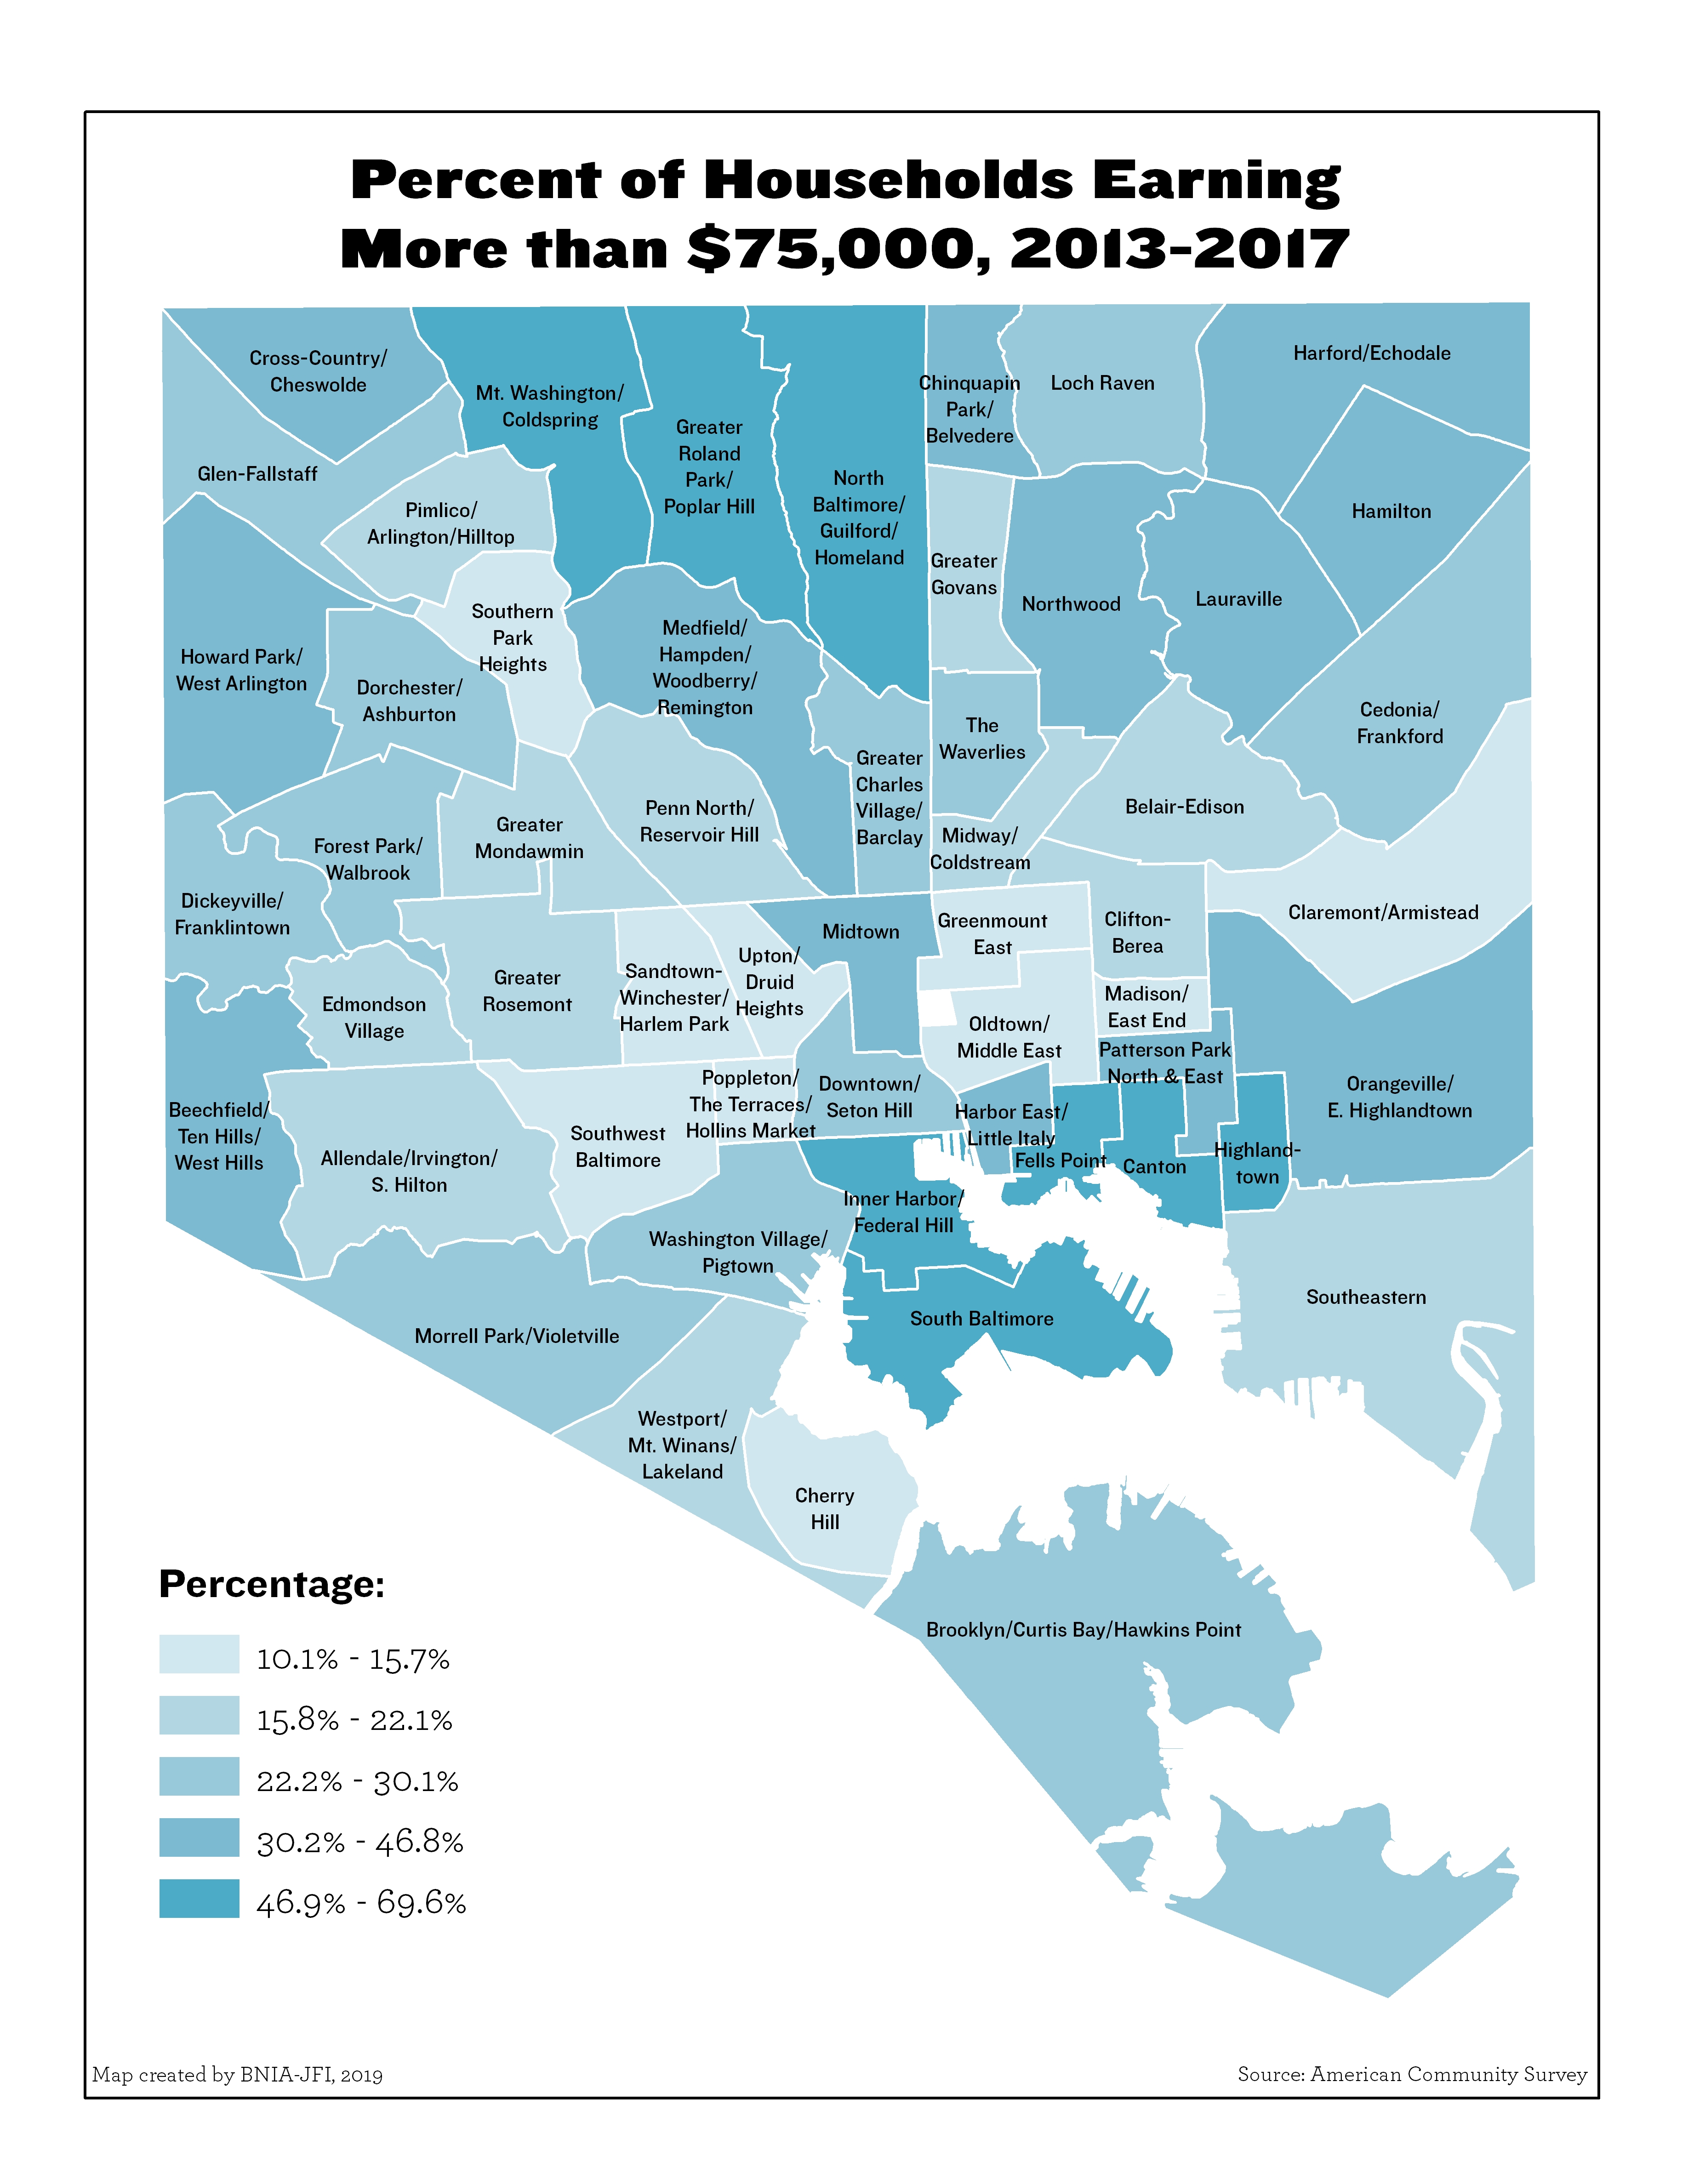
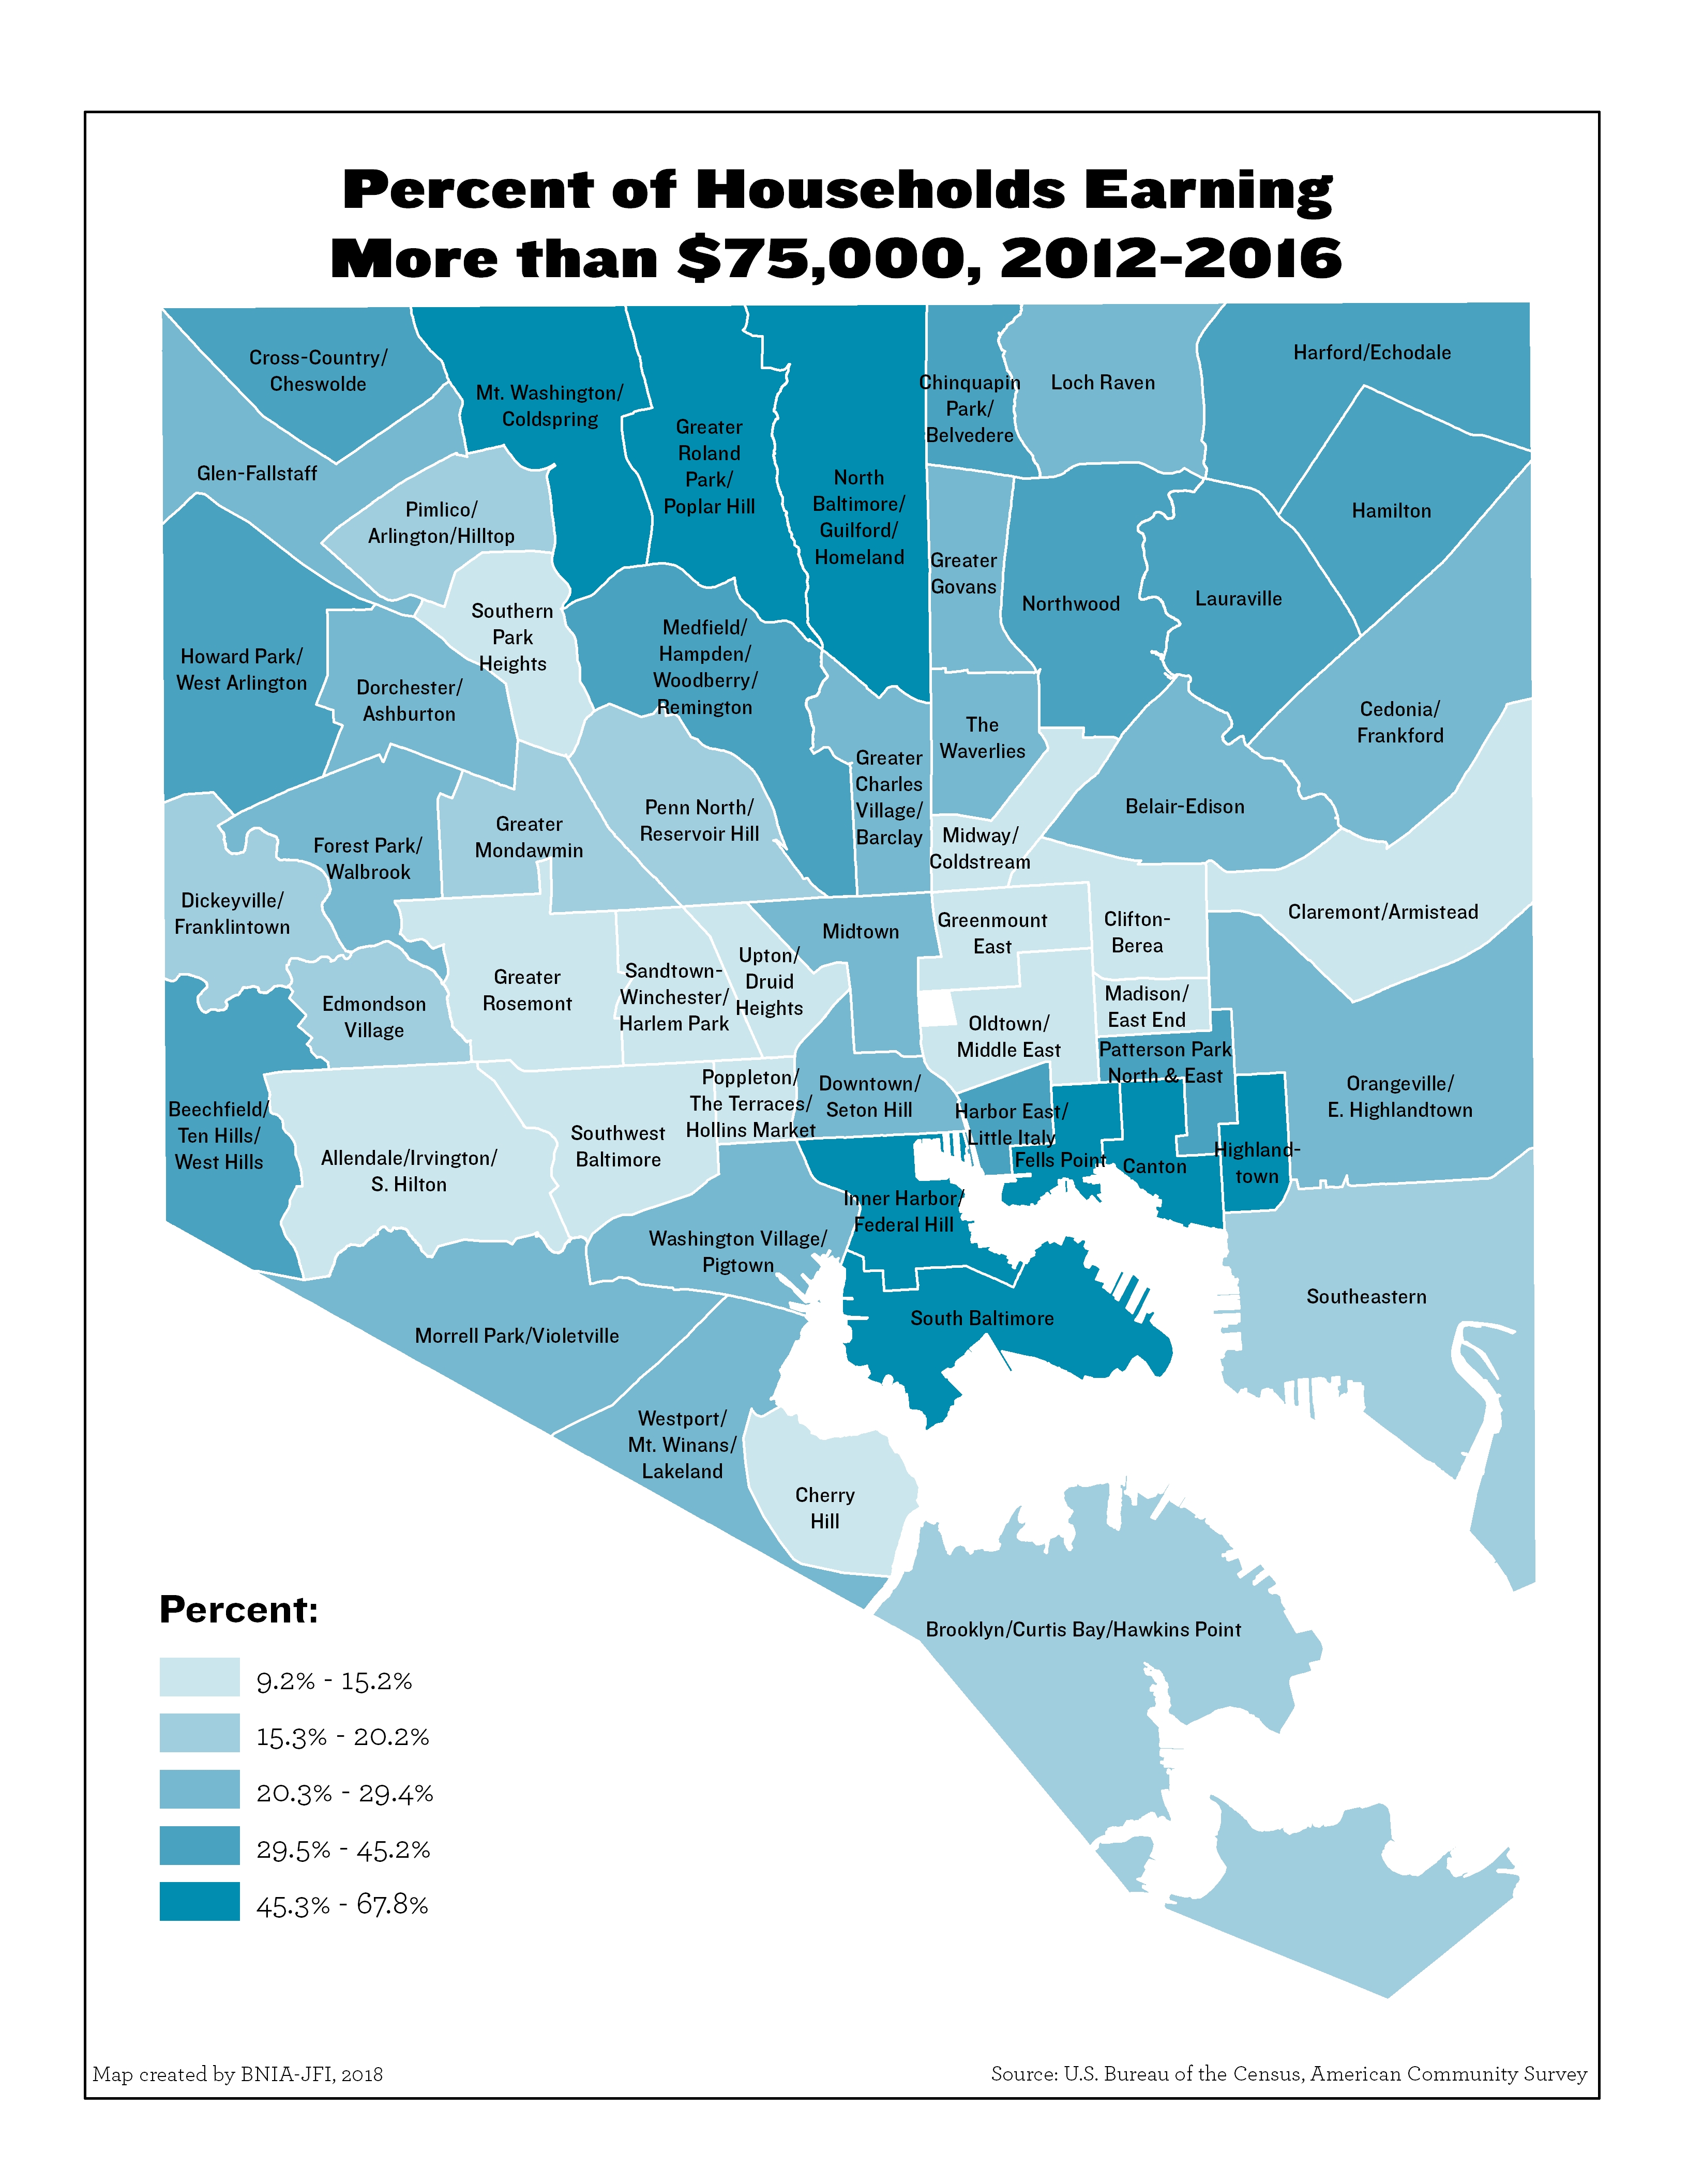
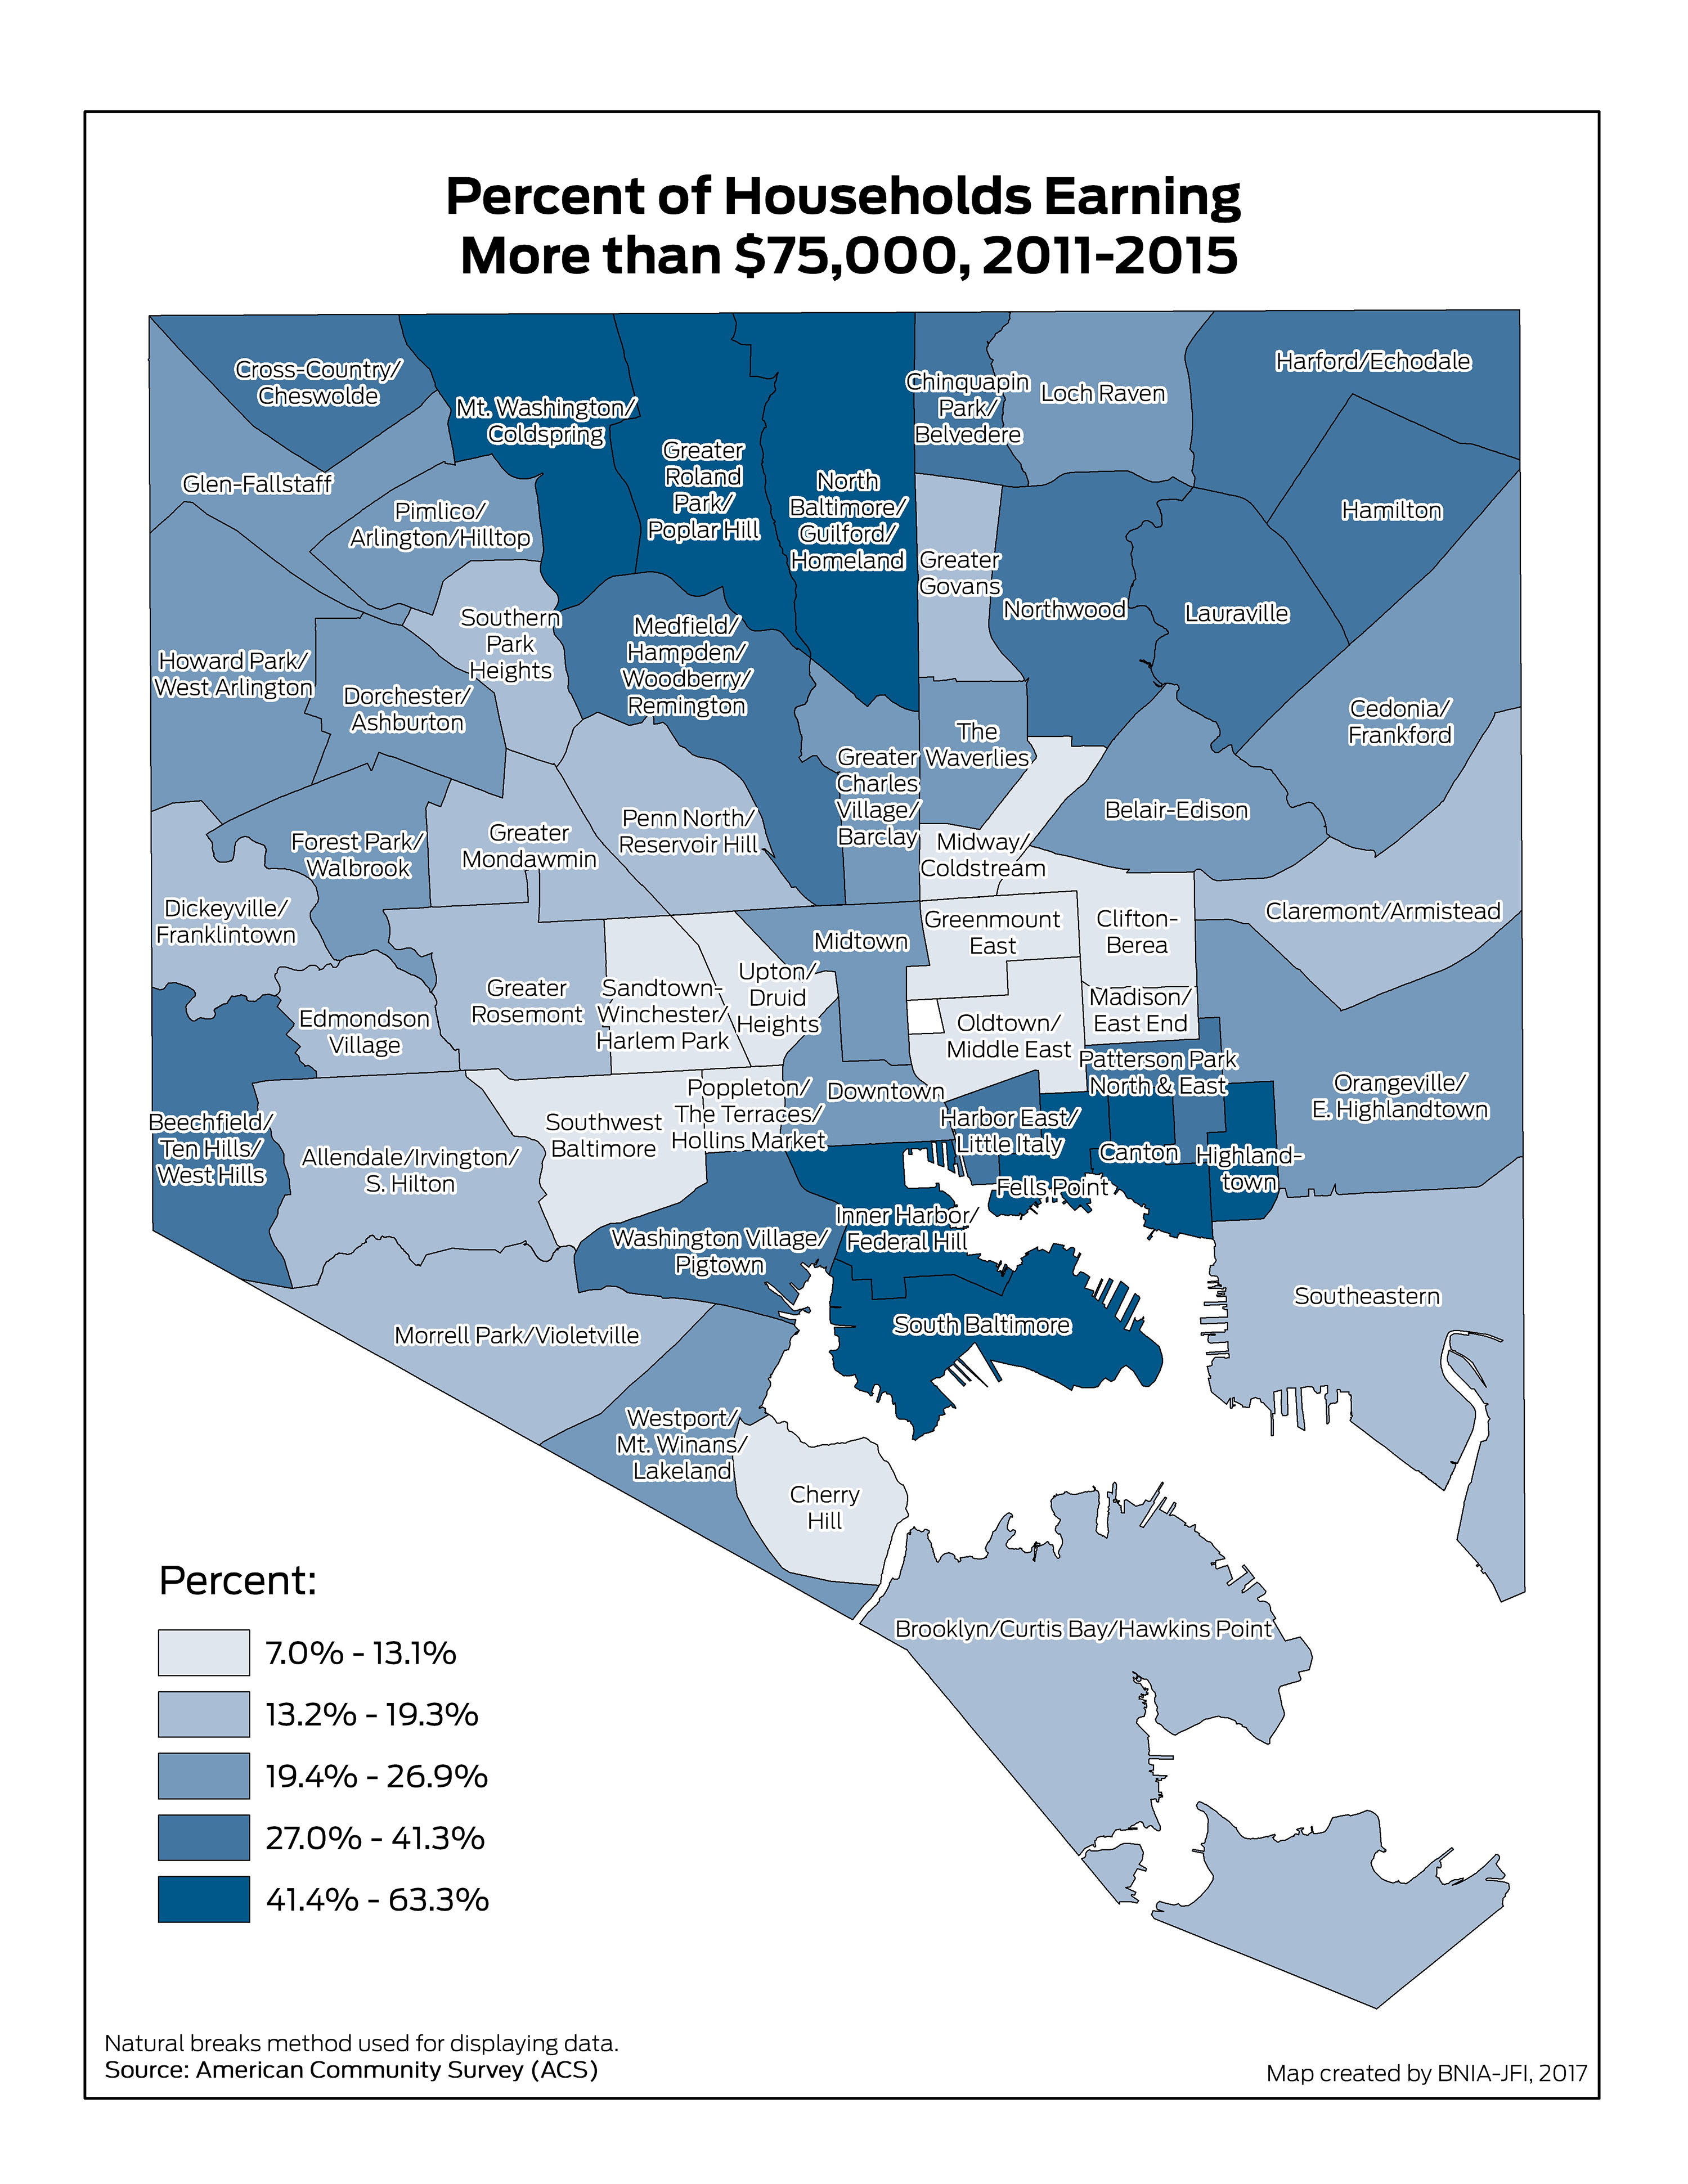
Percent of Households Earning More than $75,000
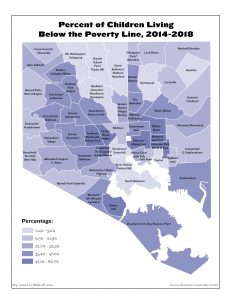
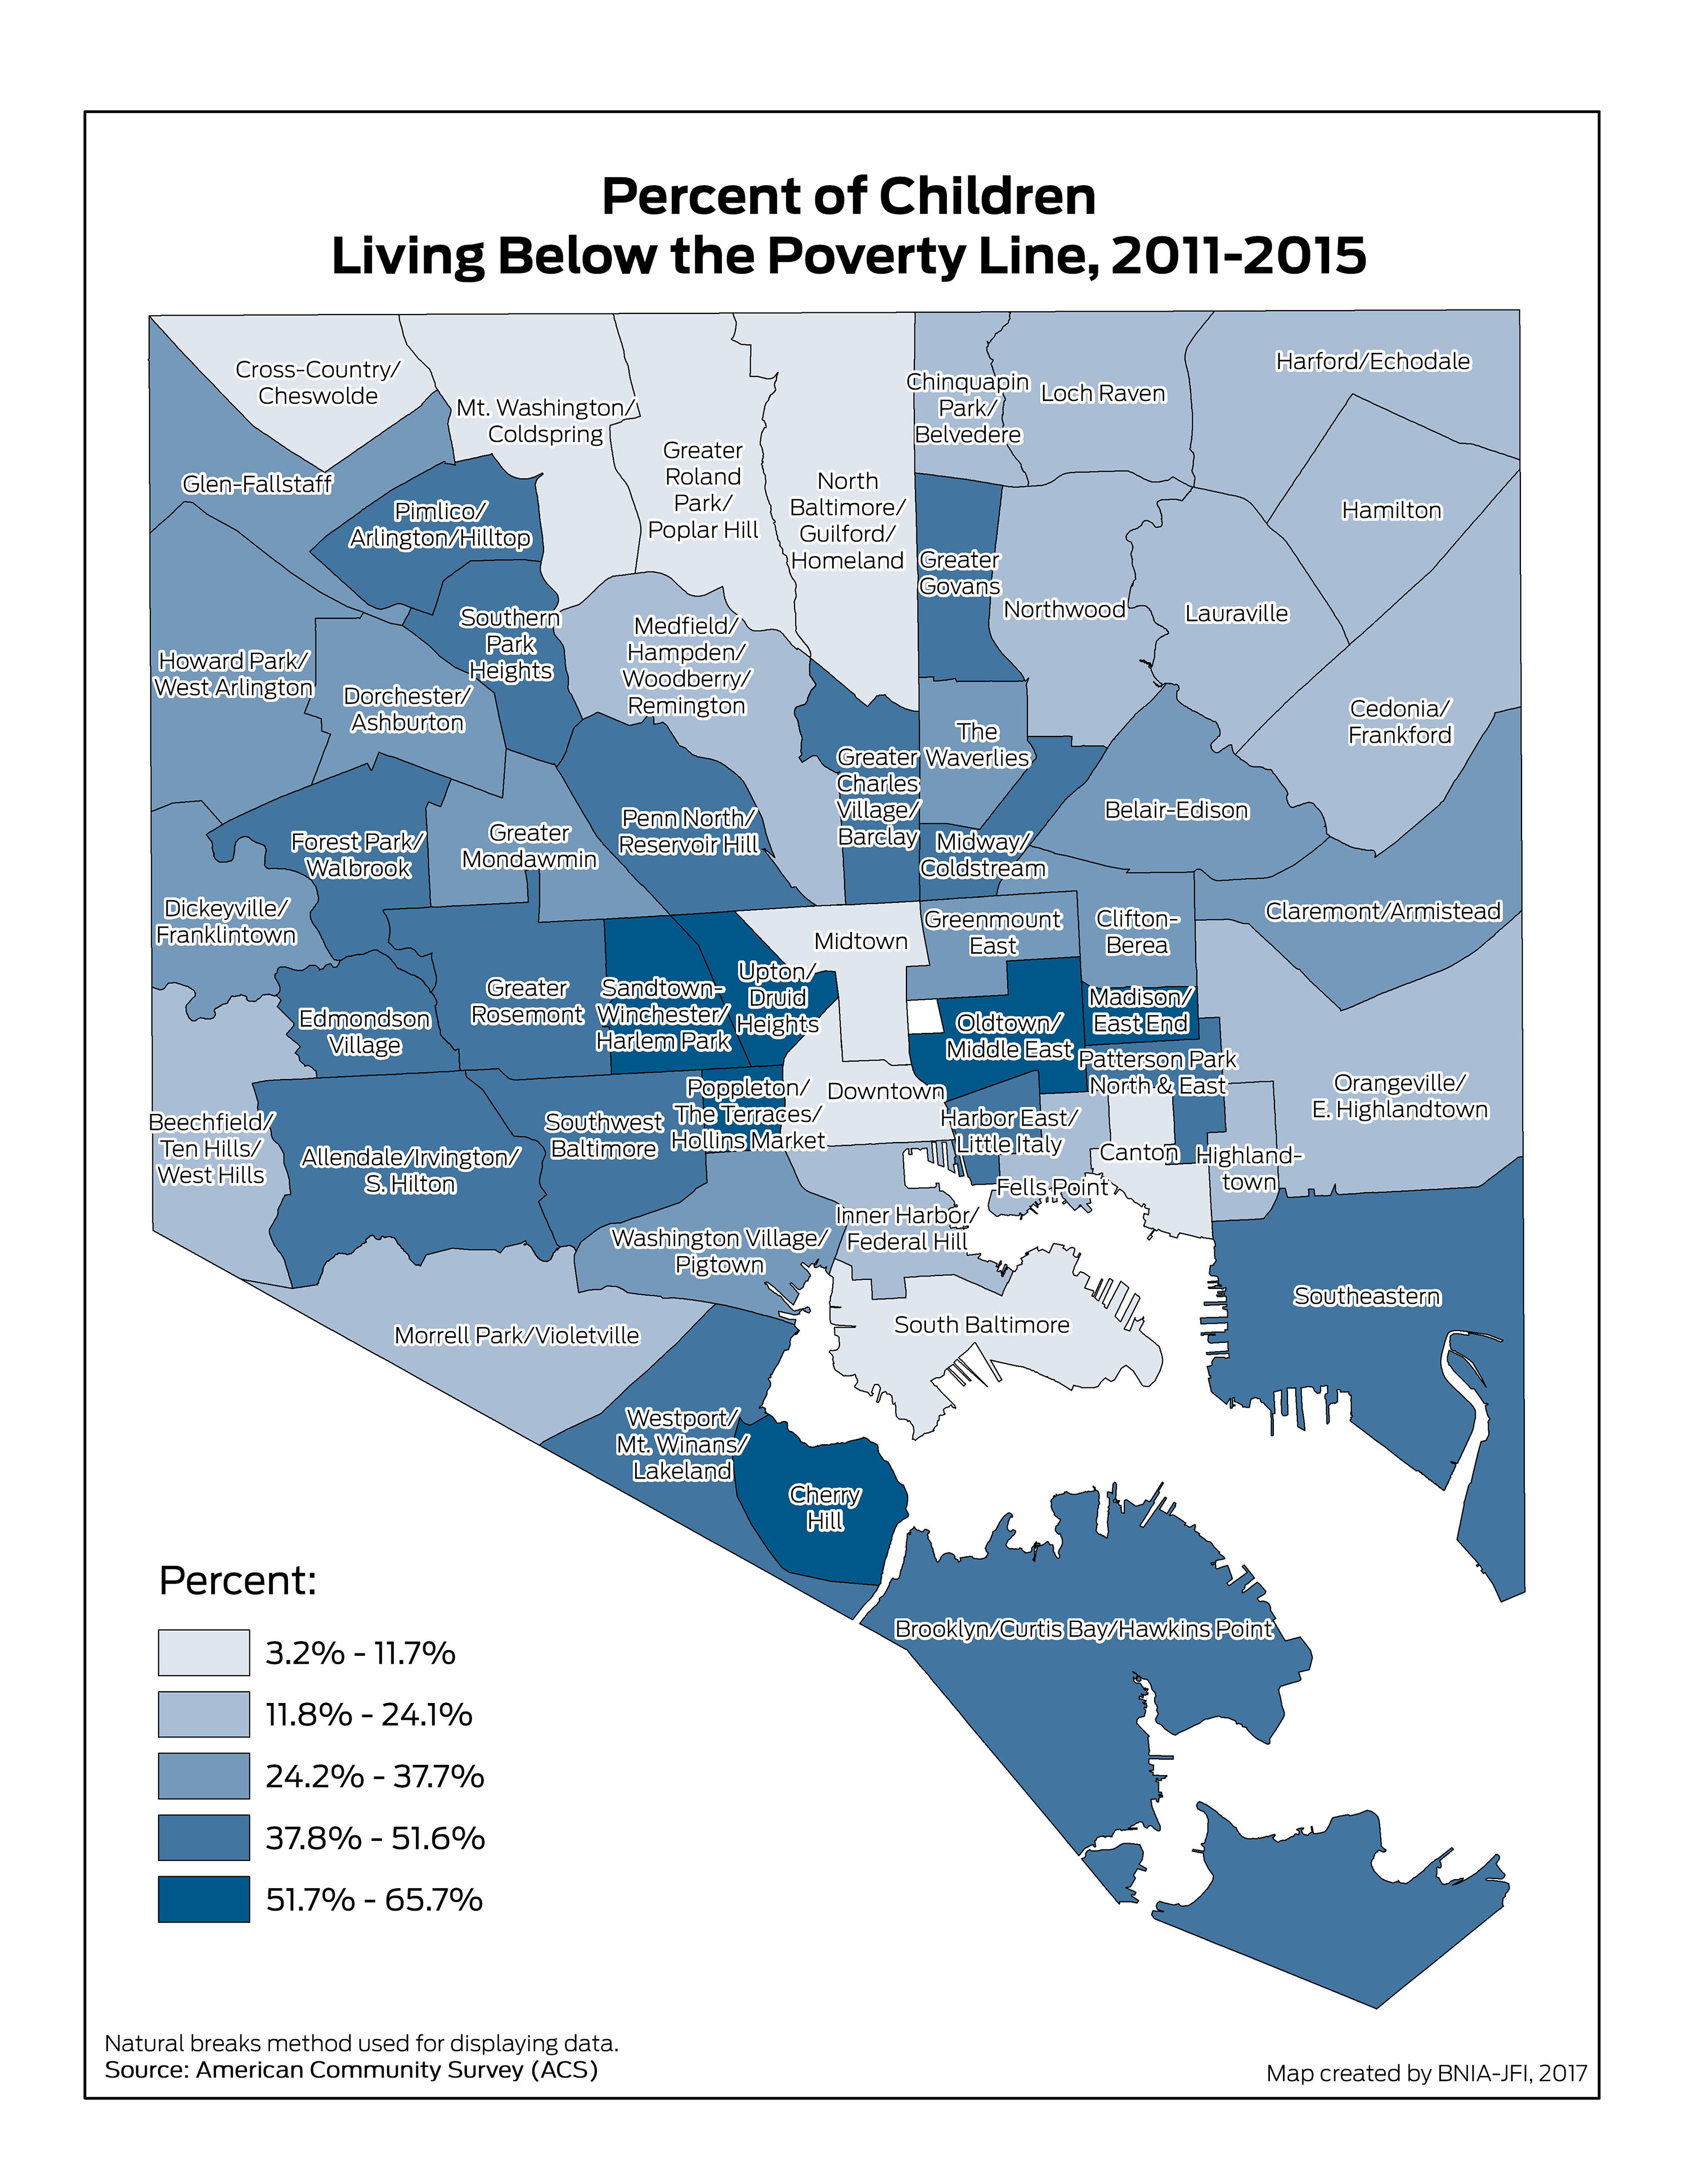
Percent of Children Living Below the Poverty Line
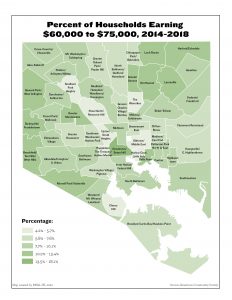
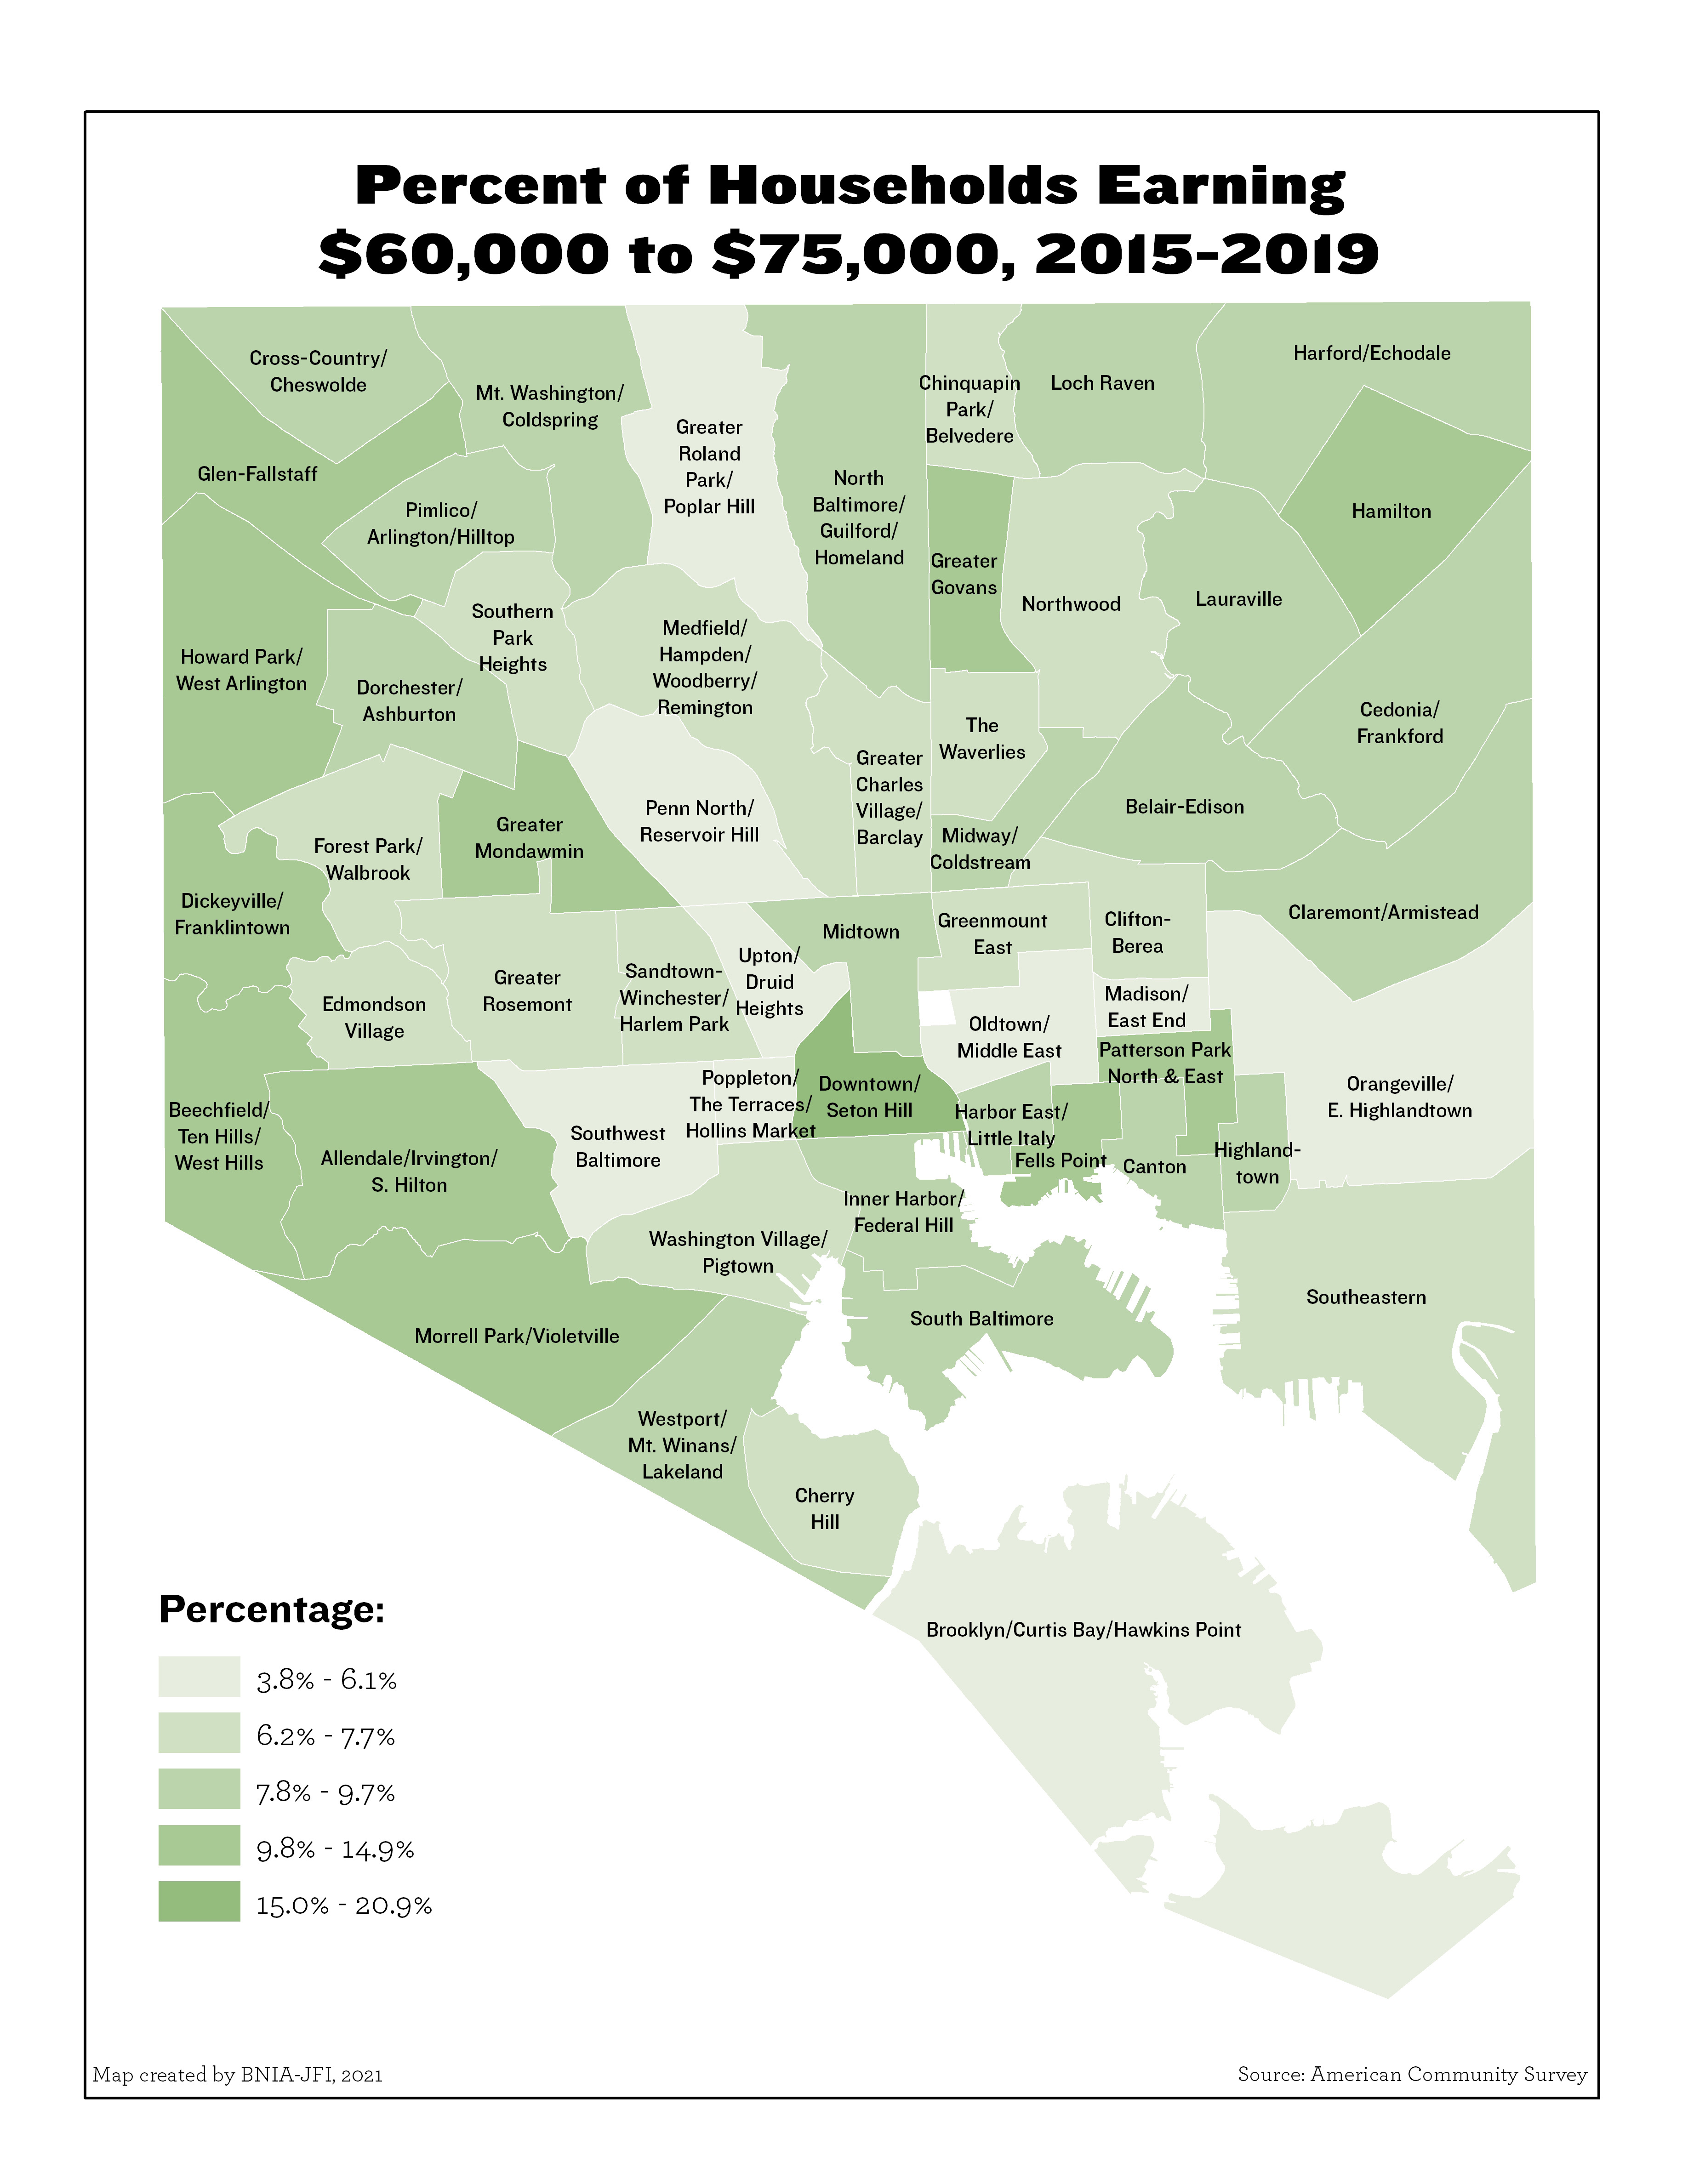
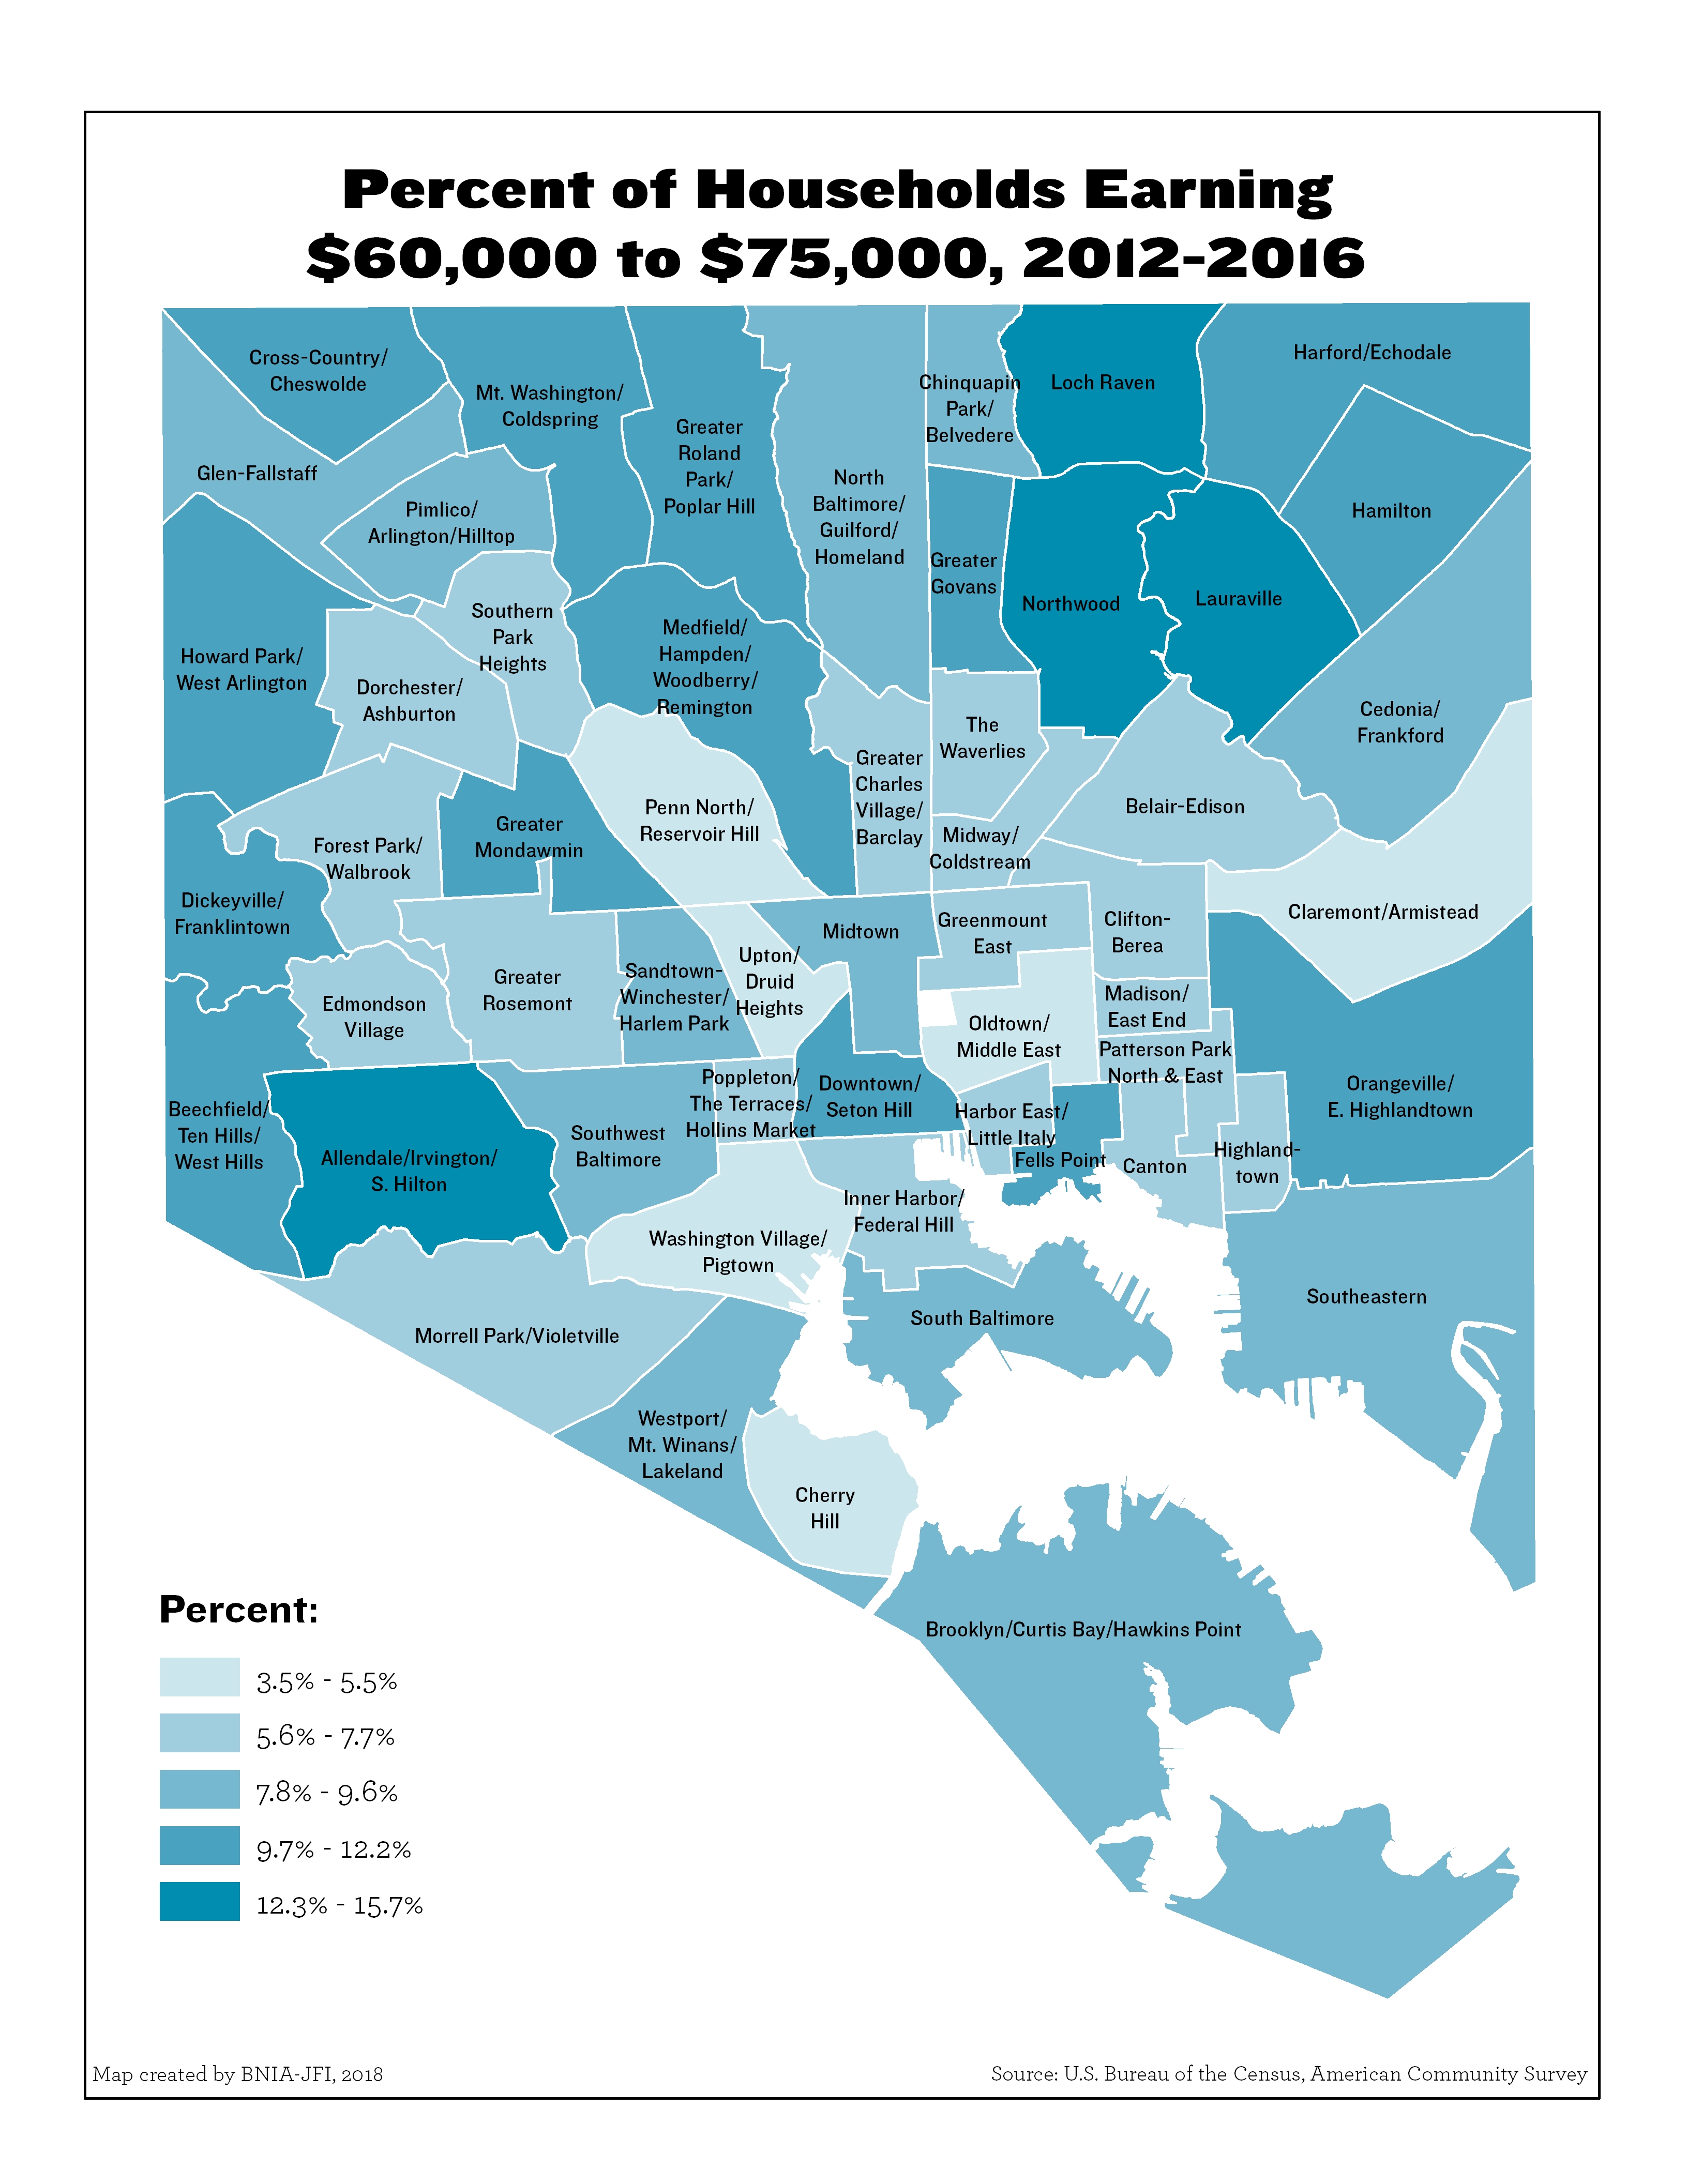
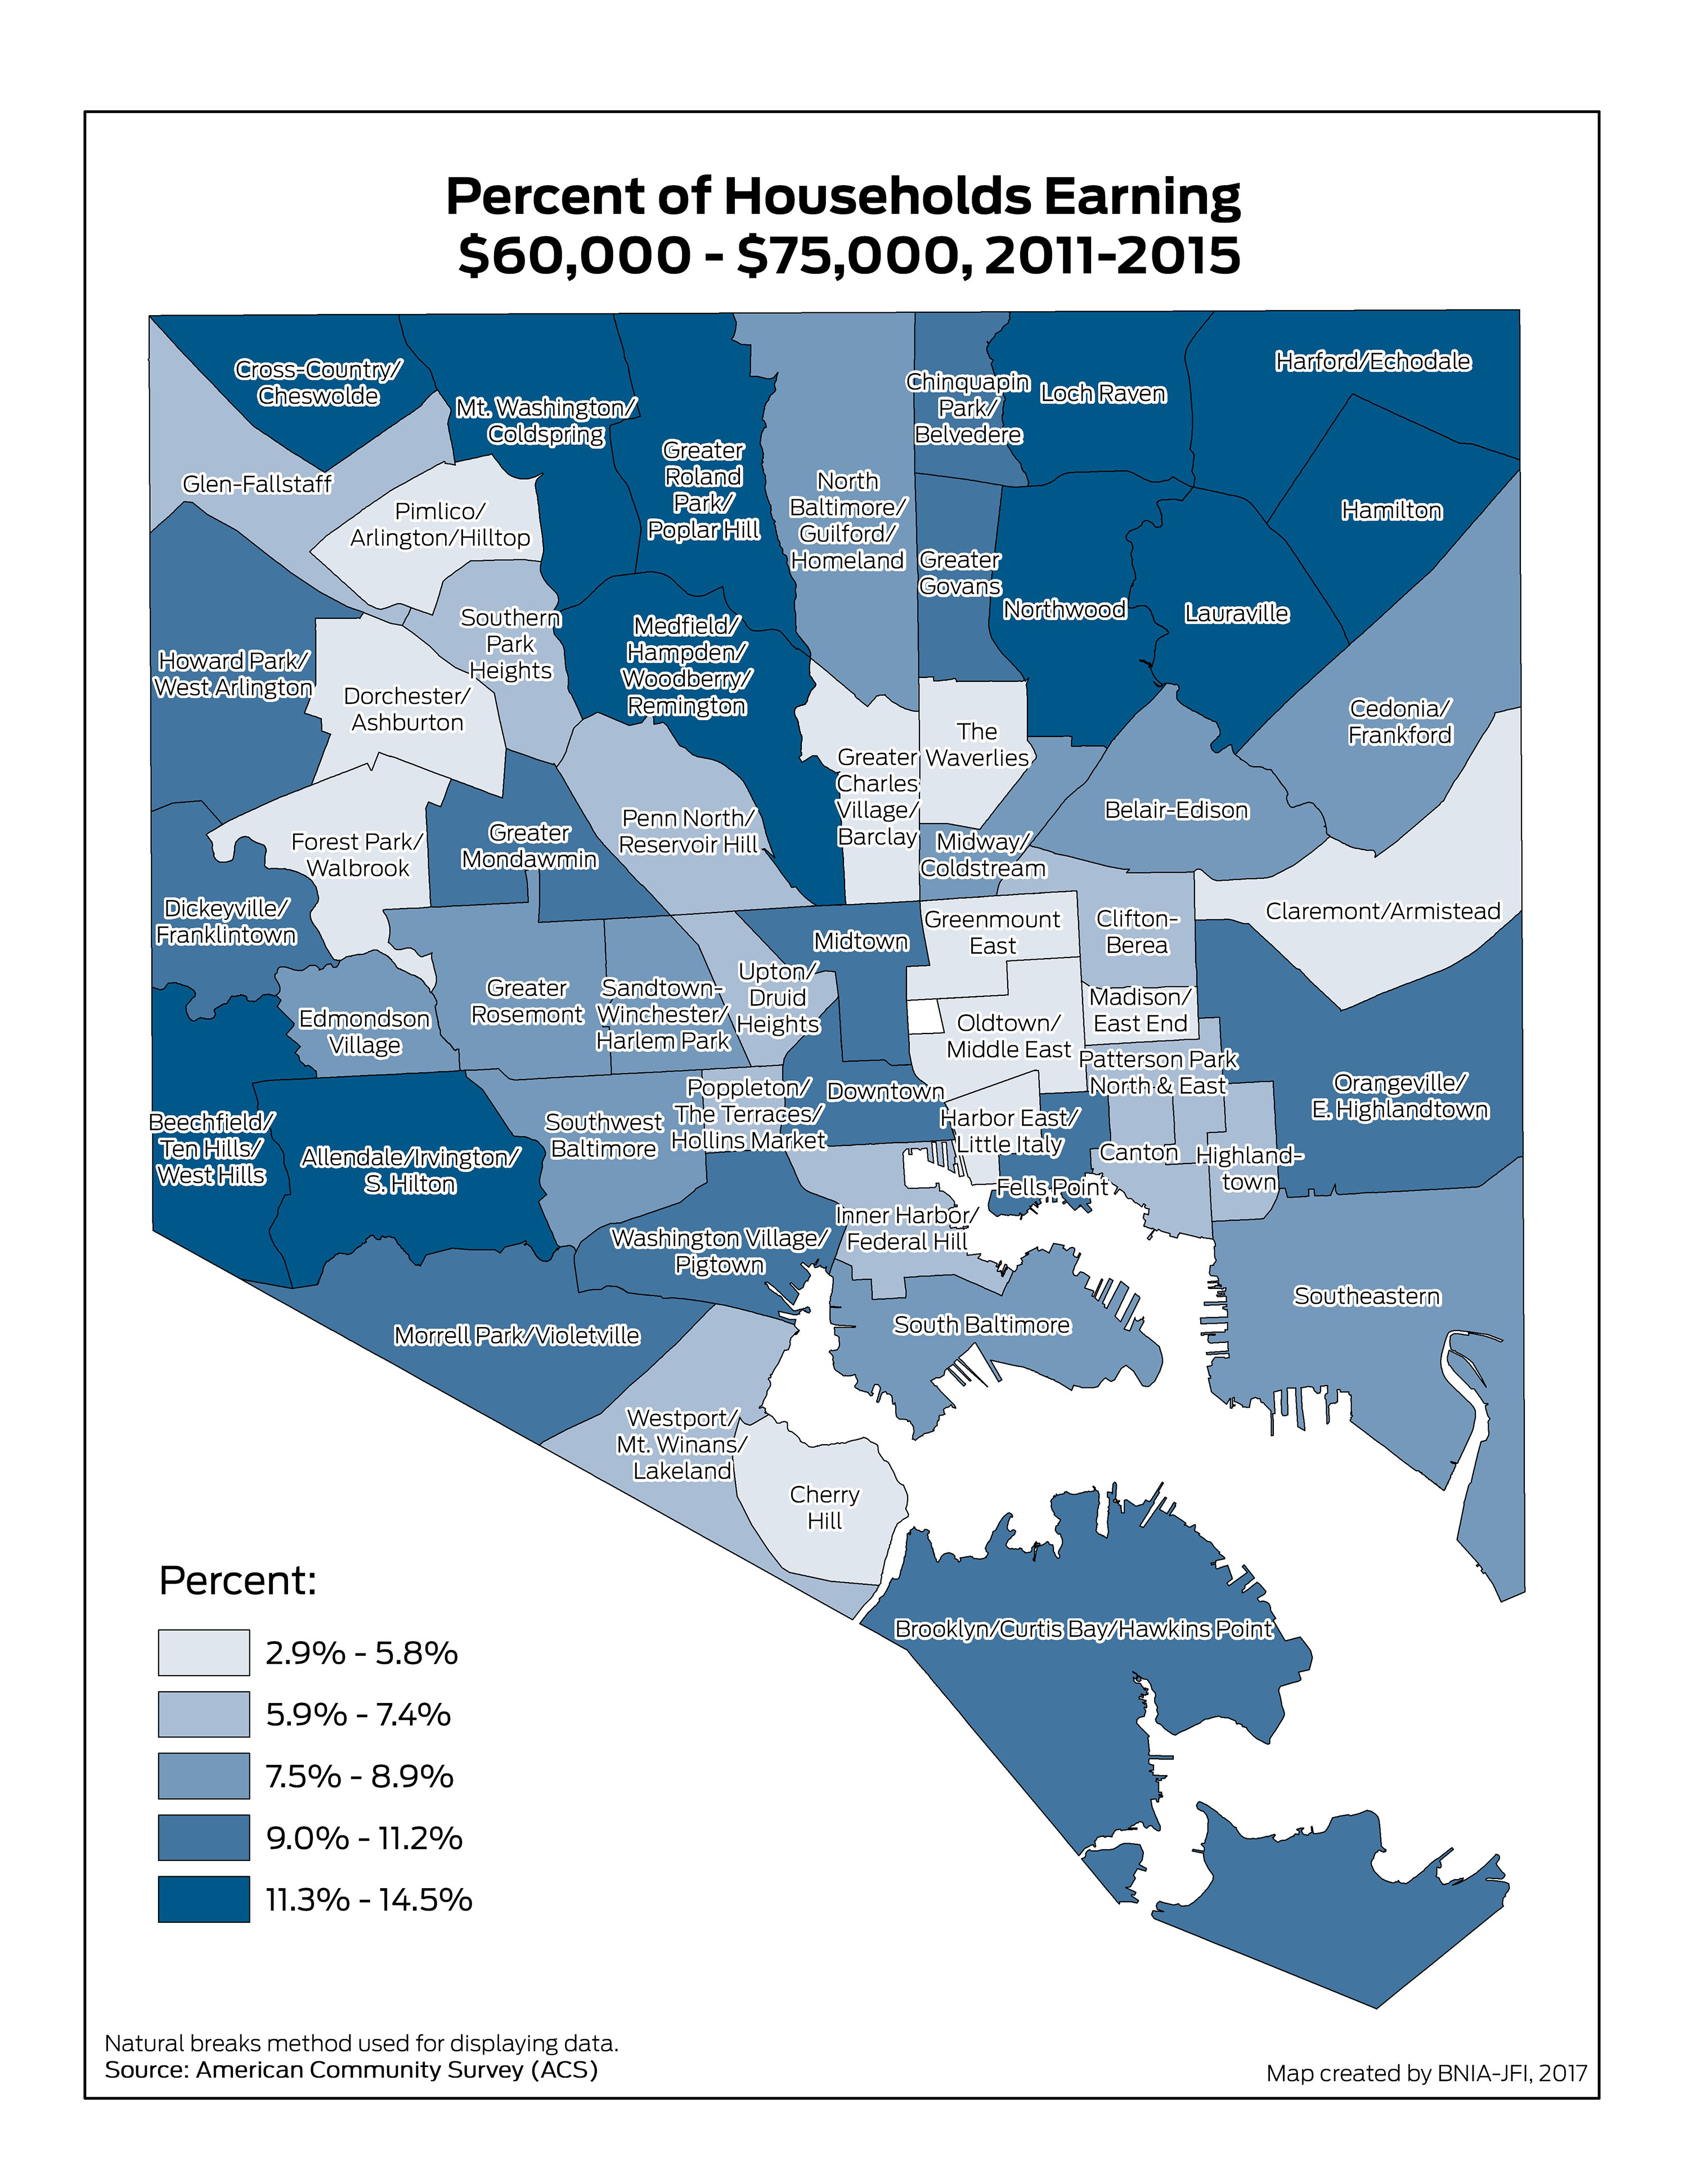
Percent of Households Earning $60,000 to $75,000
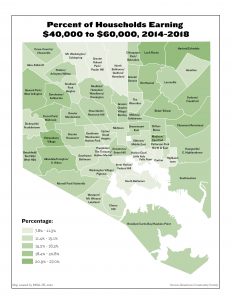
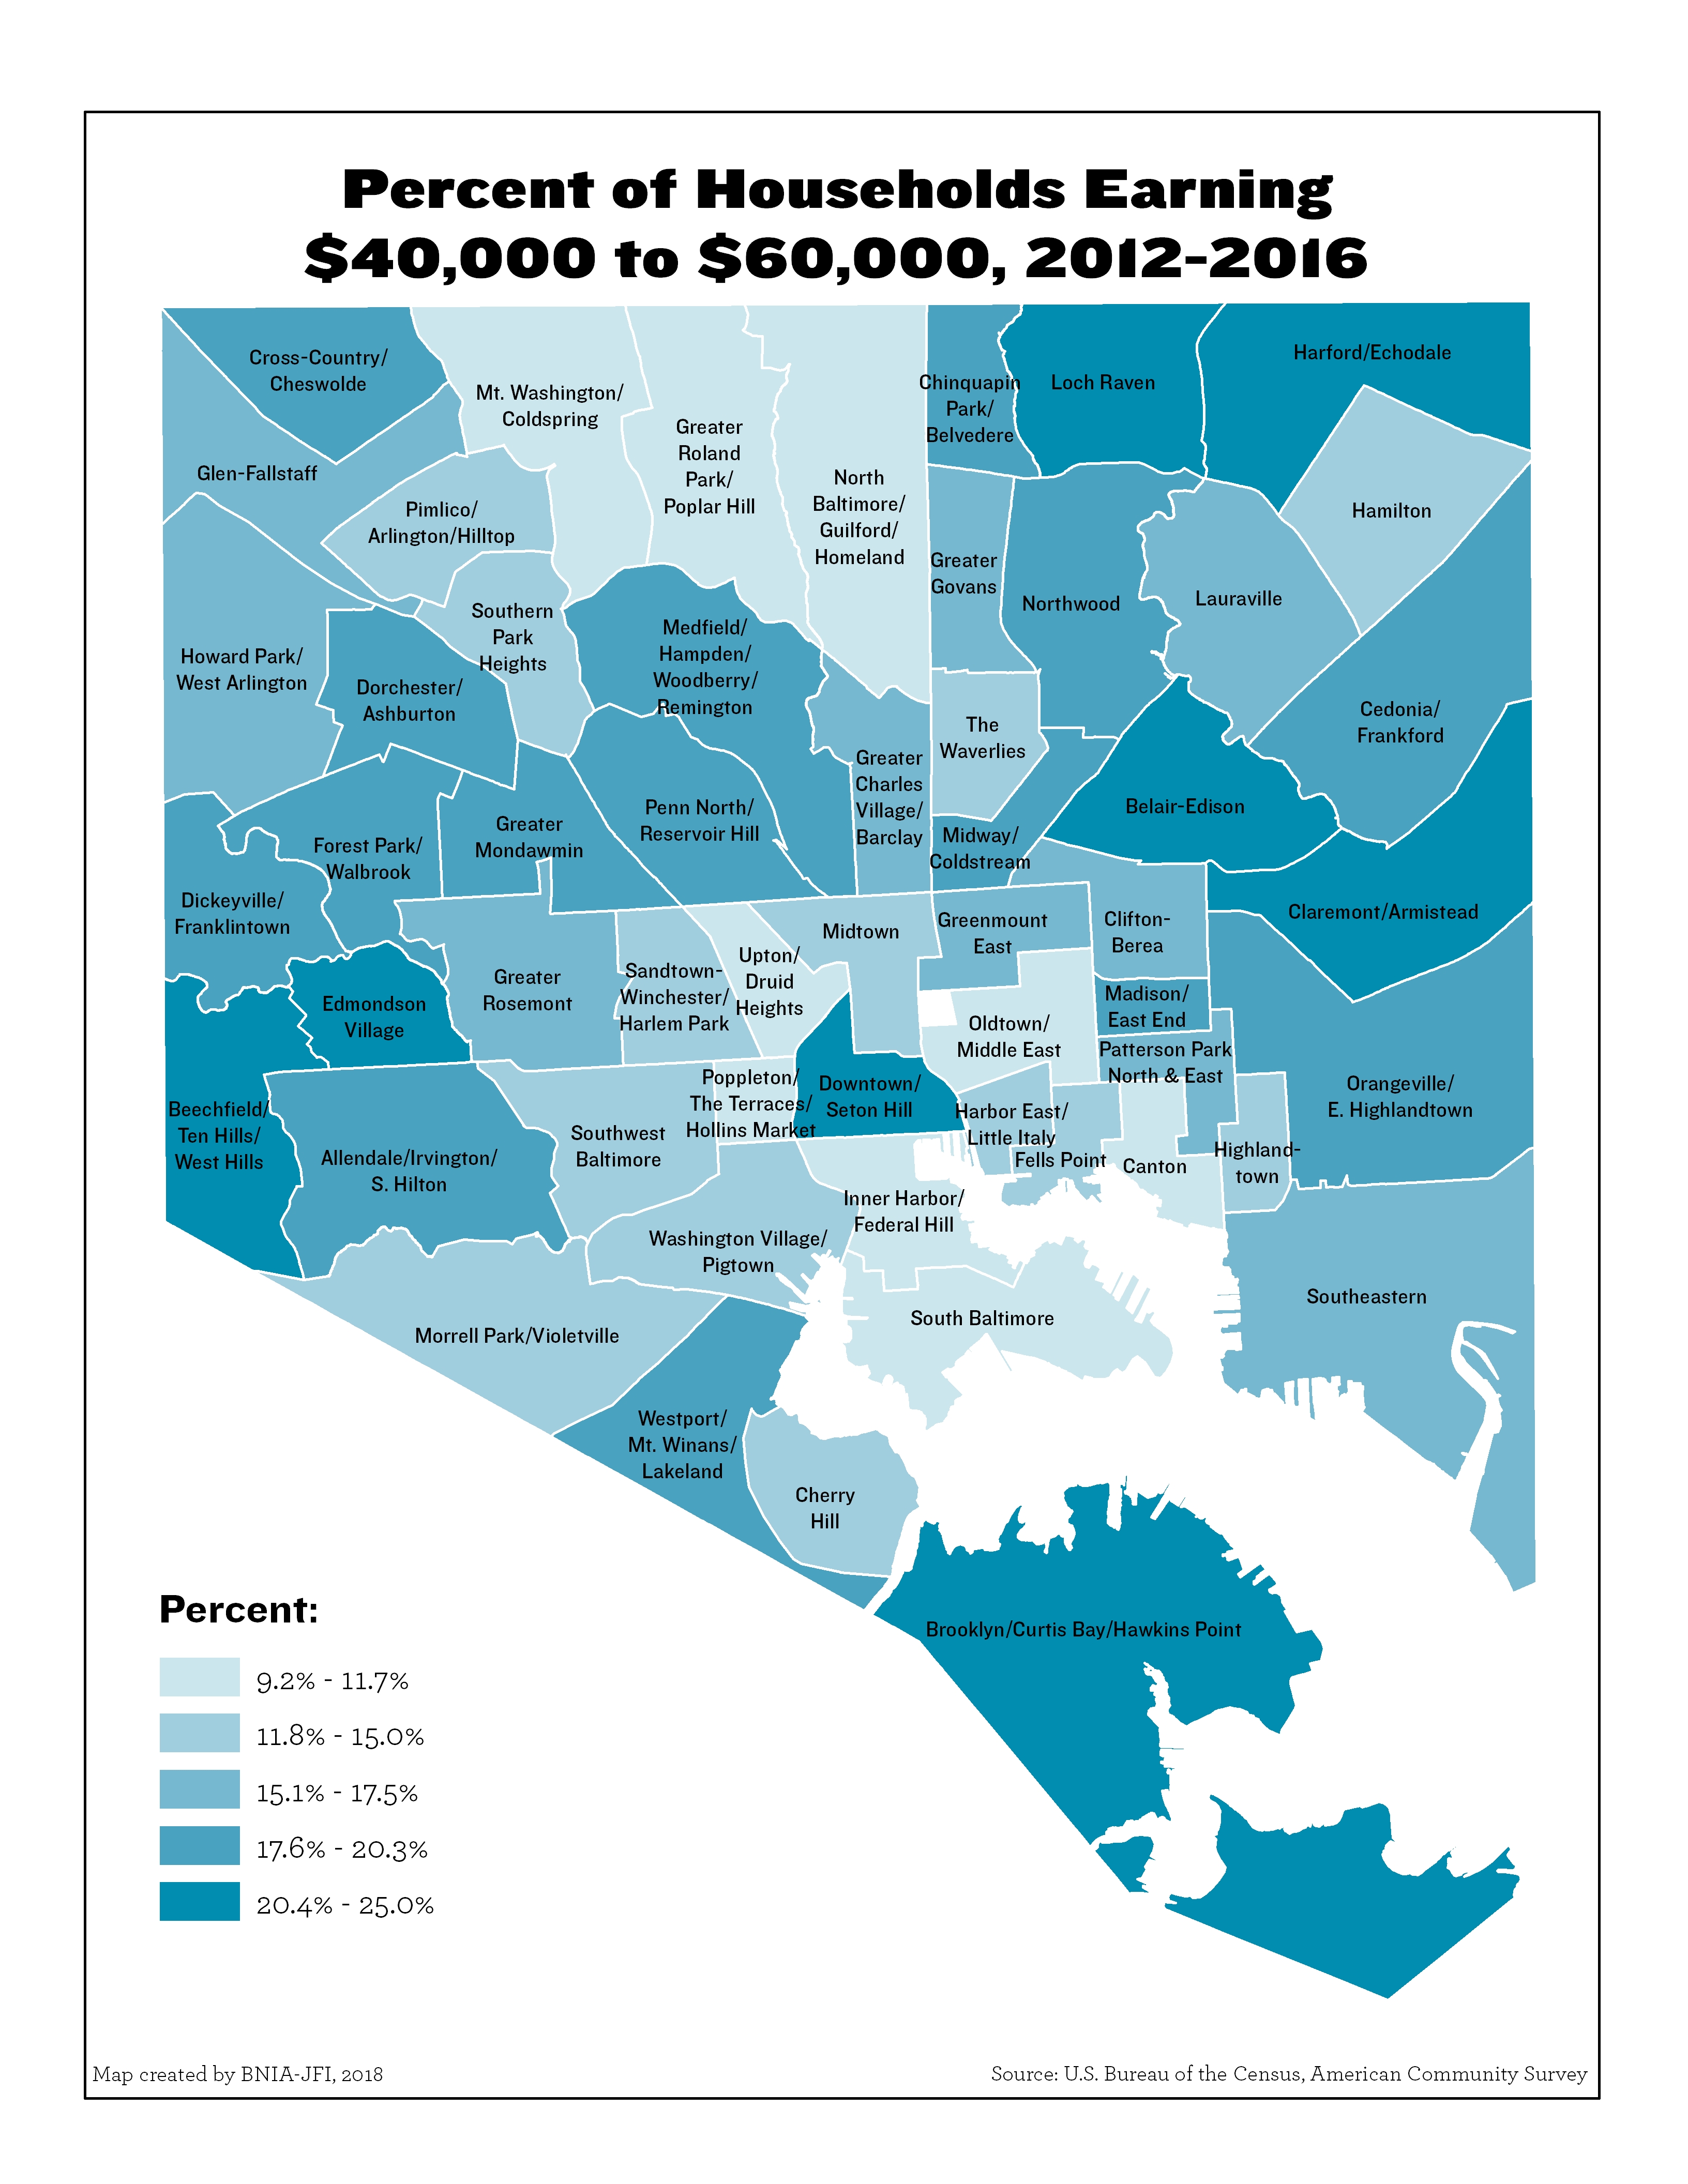
Percent of Households Earning $40,000 to $60,000
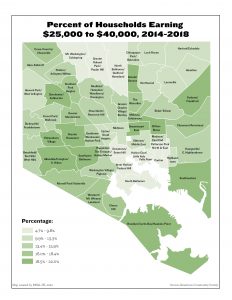
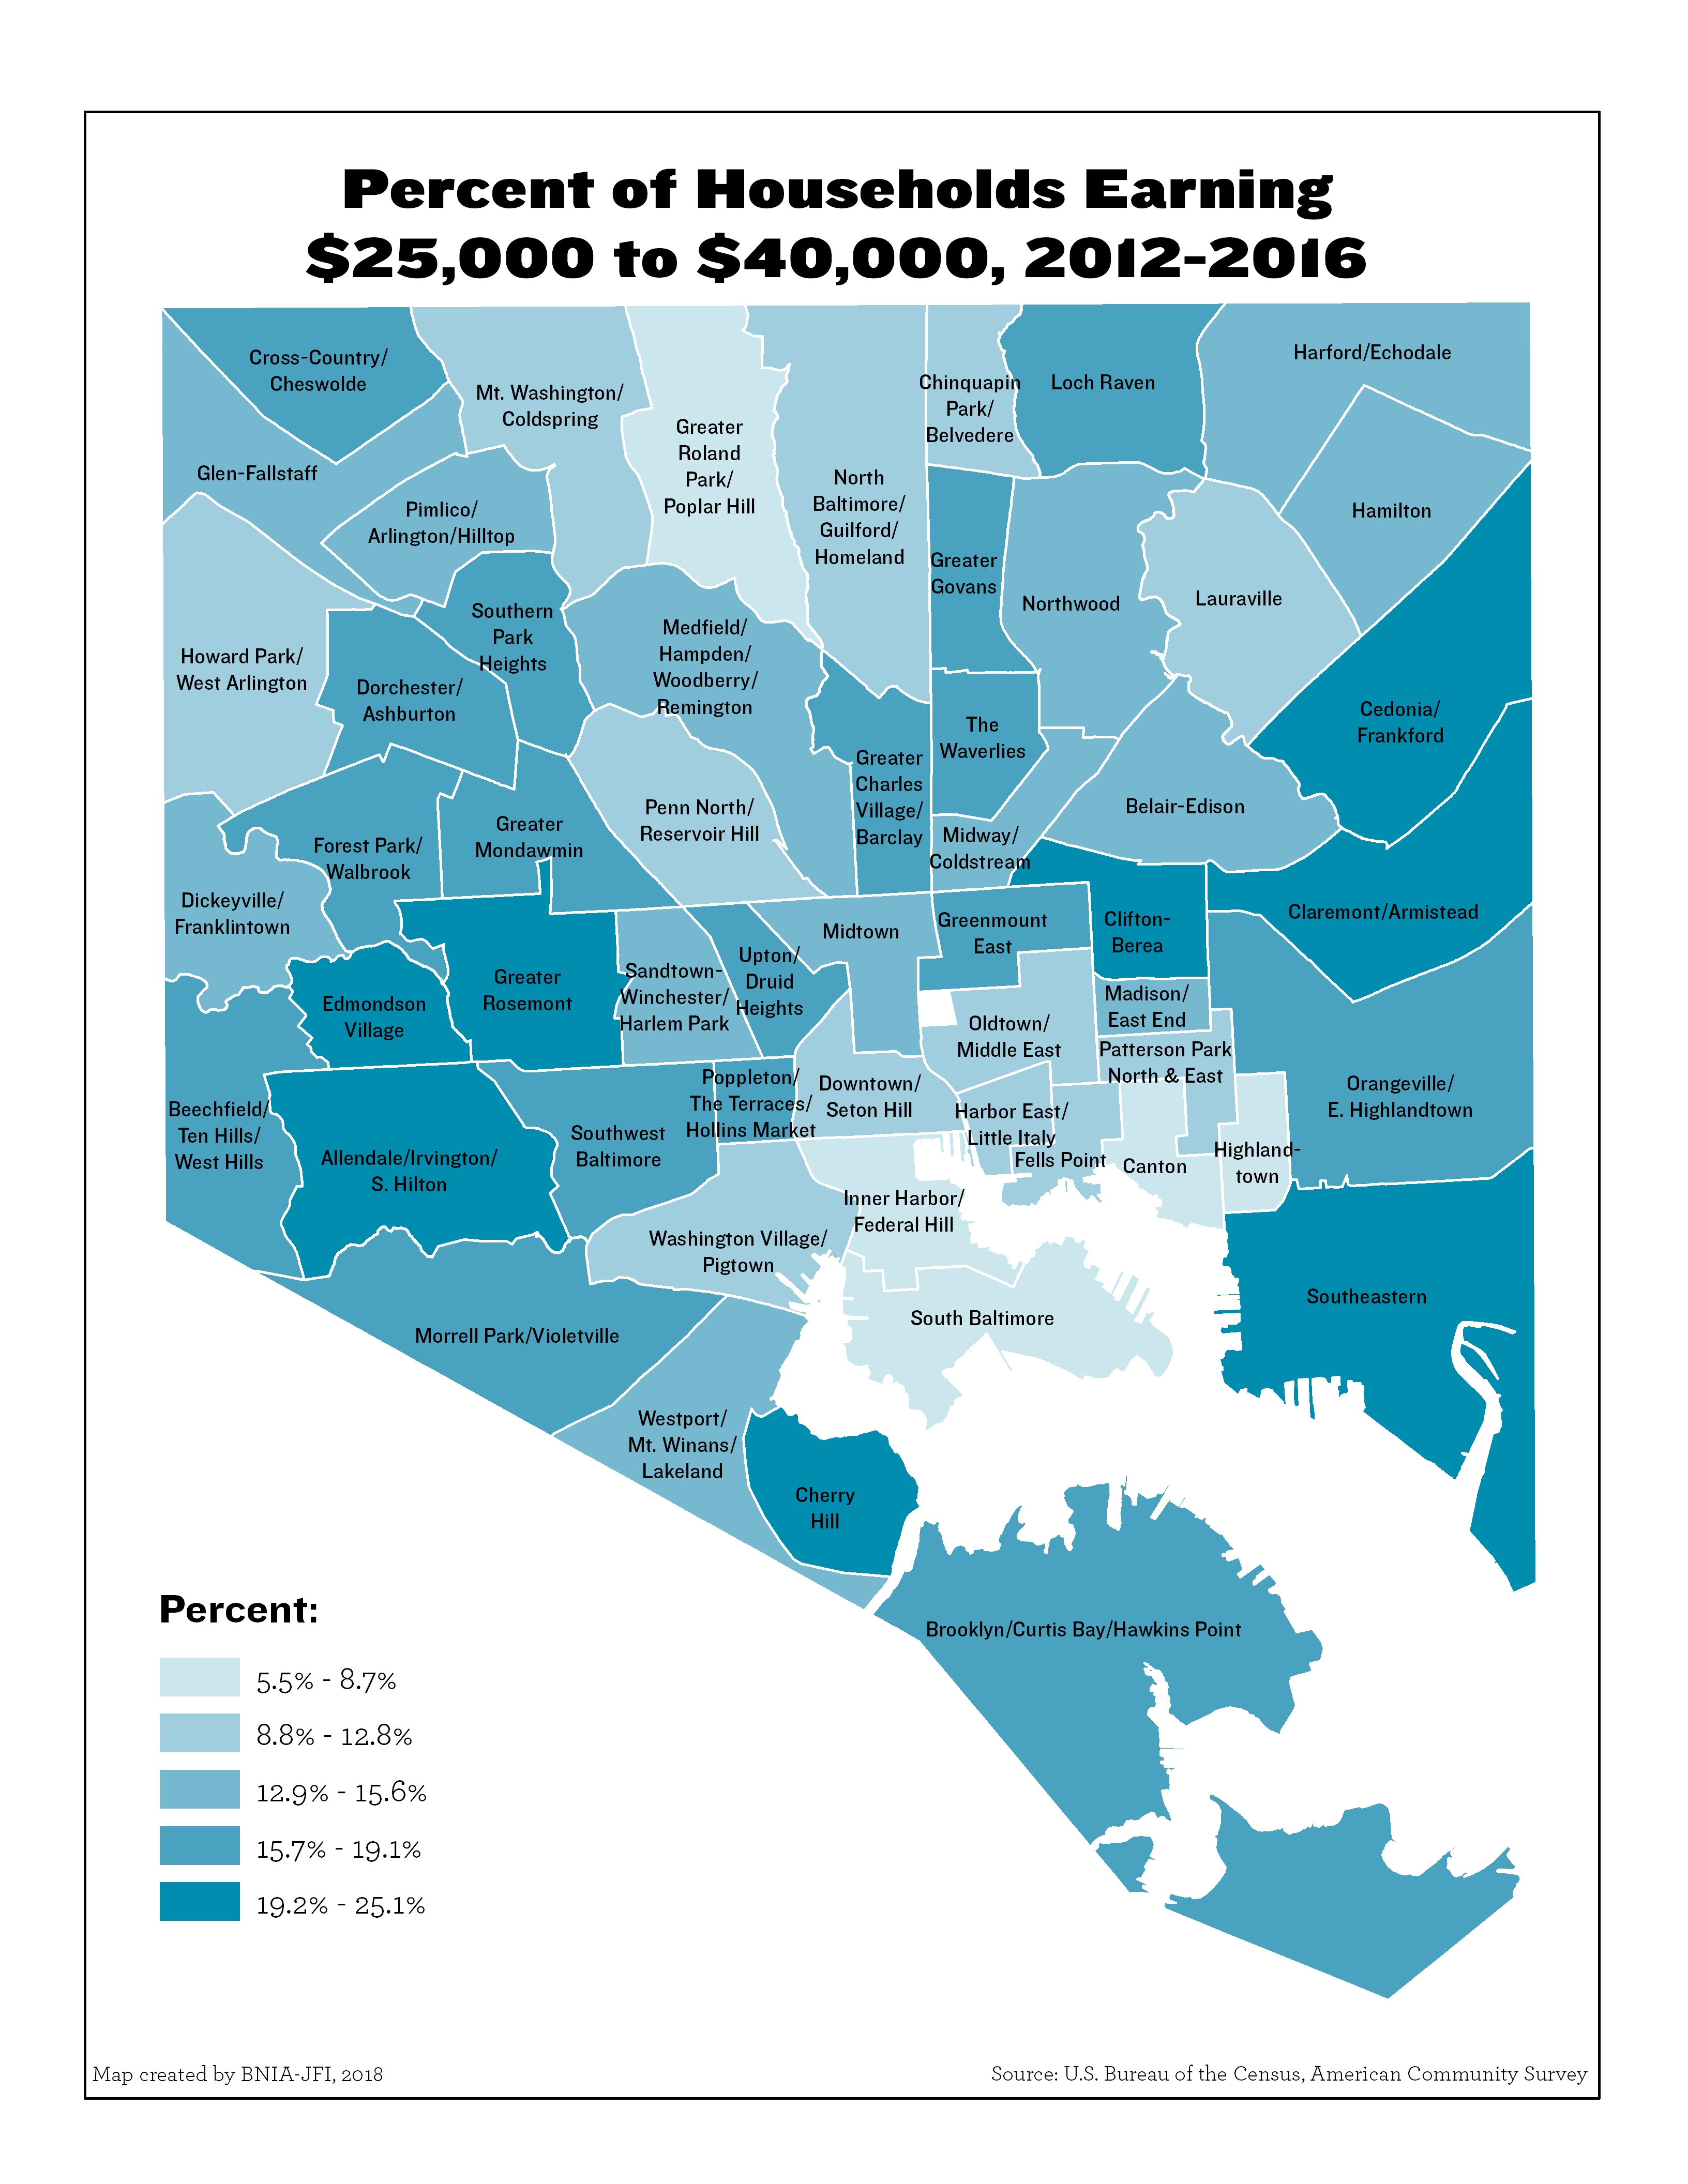
Percent of Households Earning $25,000 to $40,000
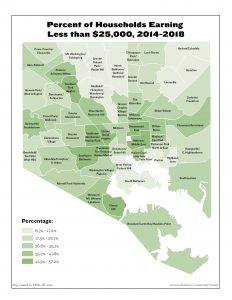
Percent of Households Earning Less than $25,000
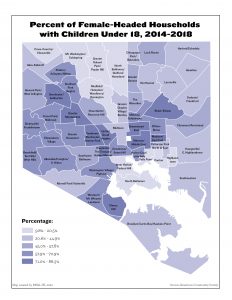
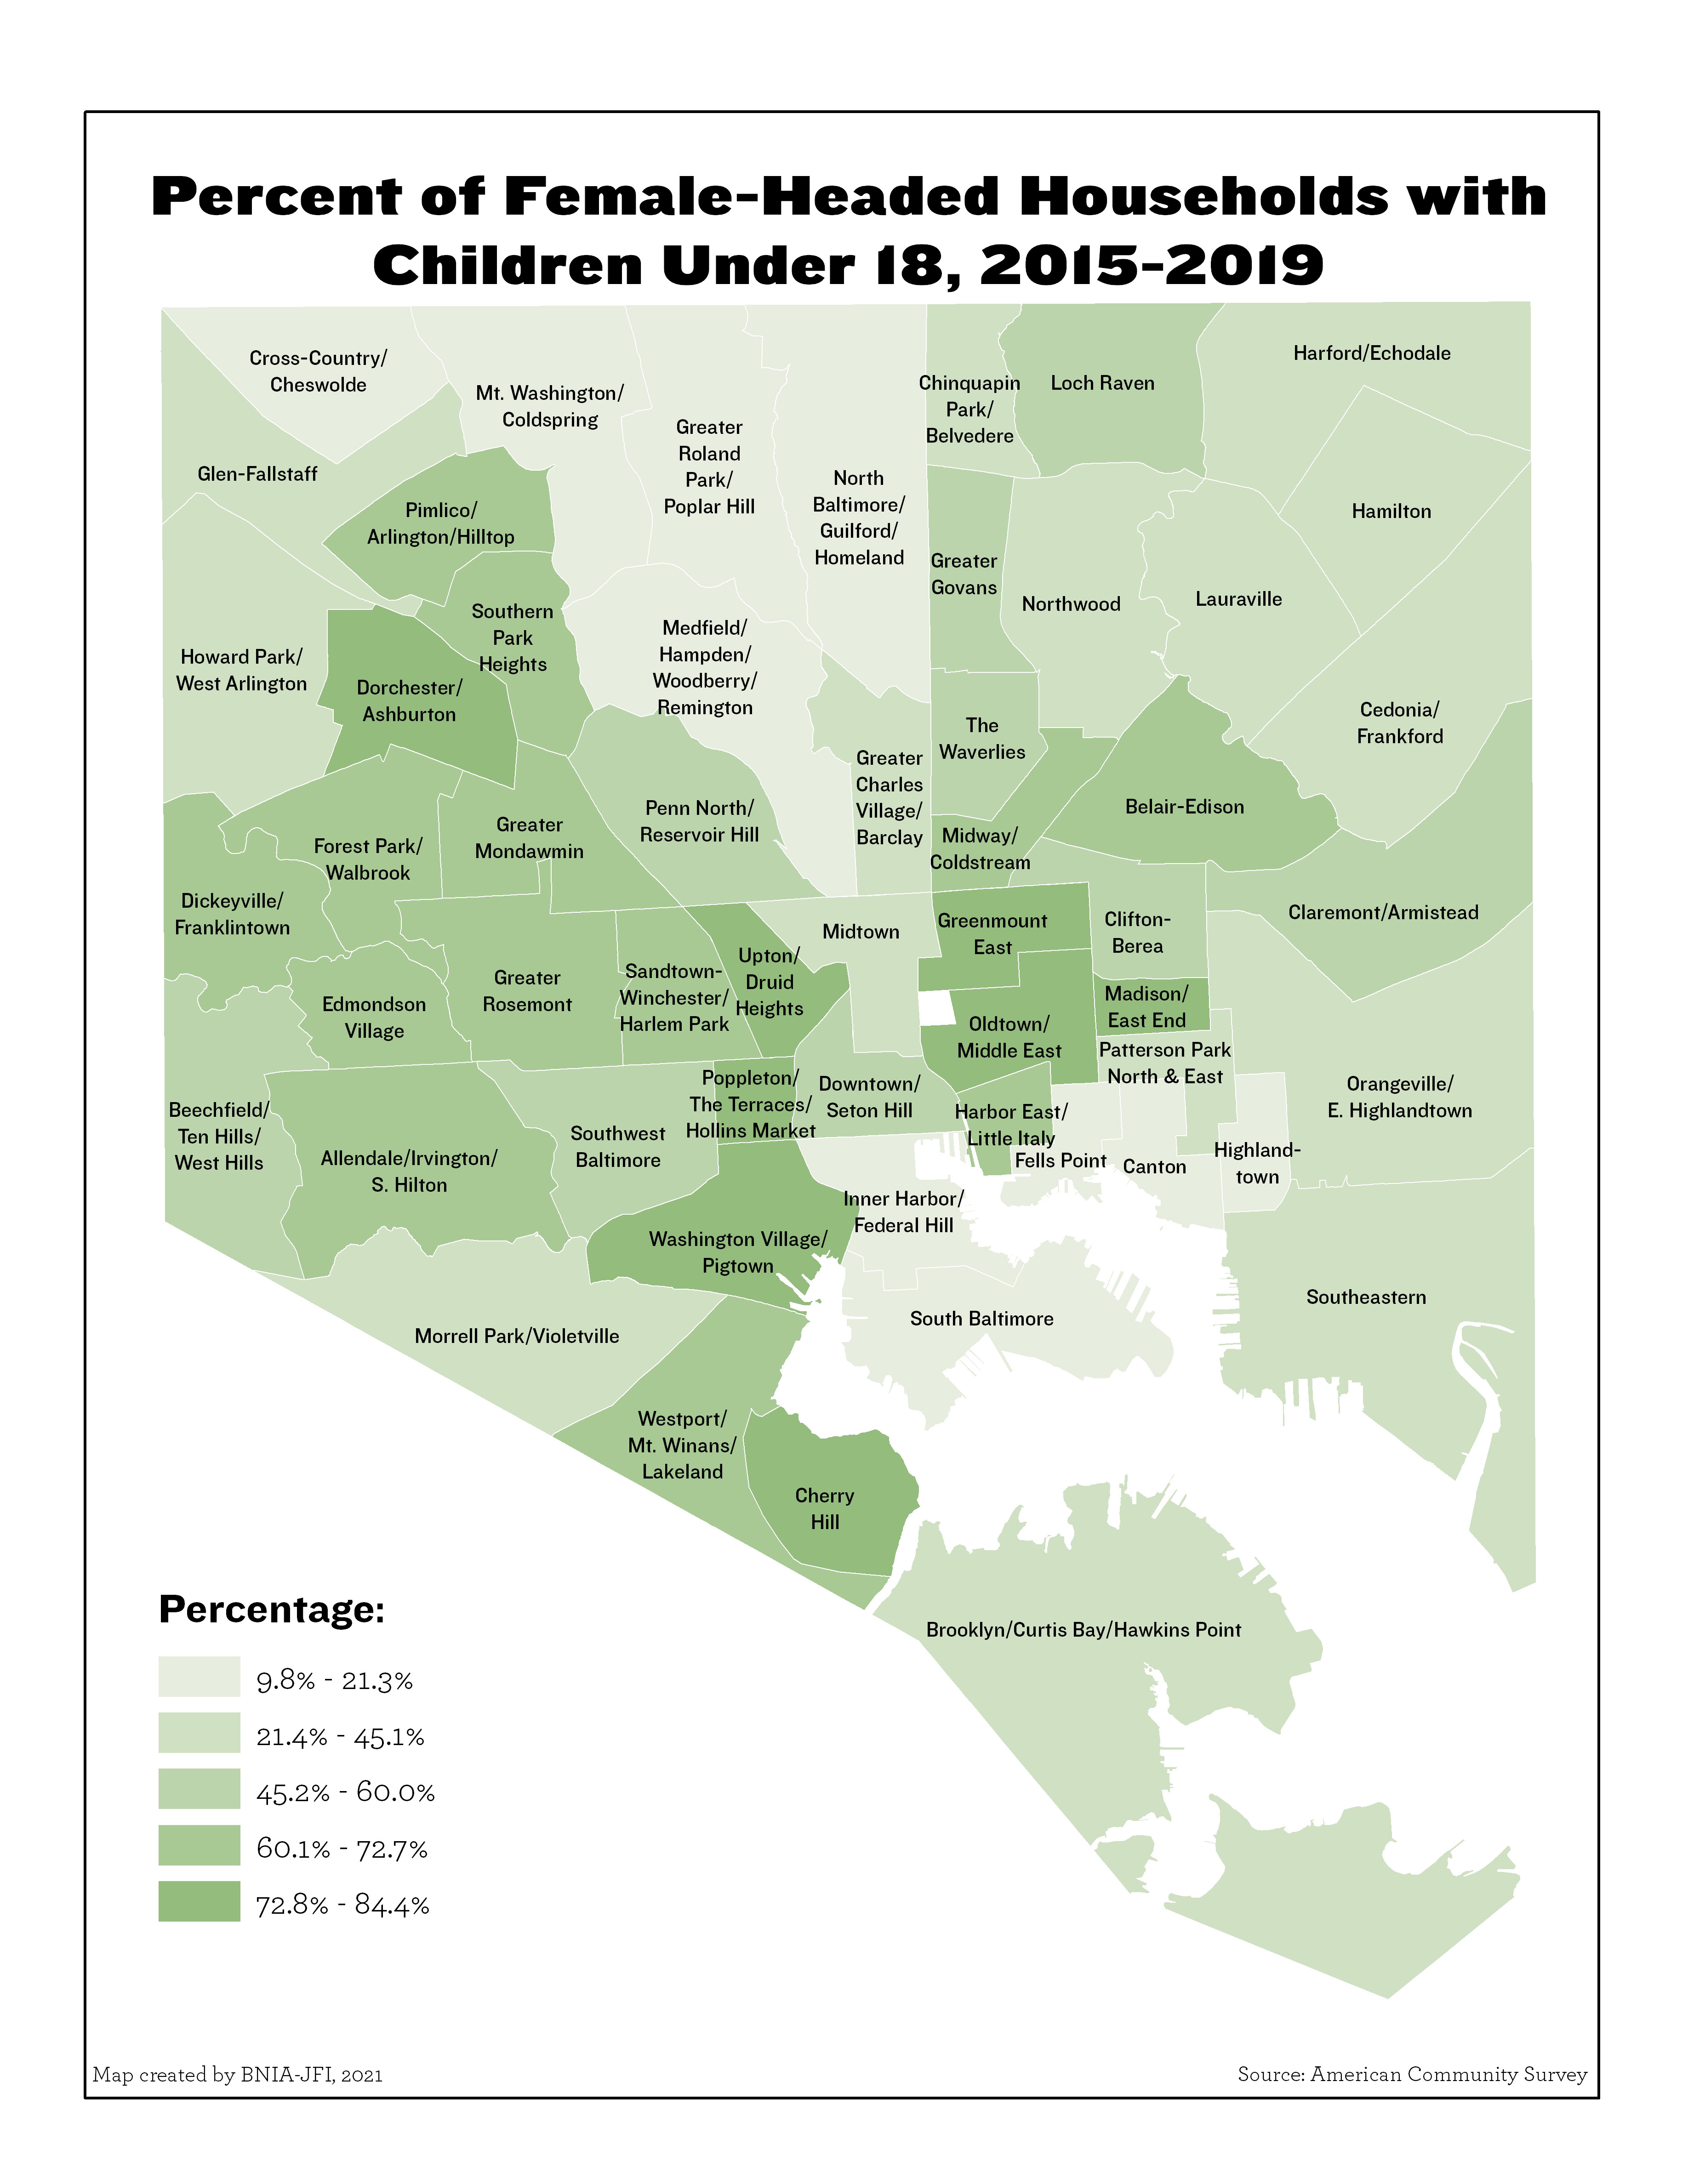
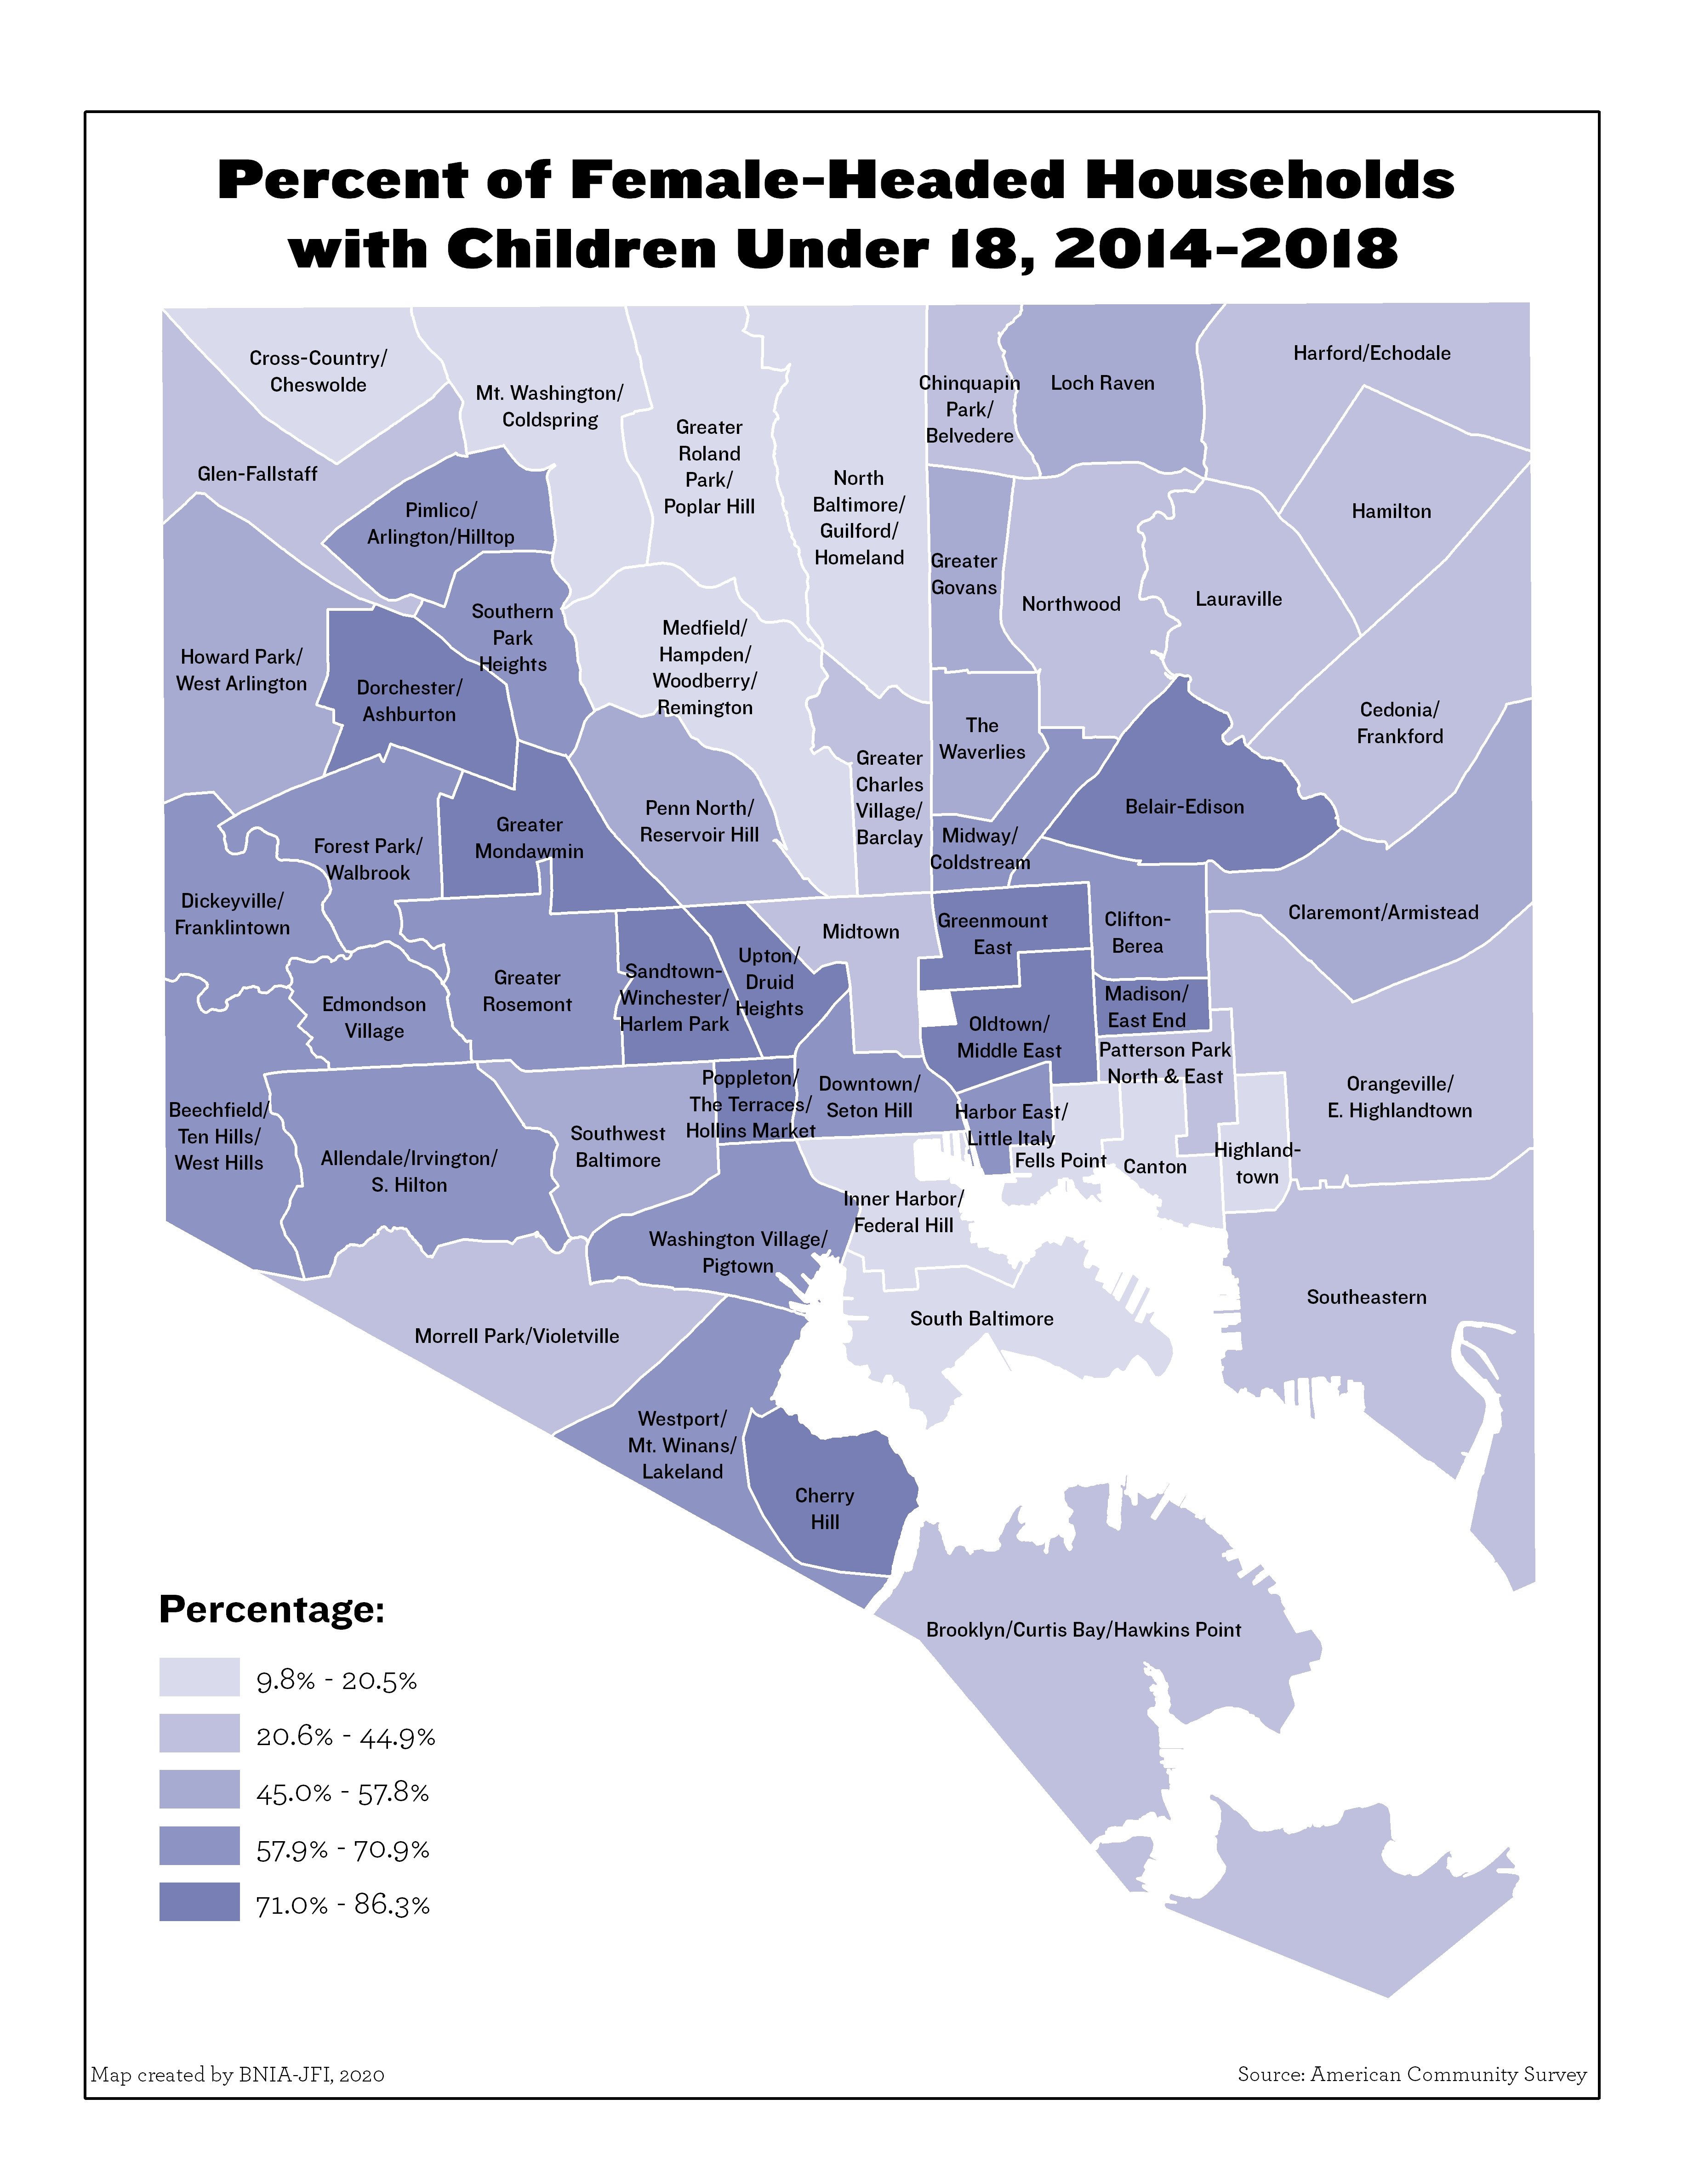
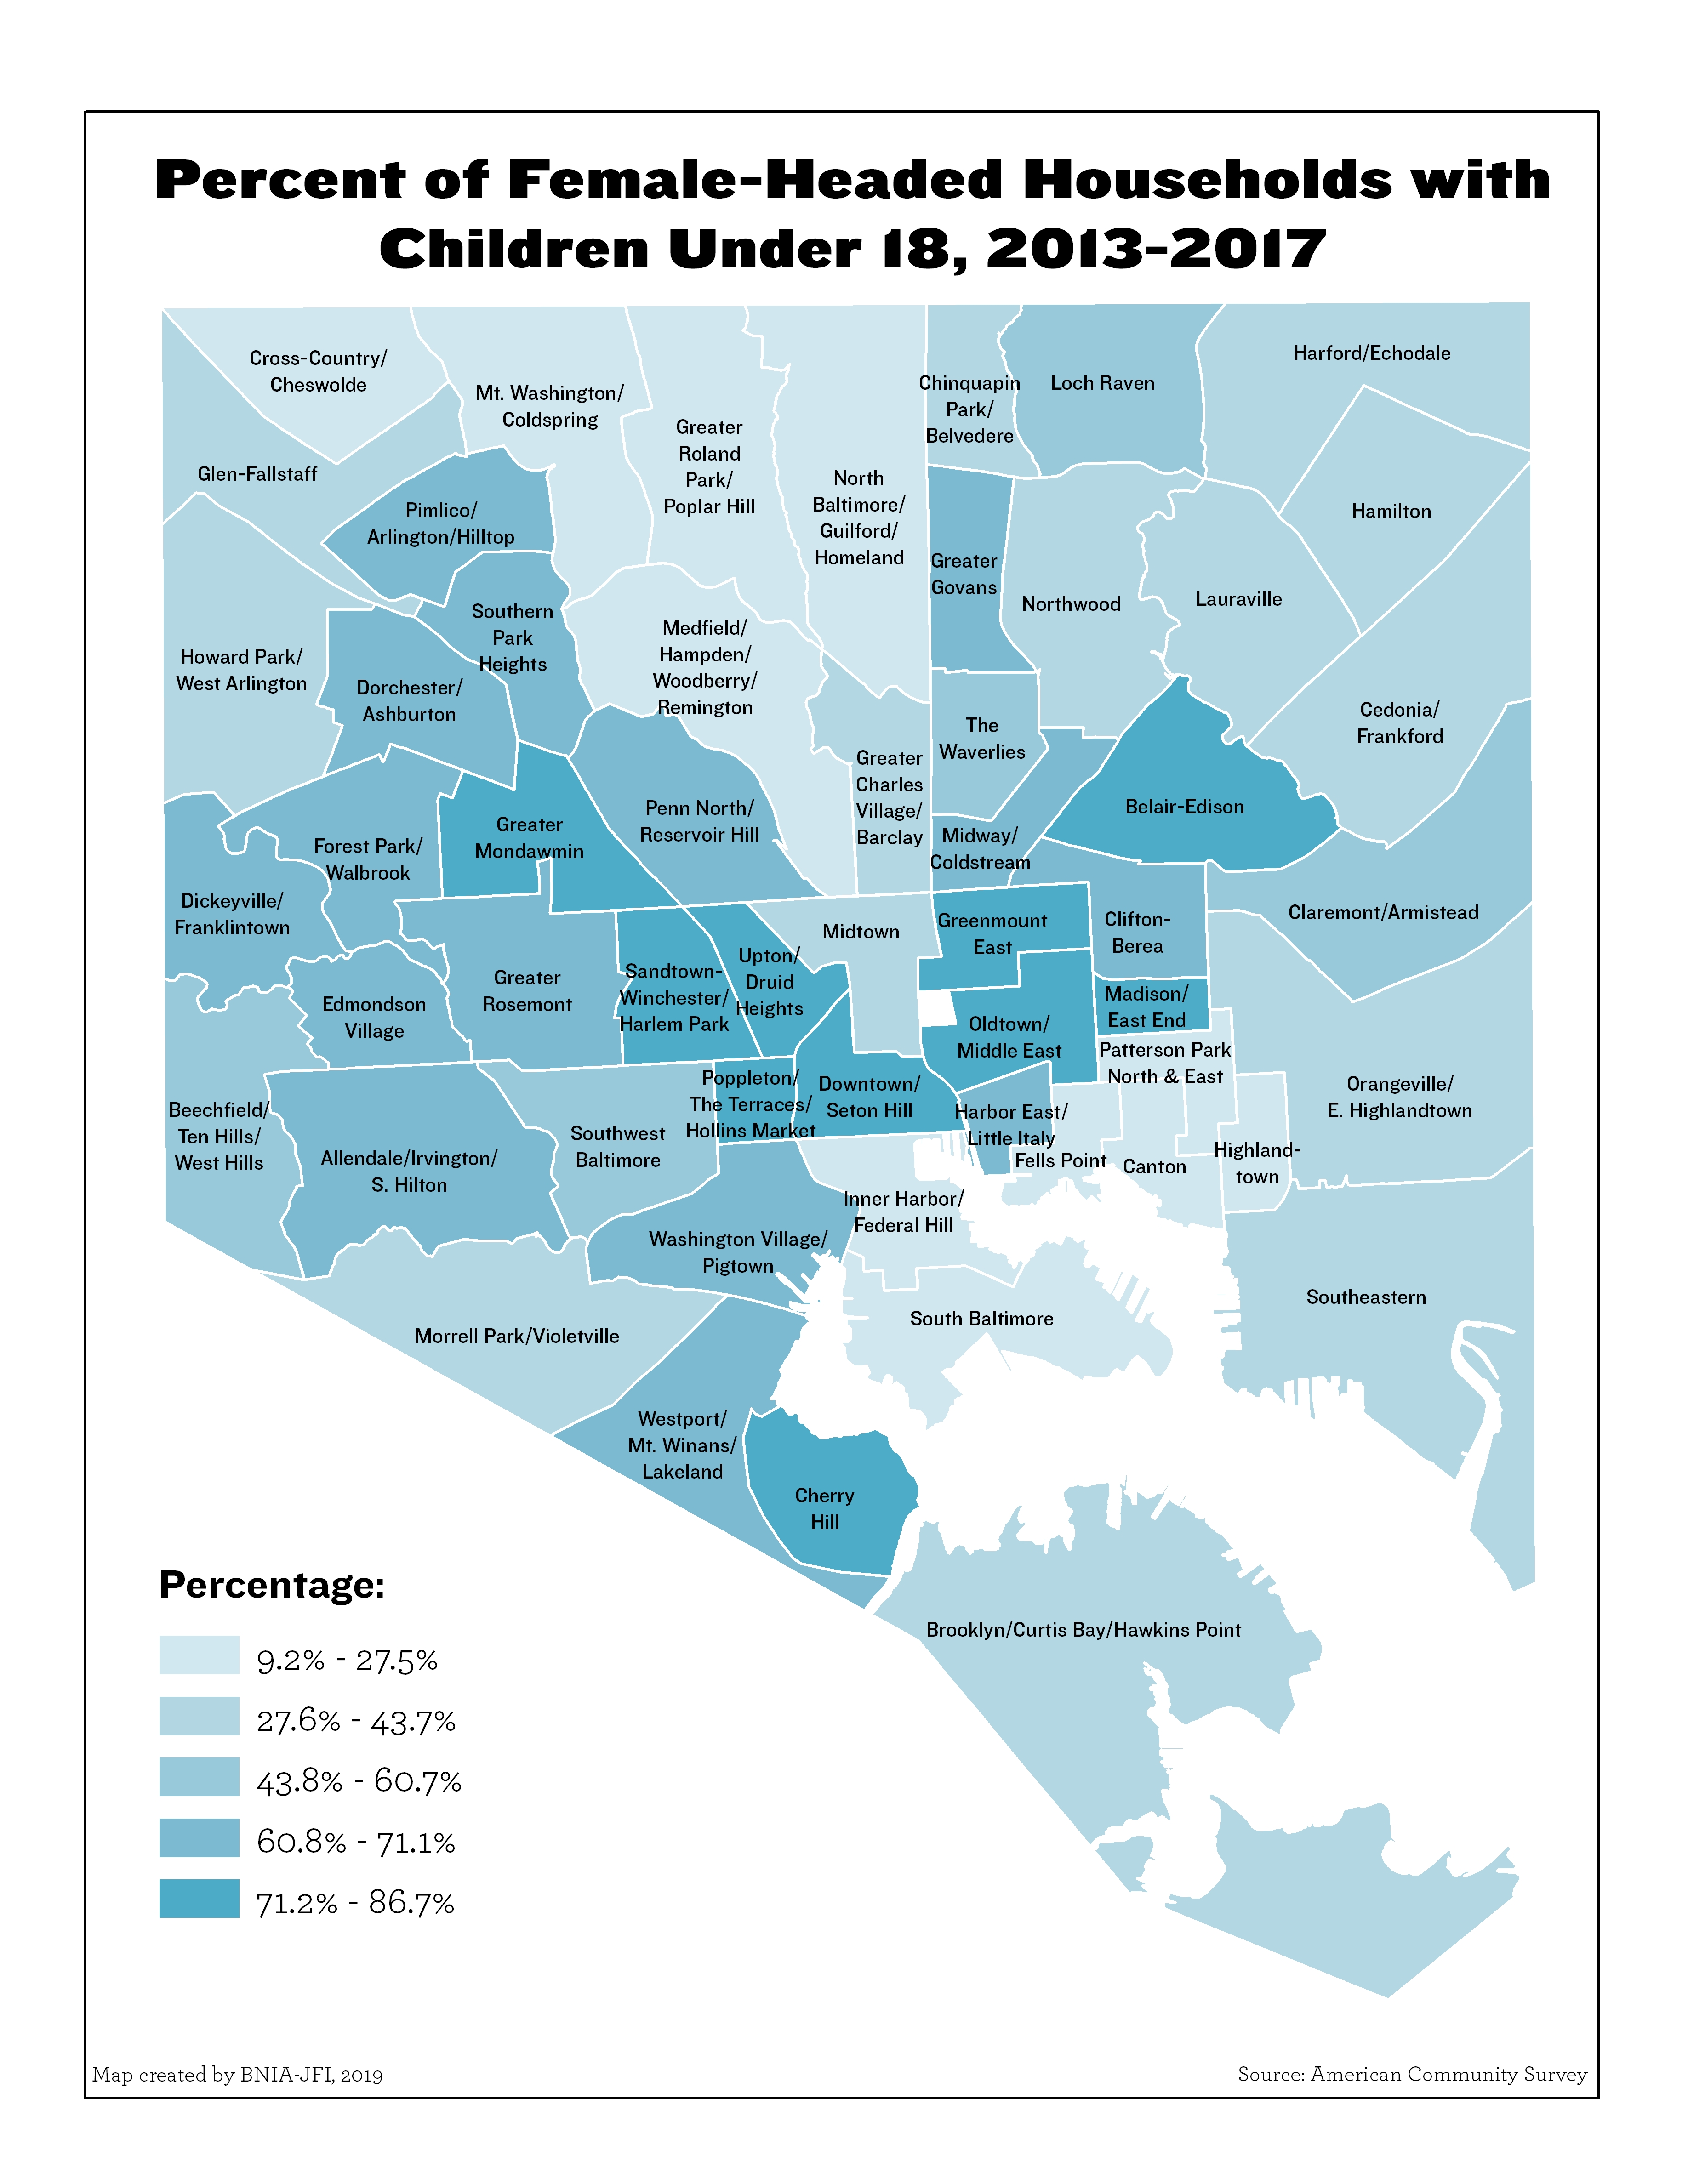
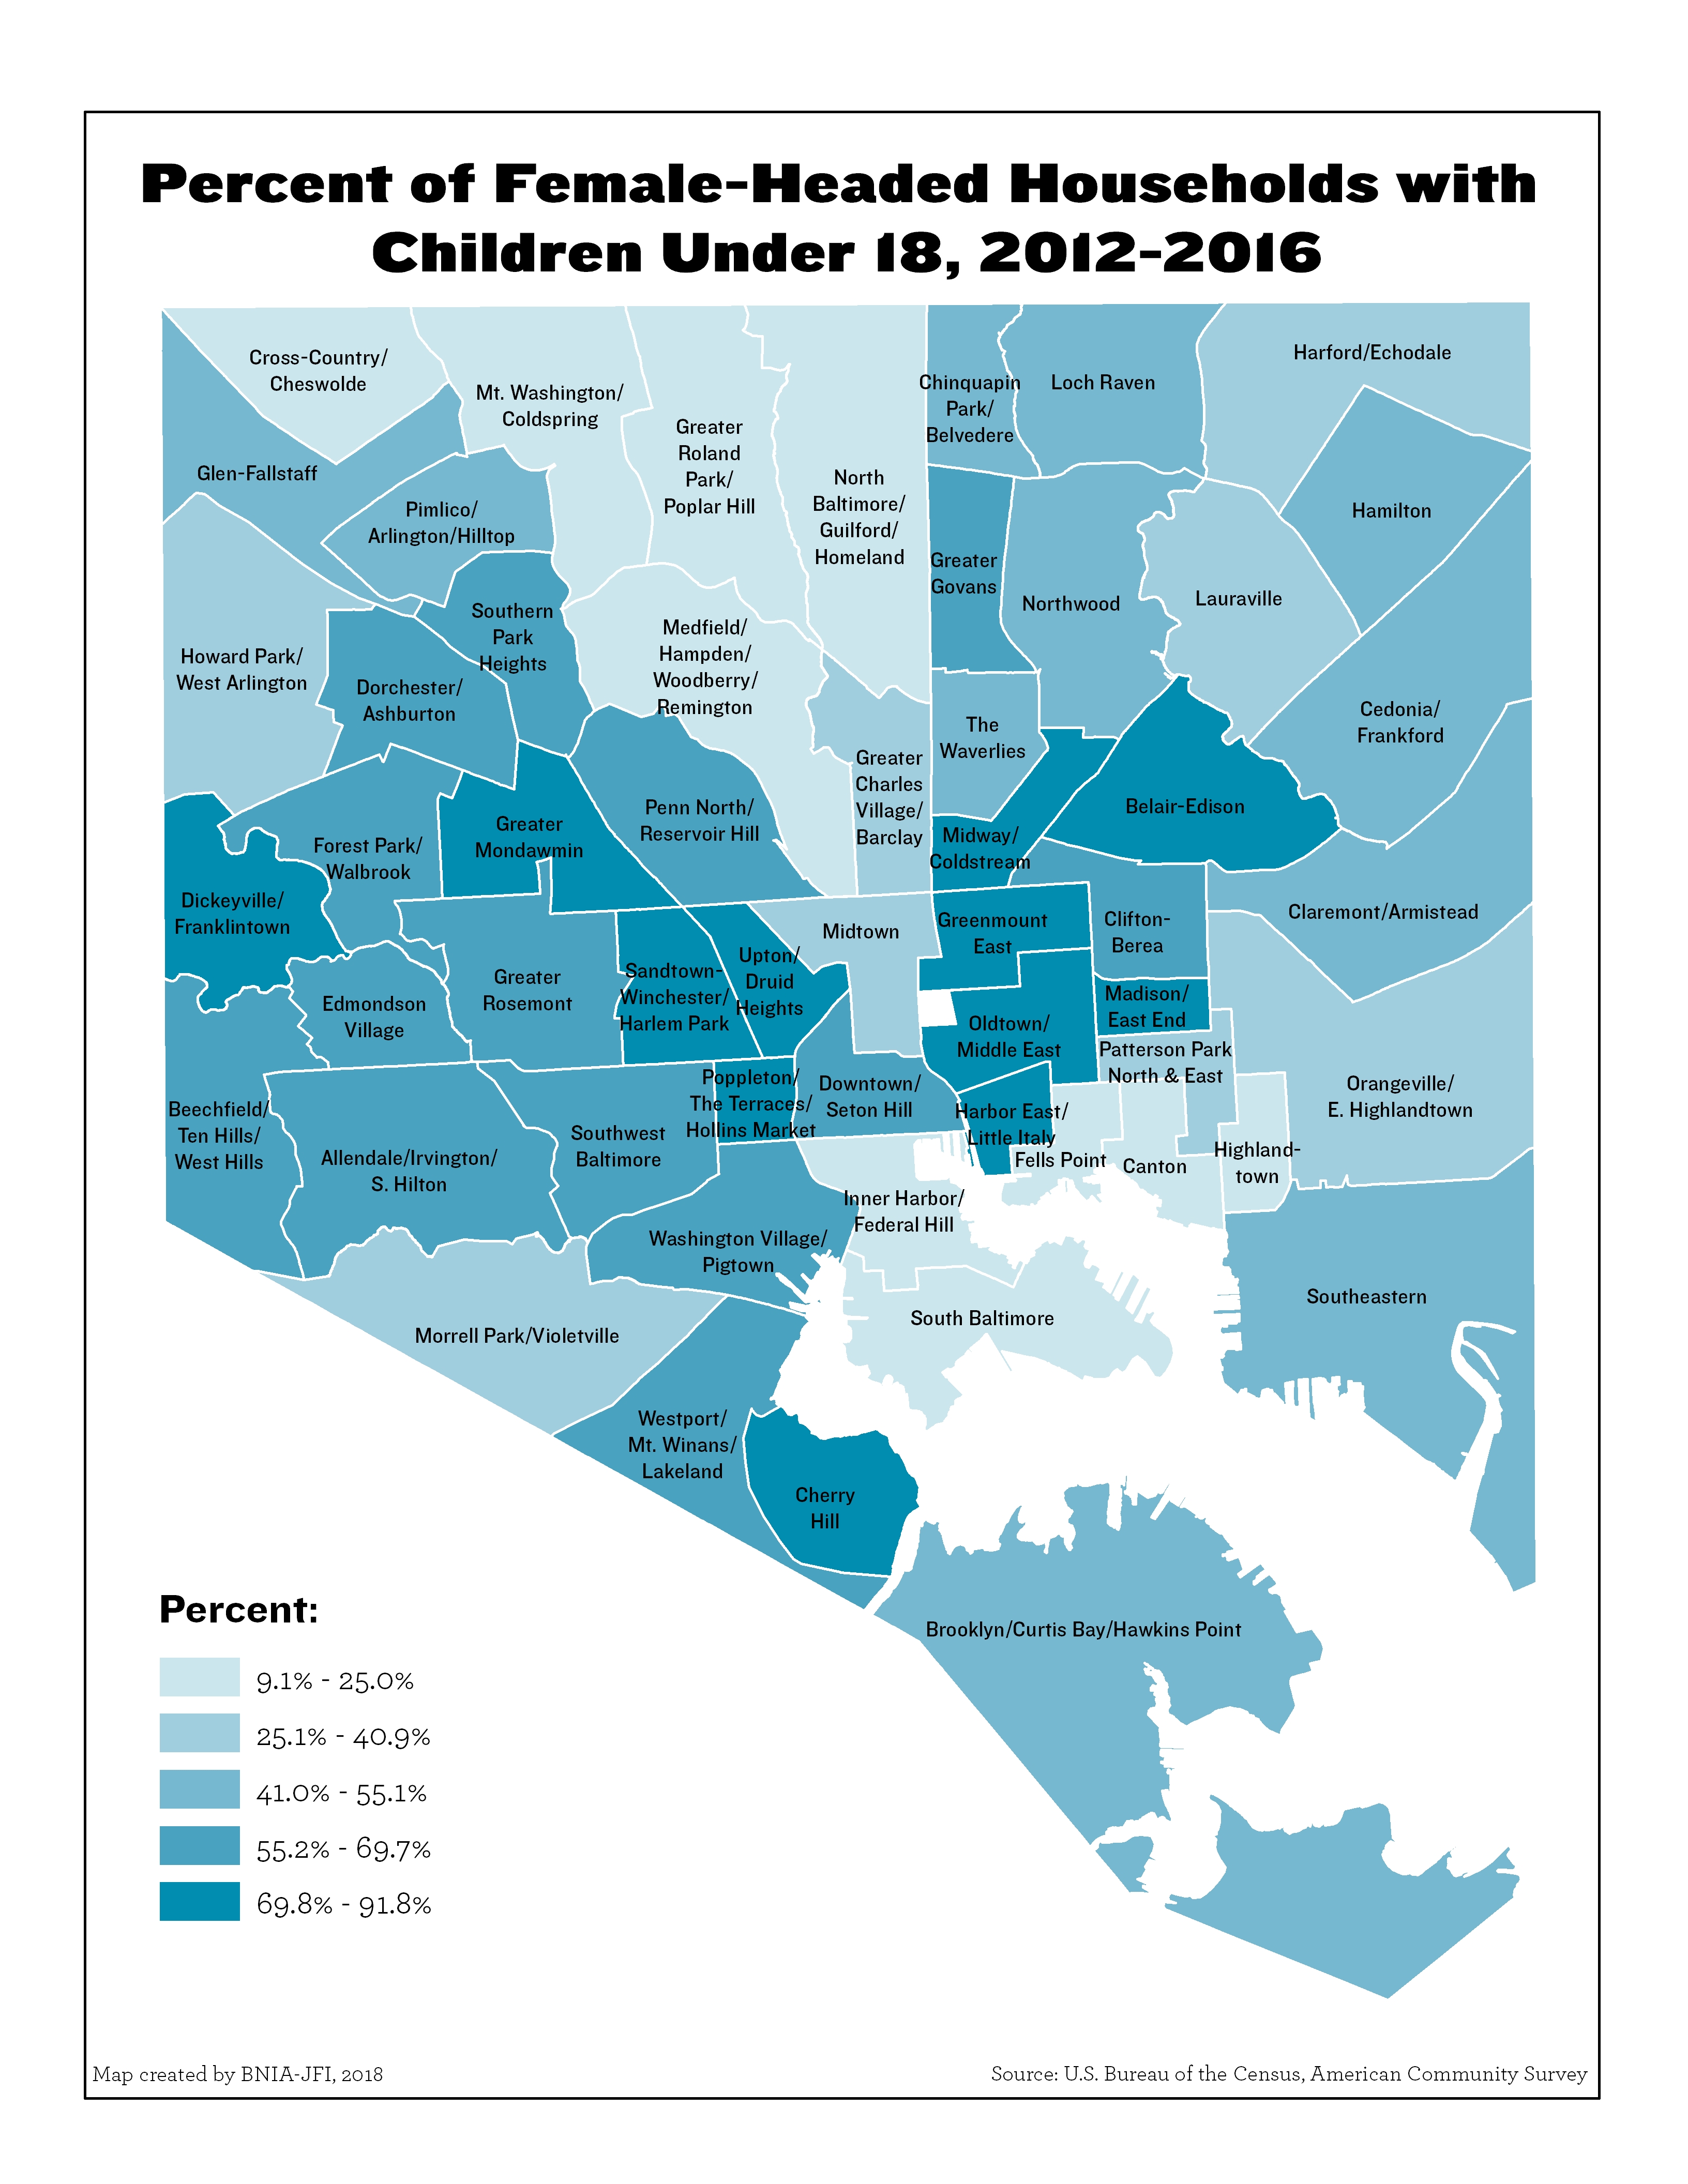
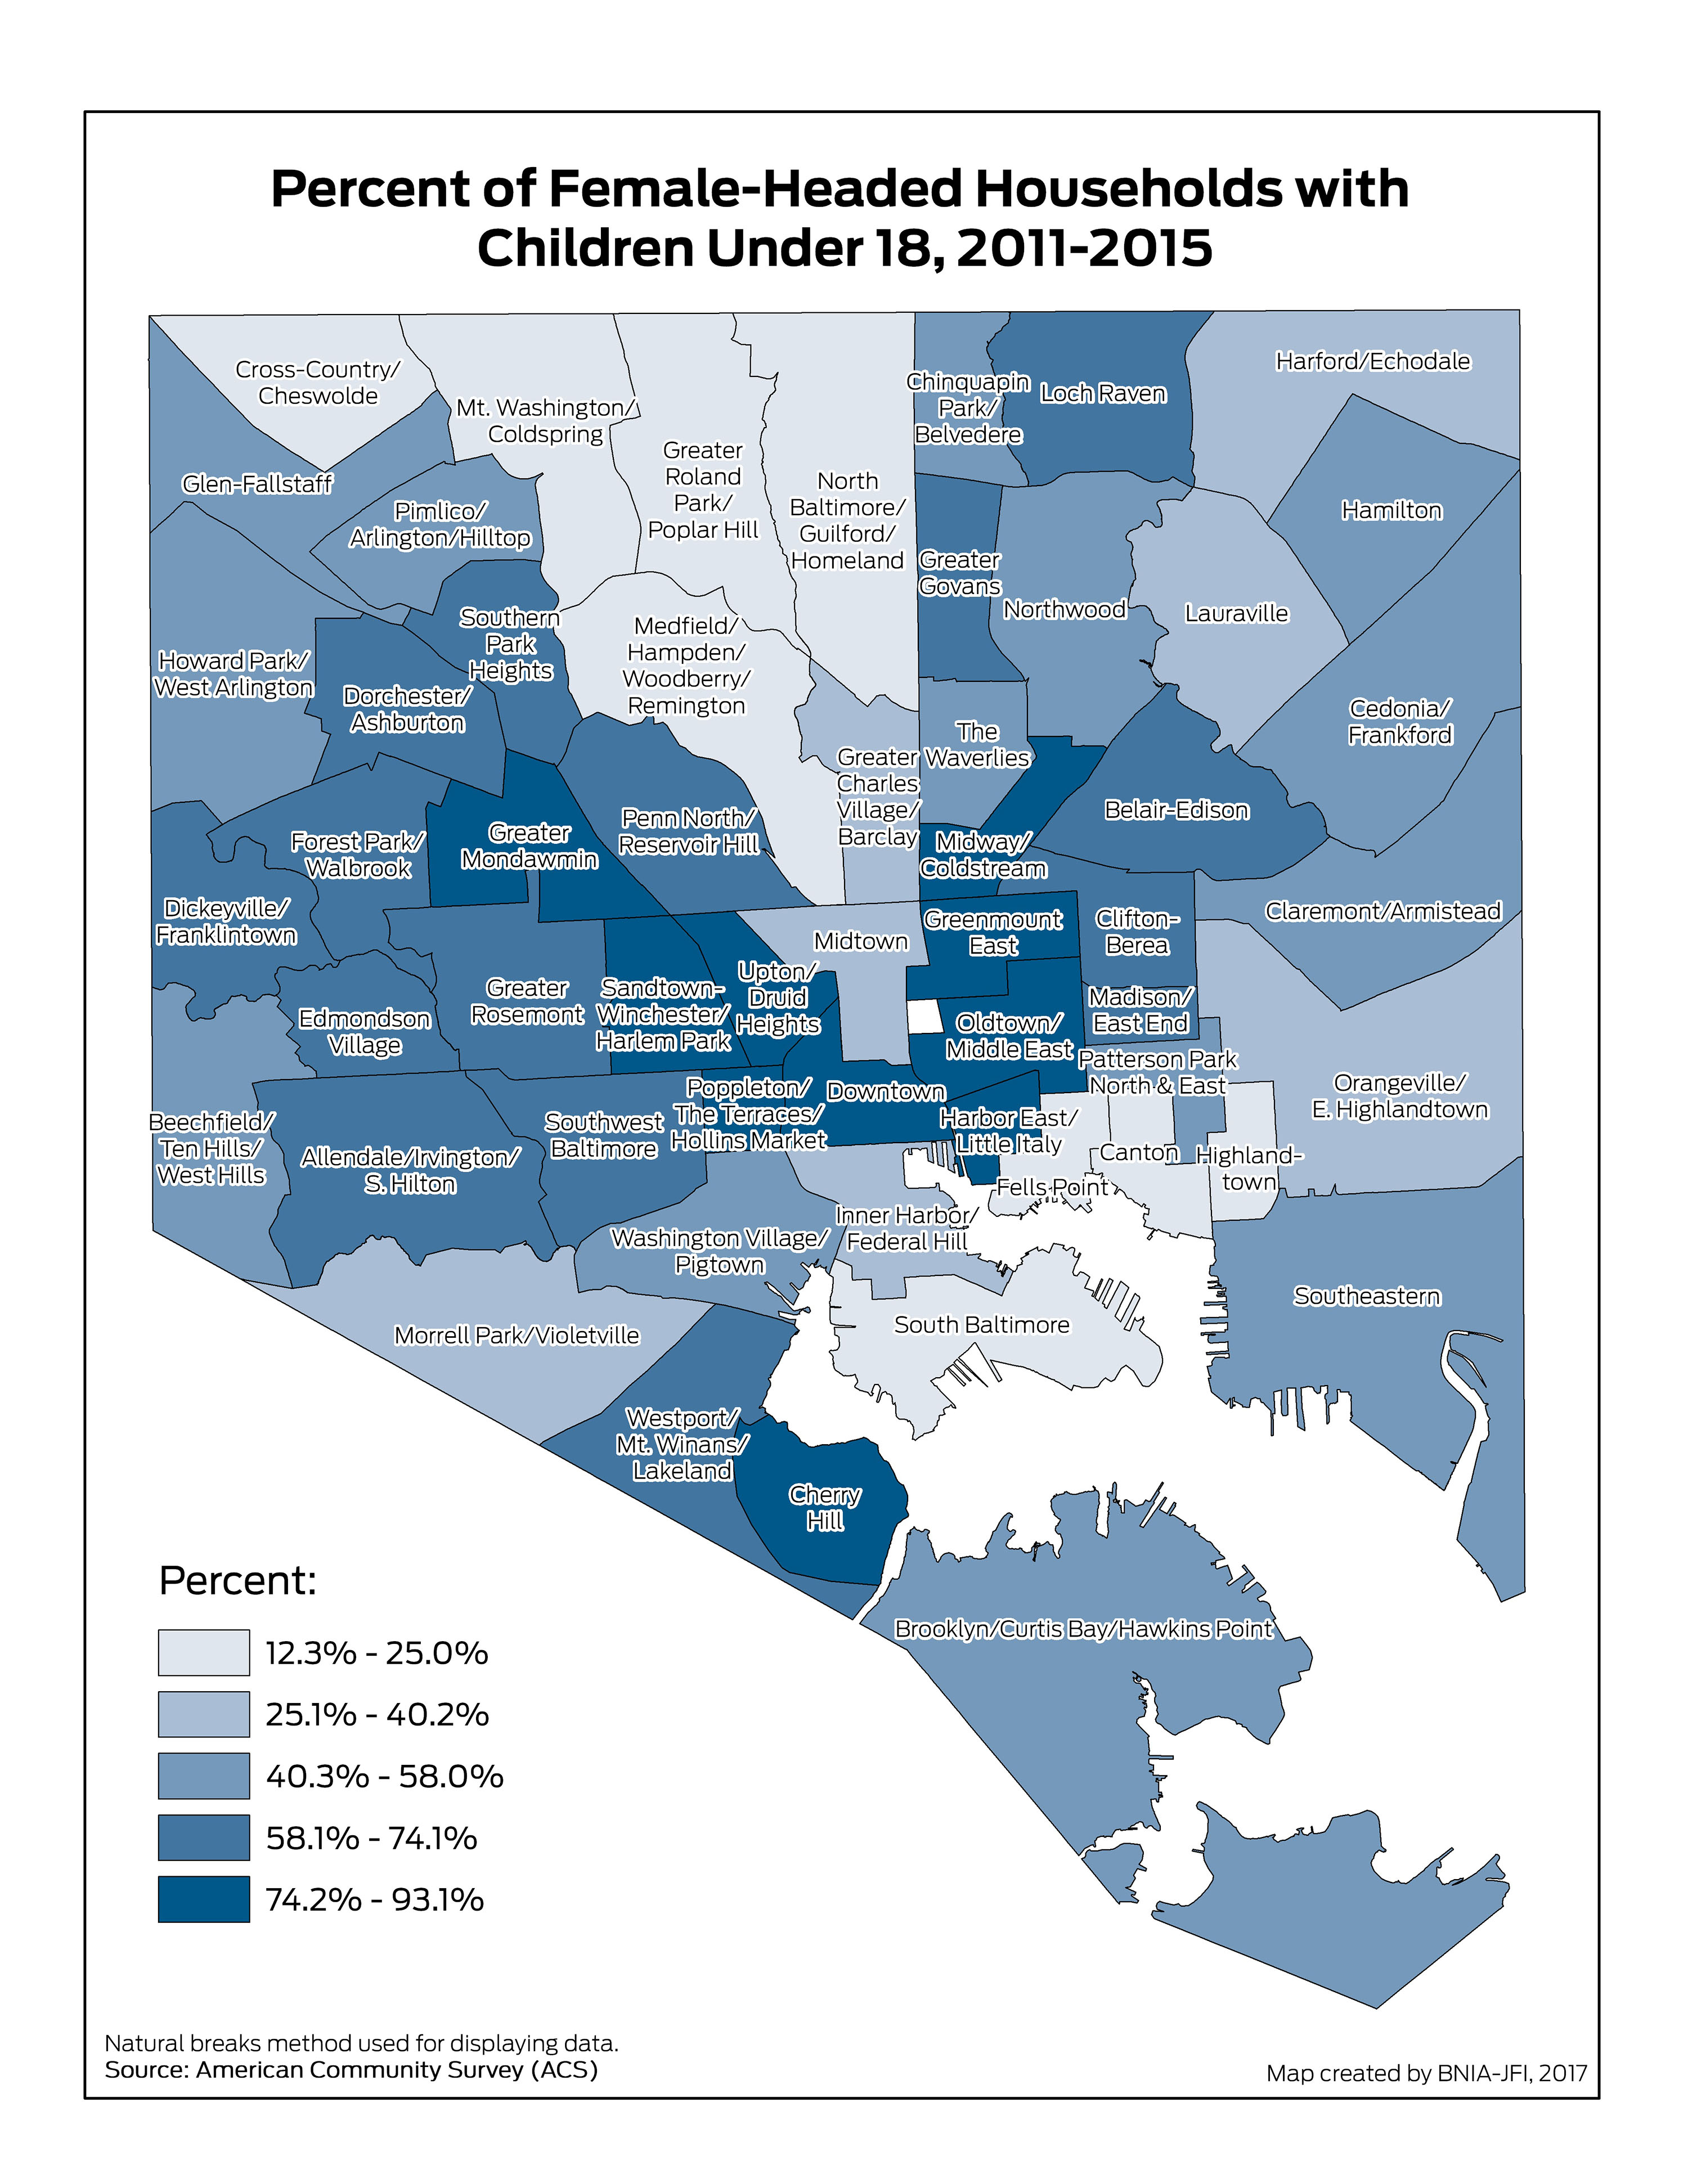
Percent of Female-Headed Households with Children Under 18
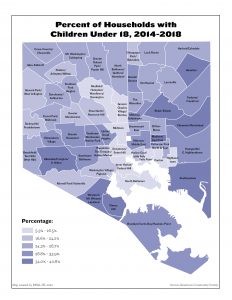
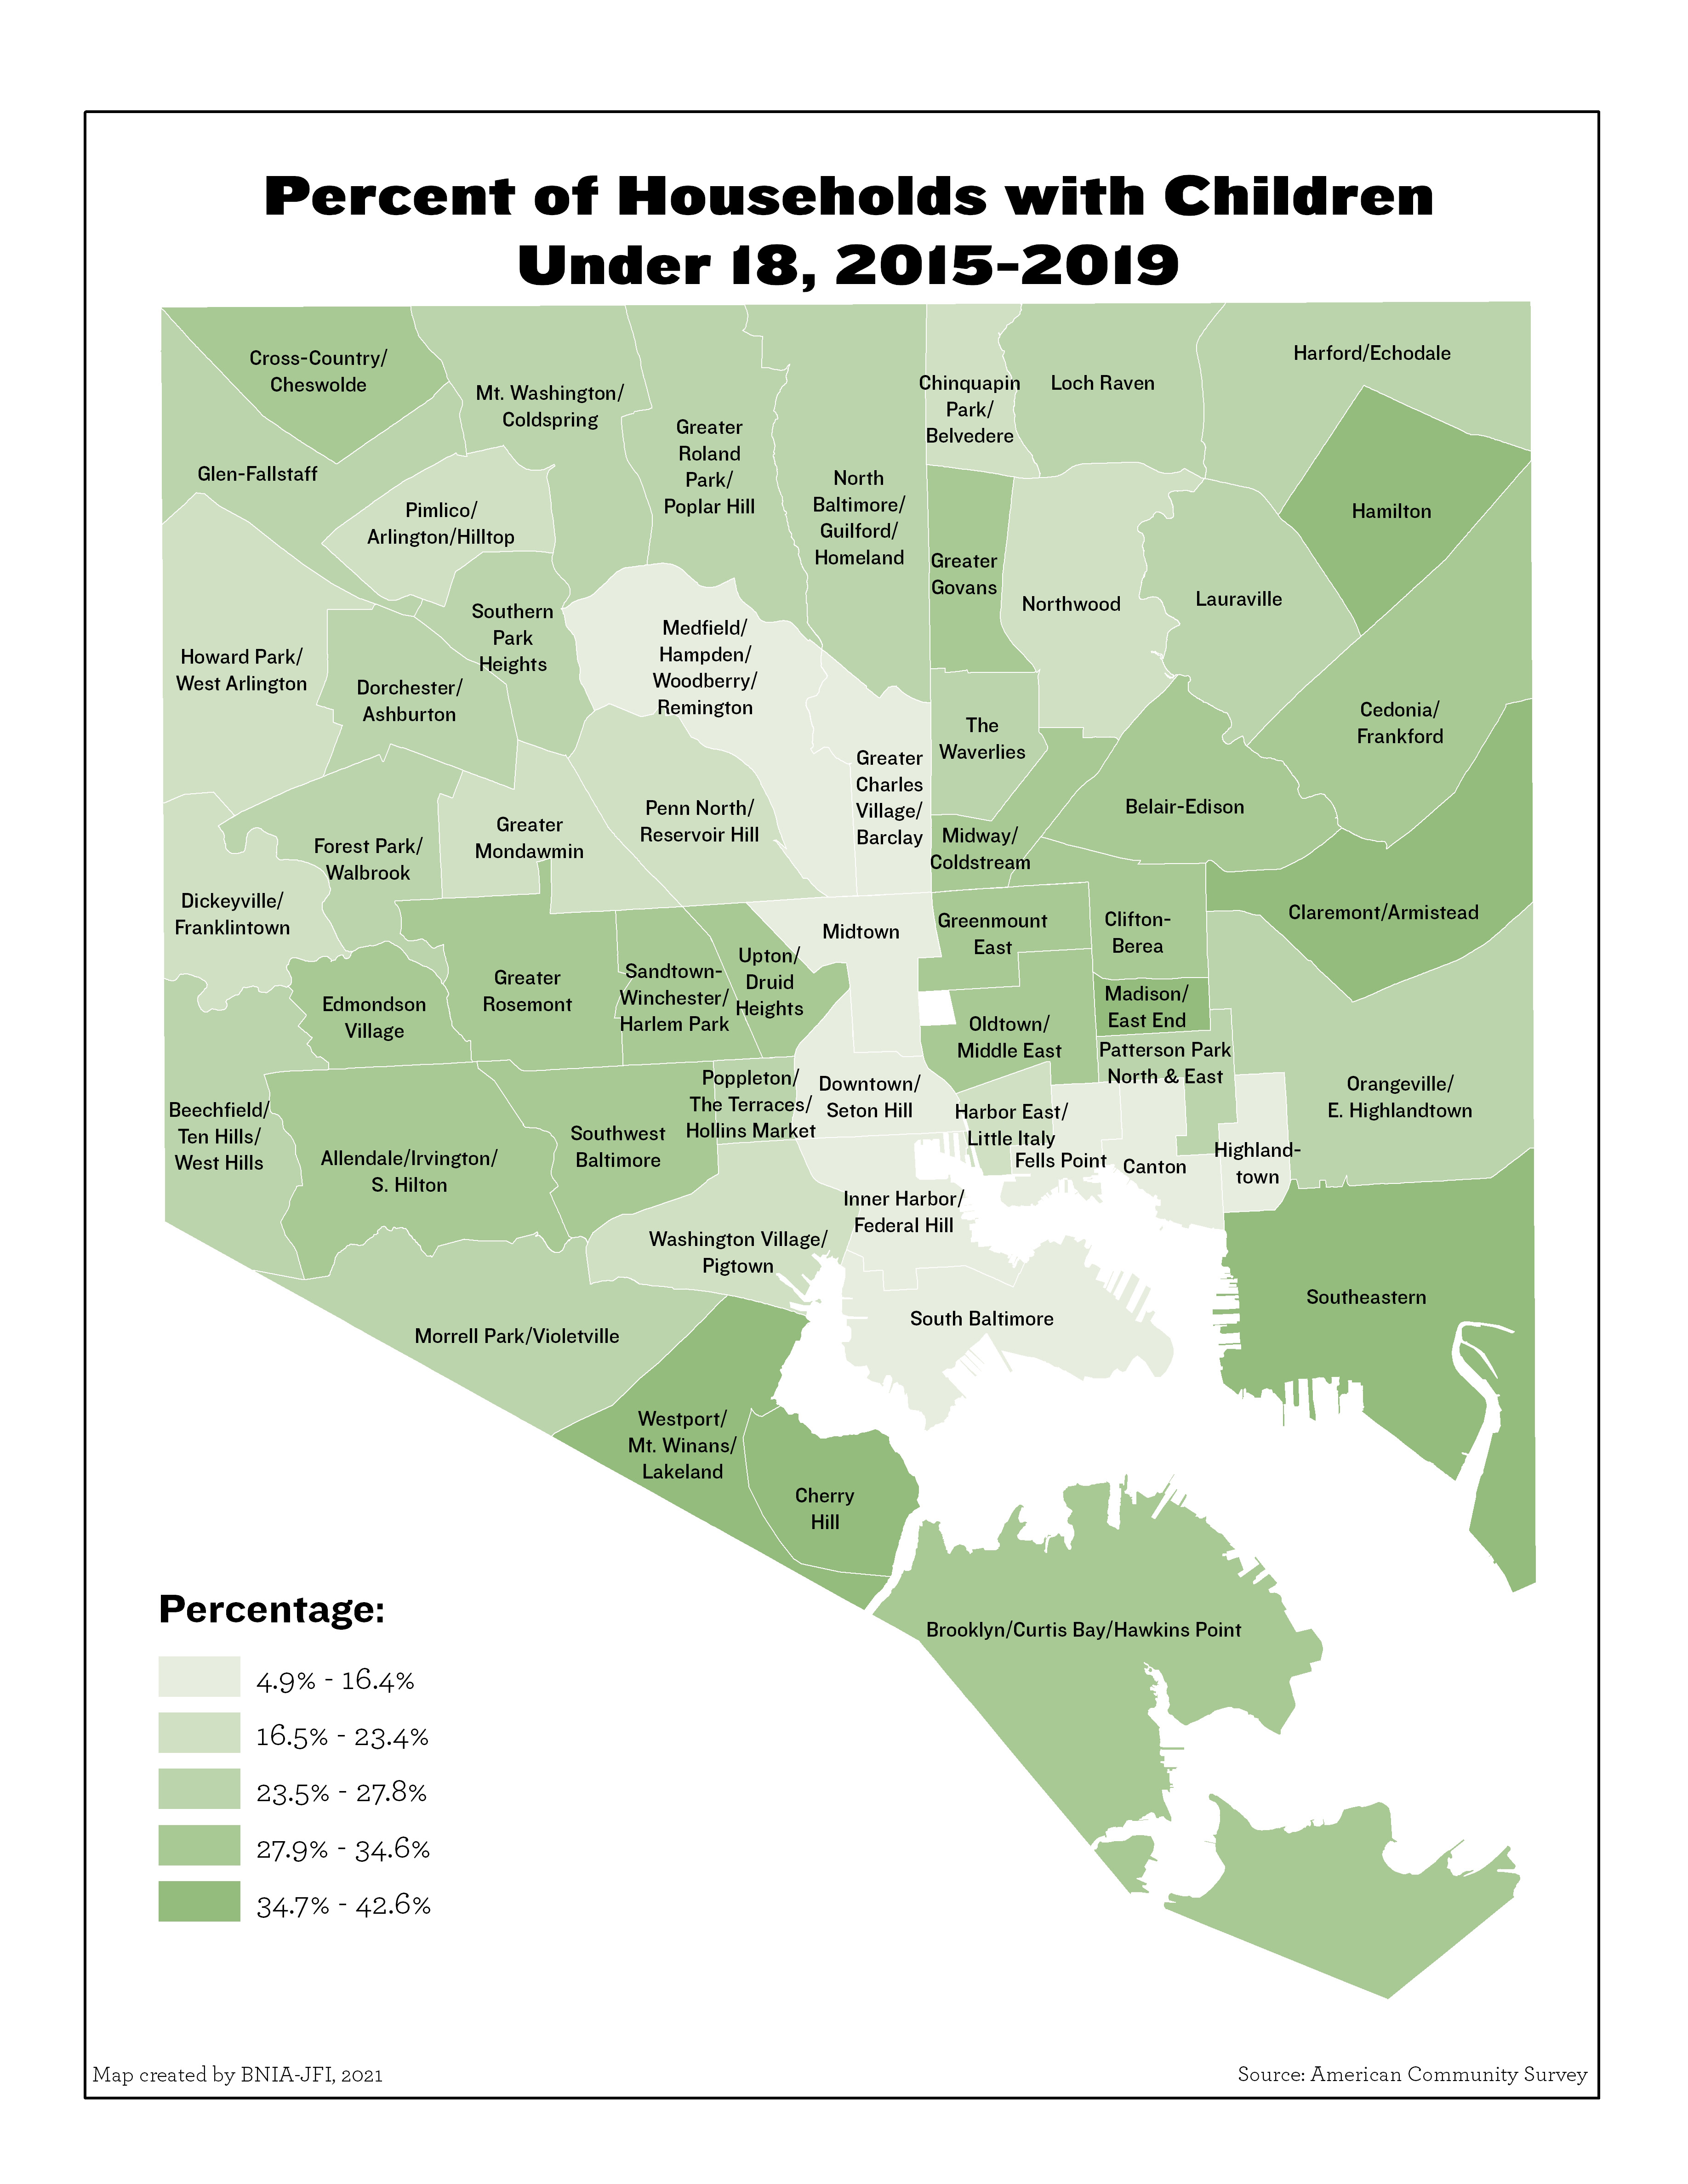
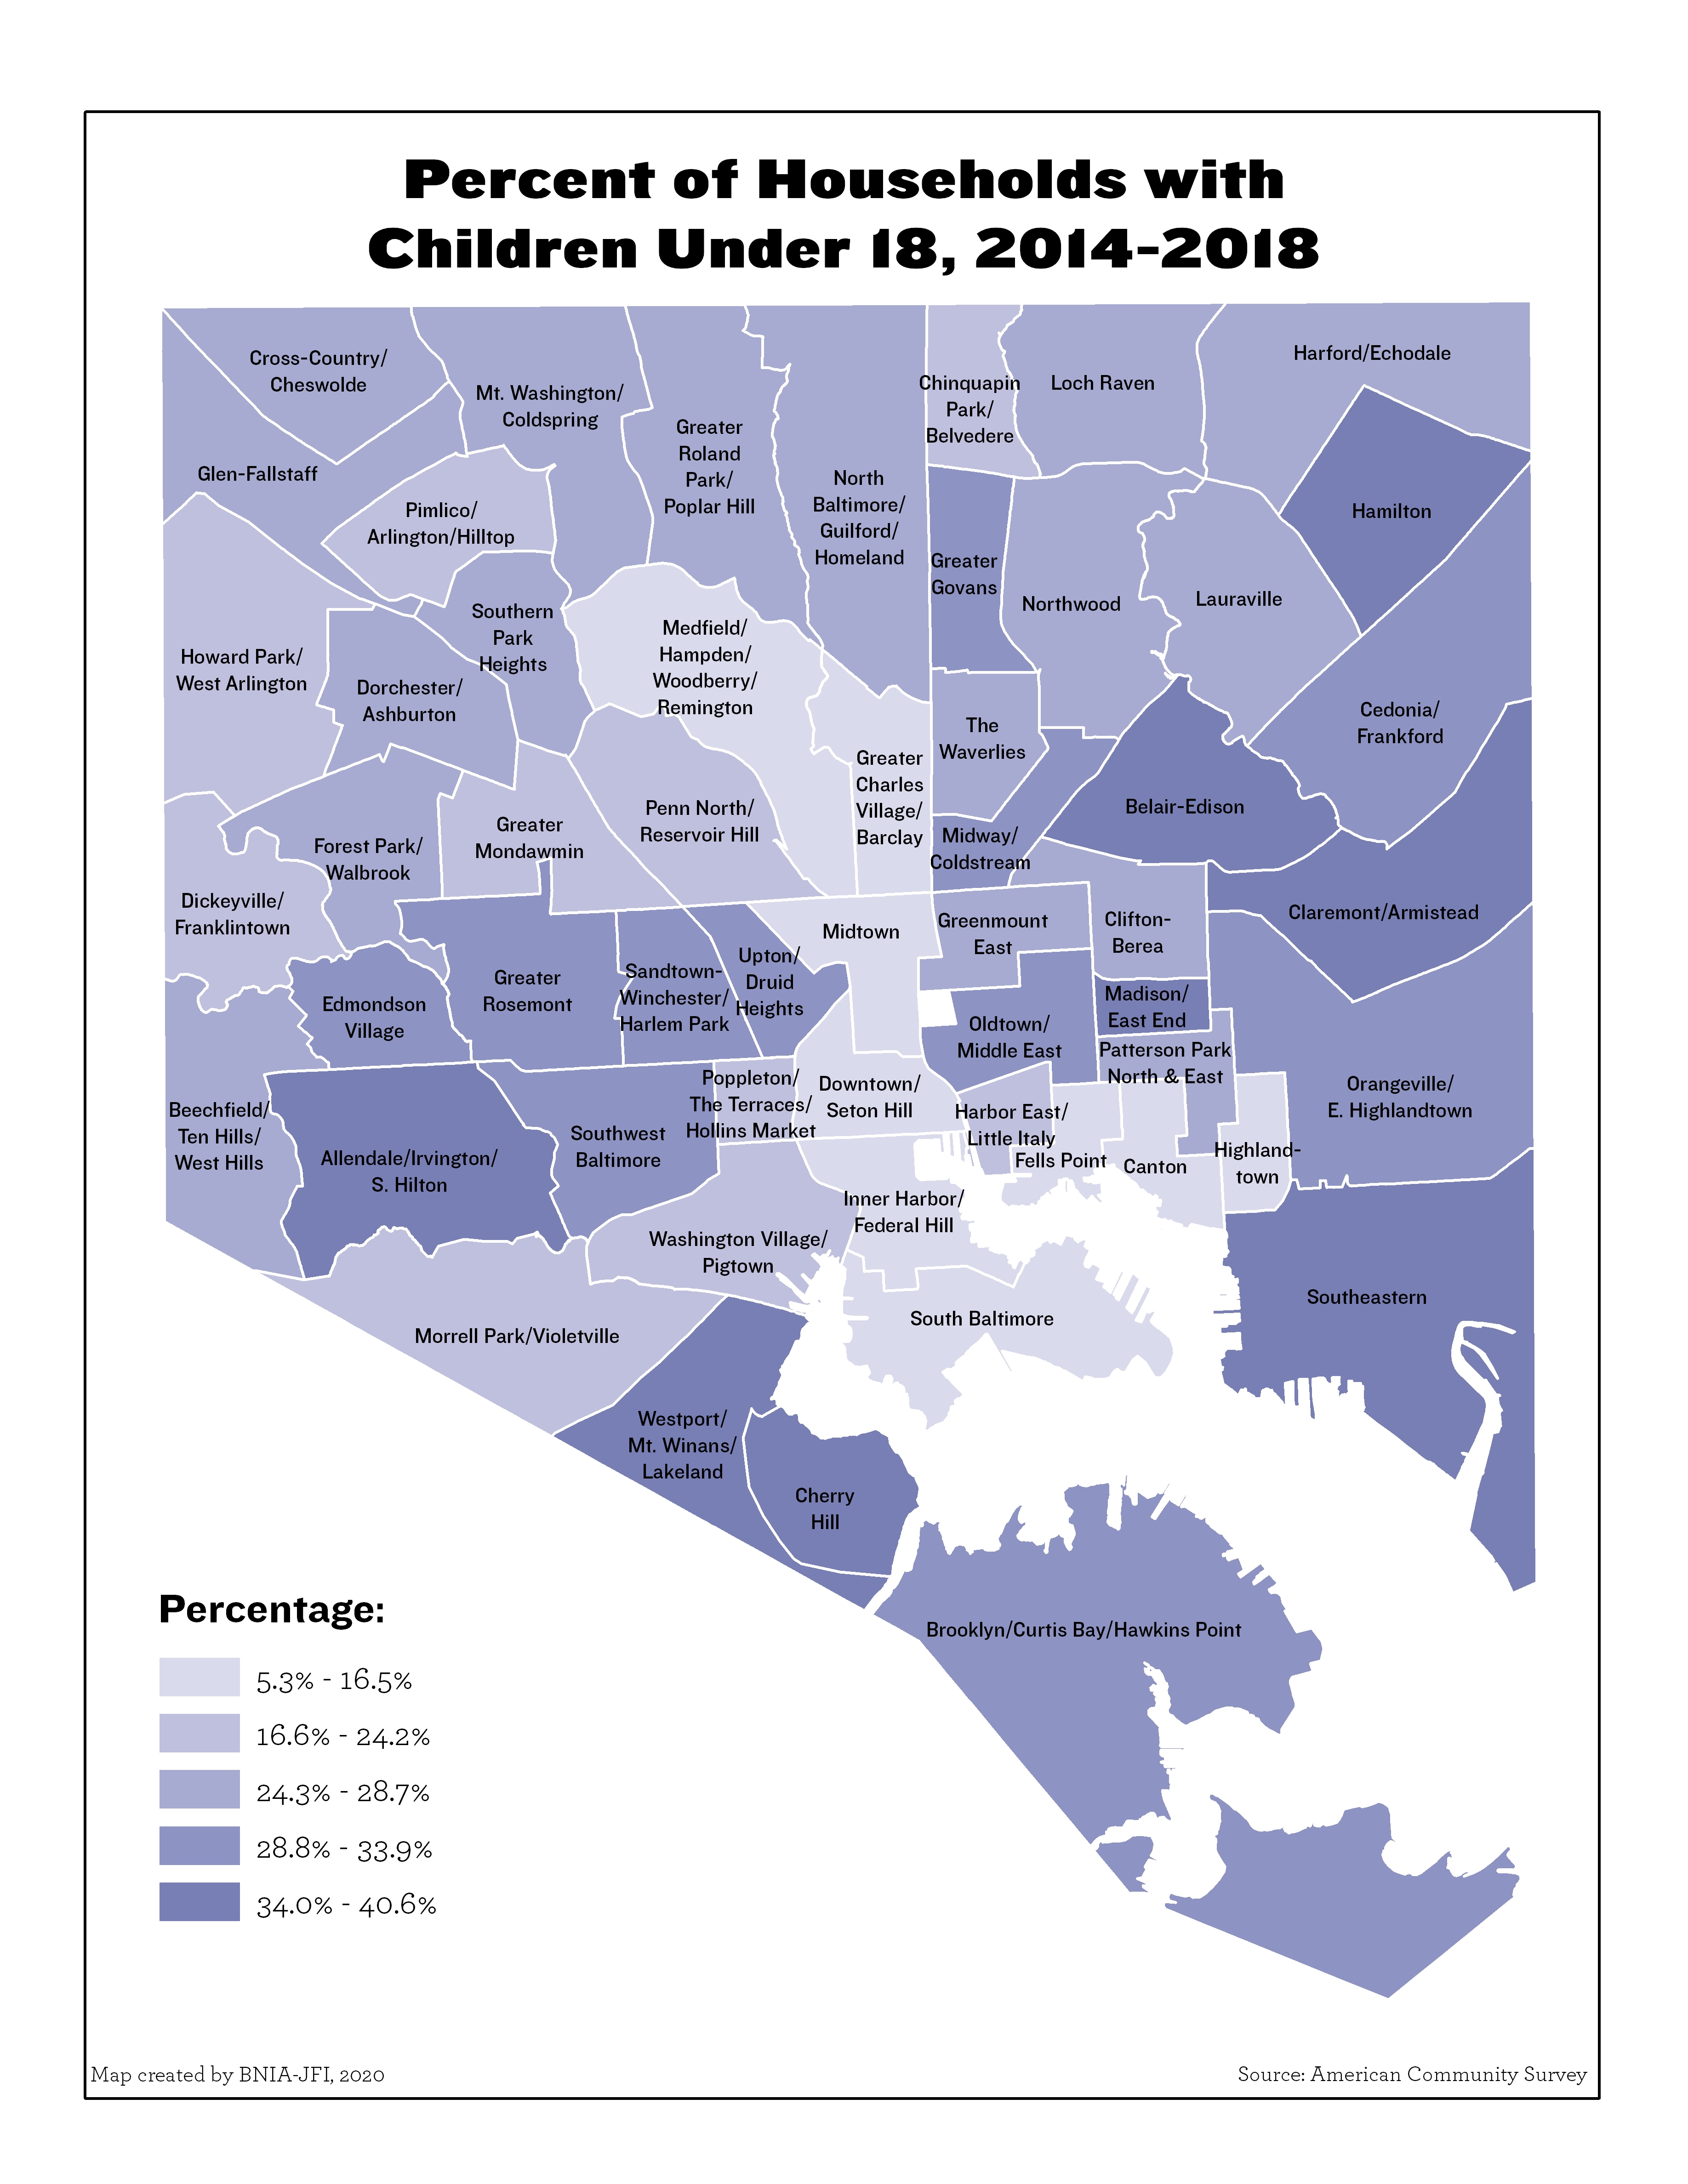
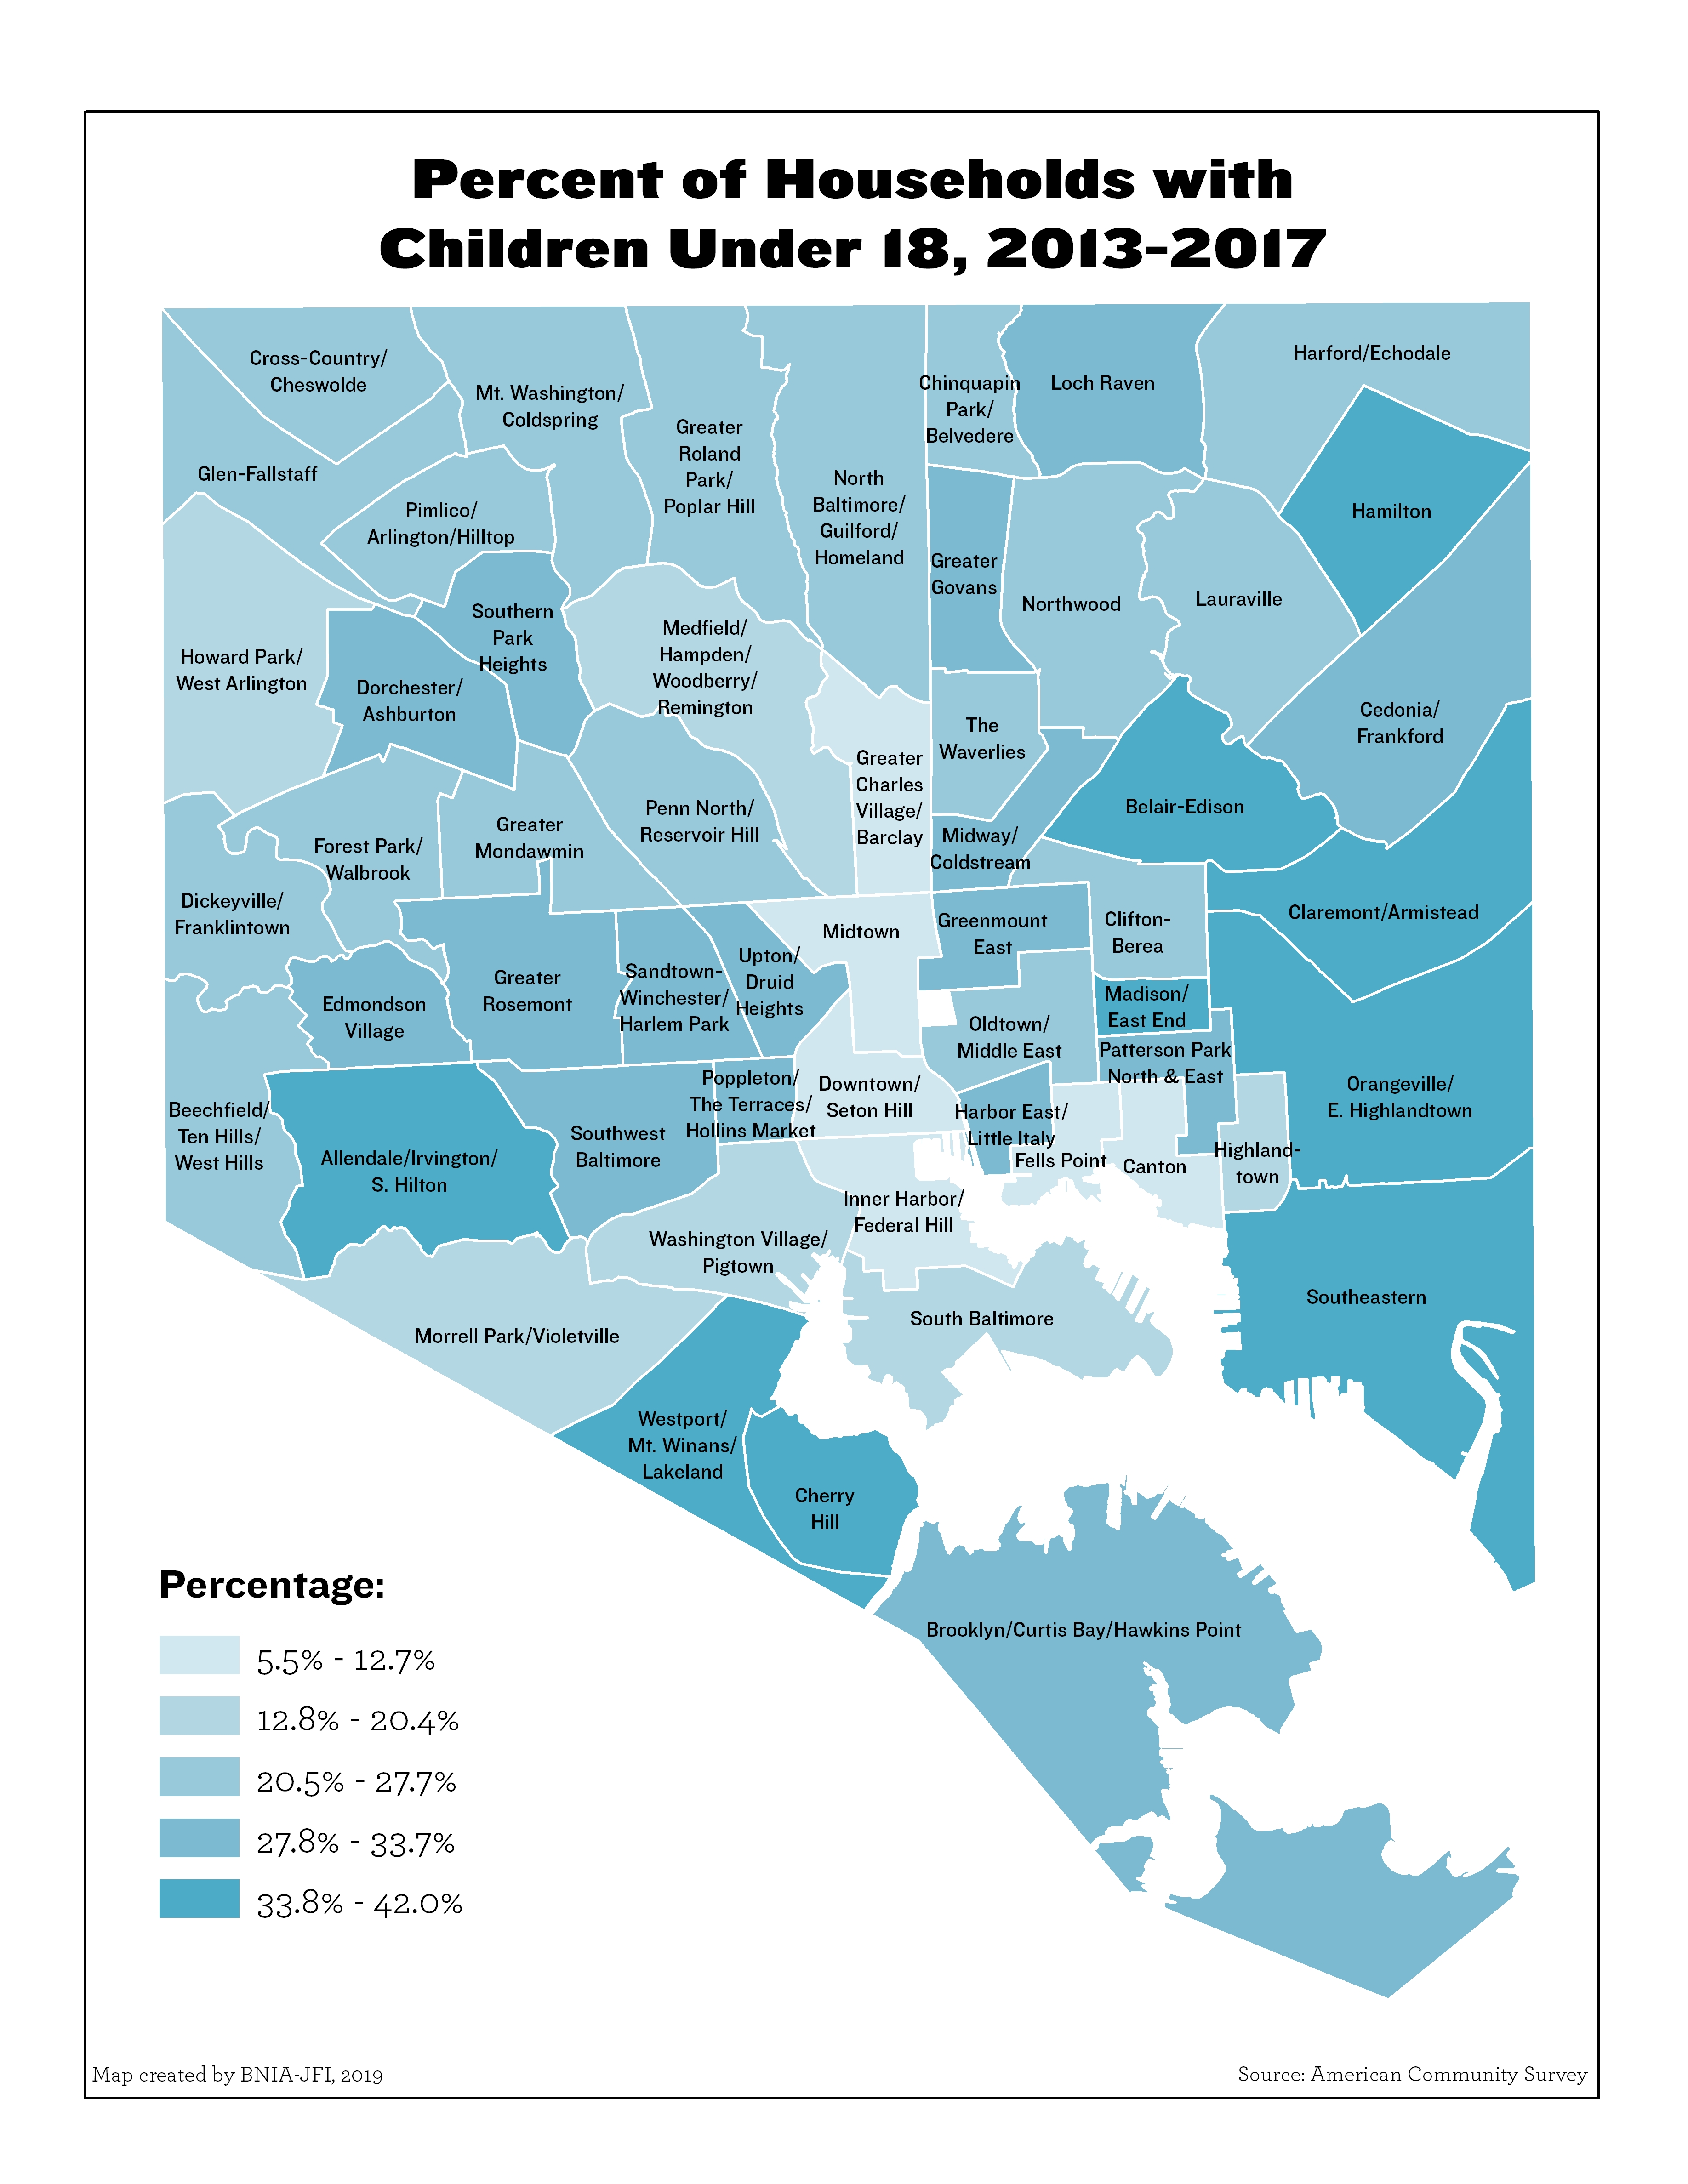
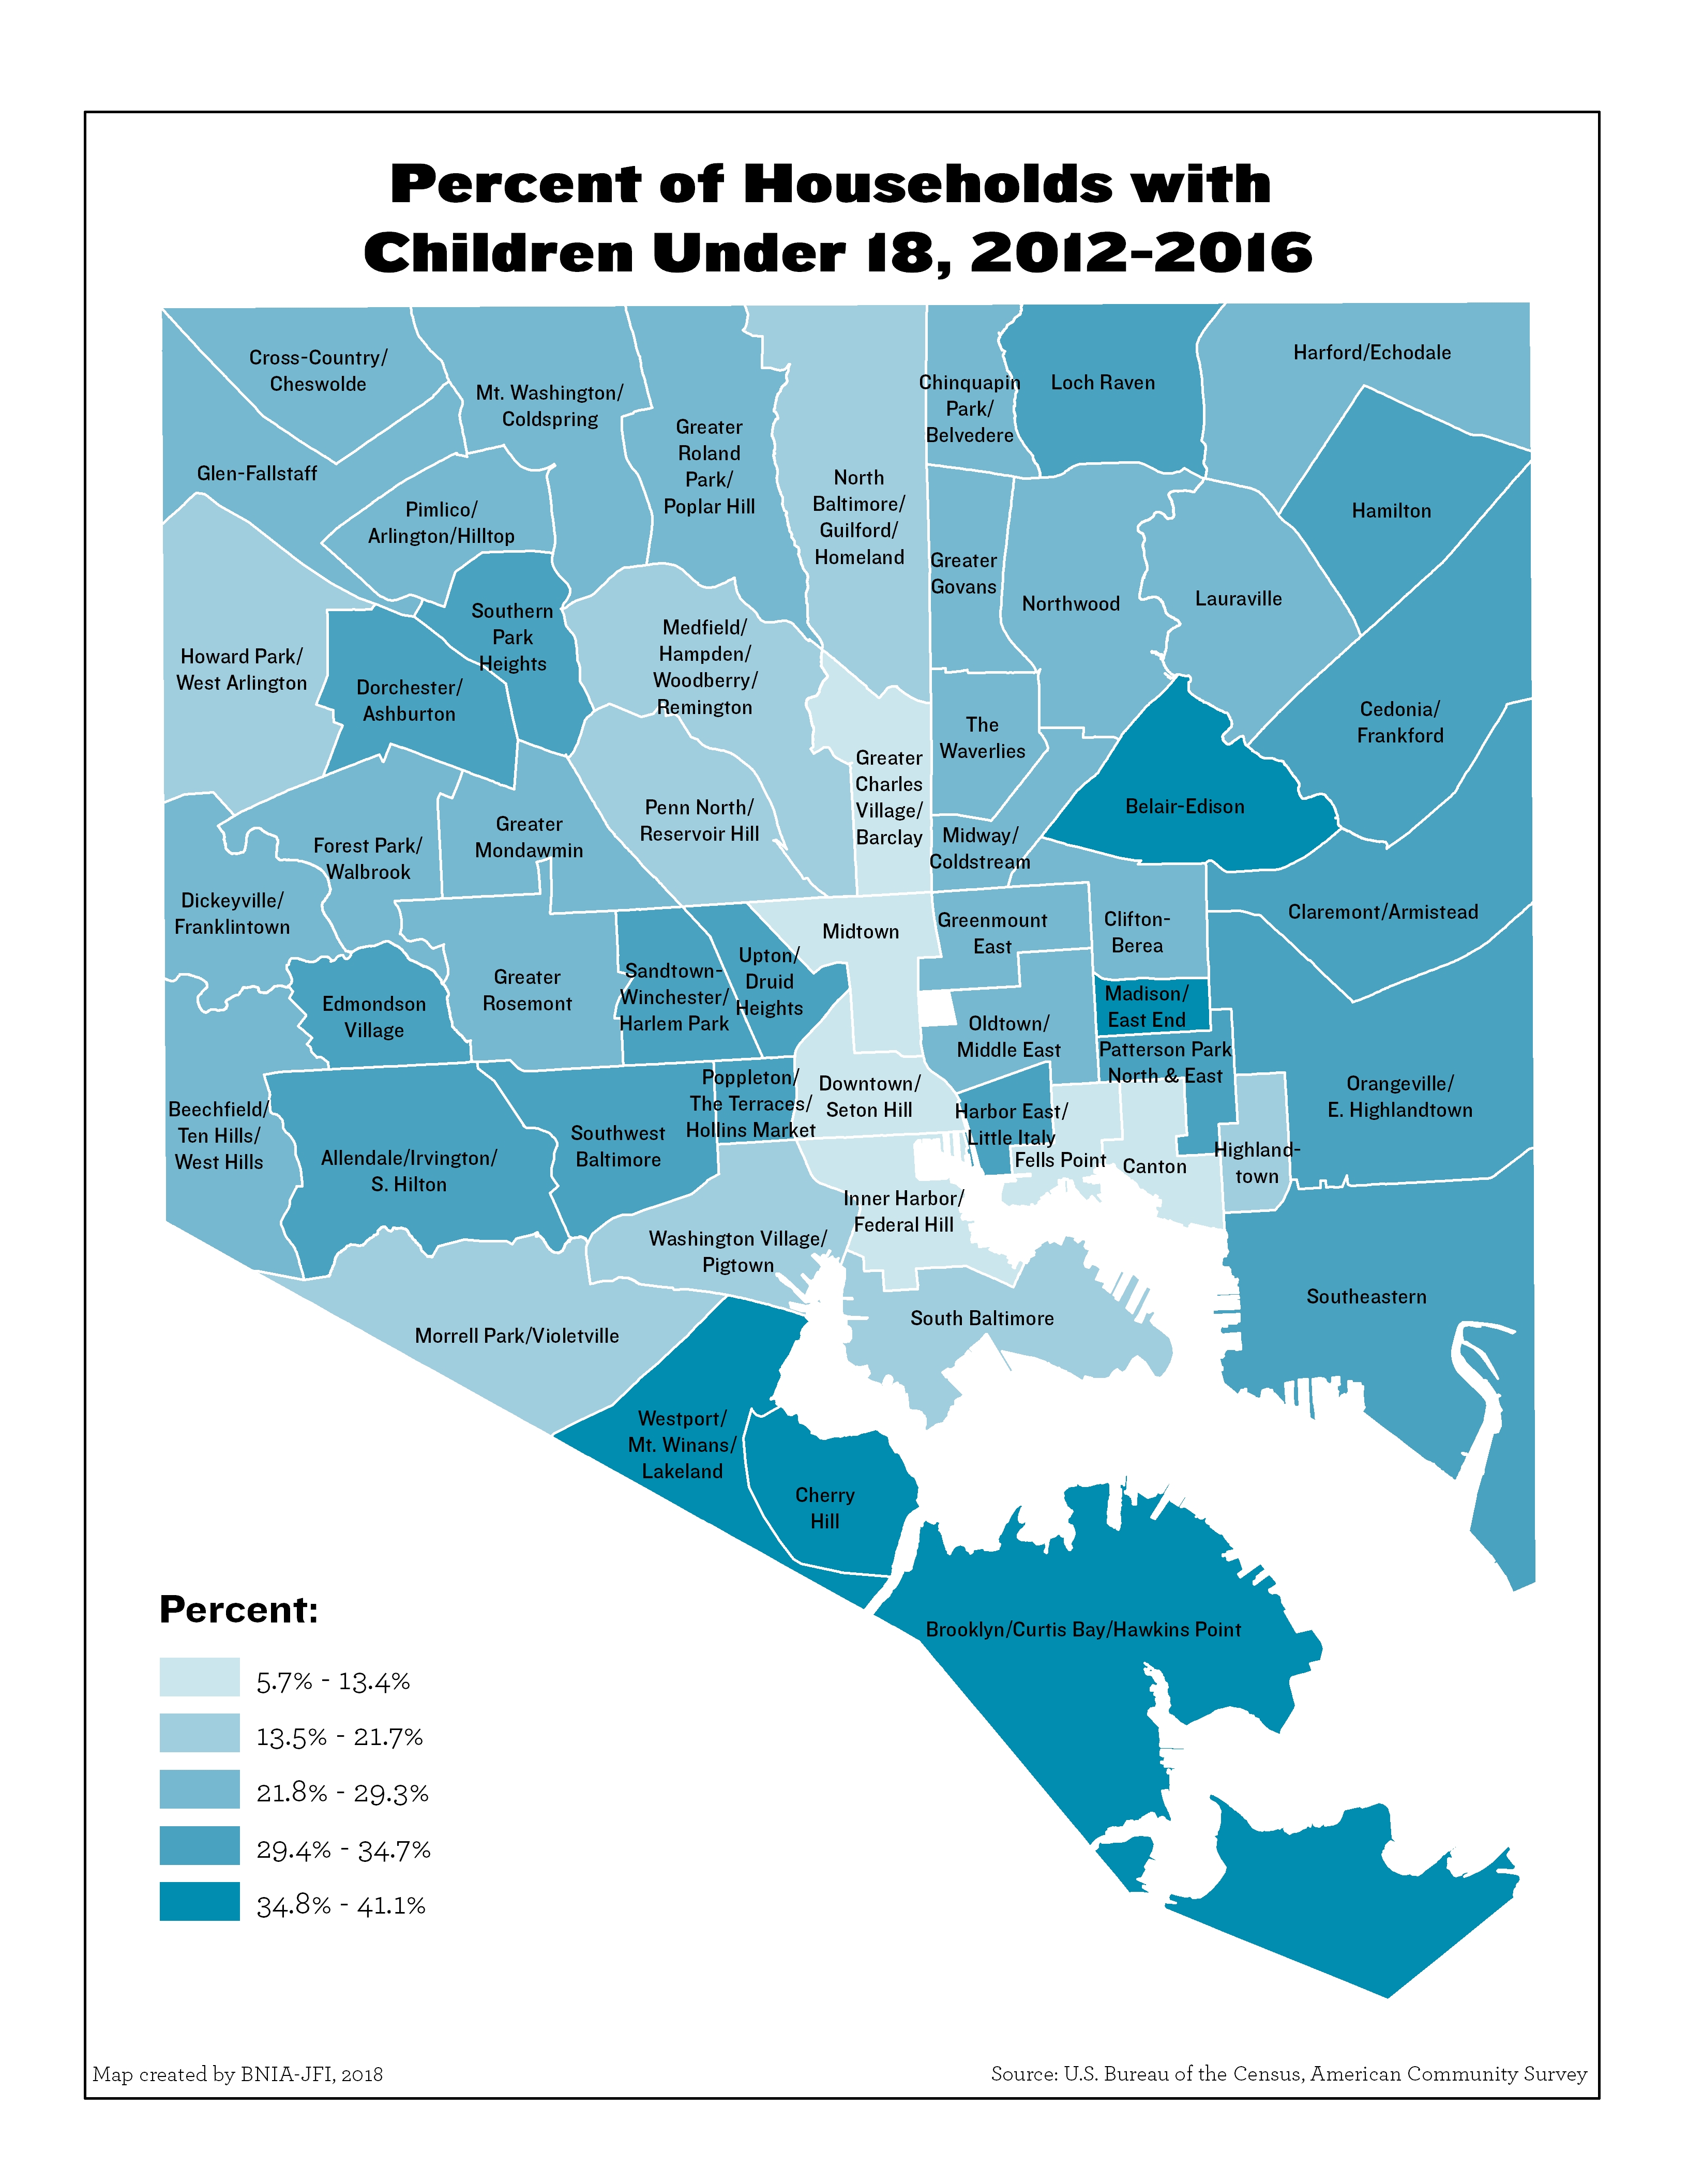
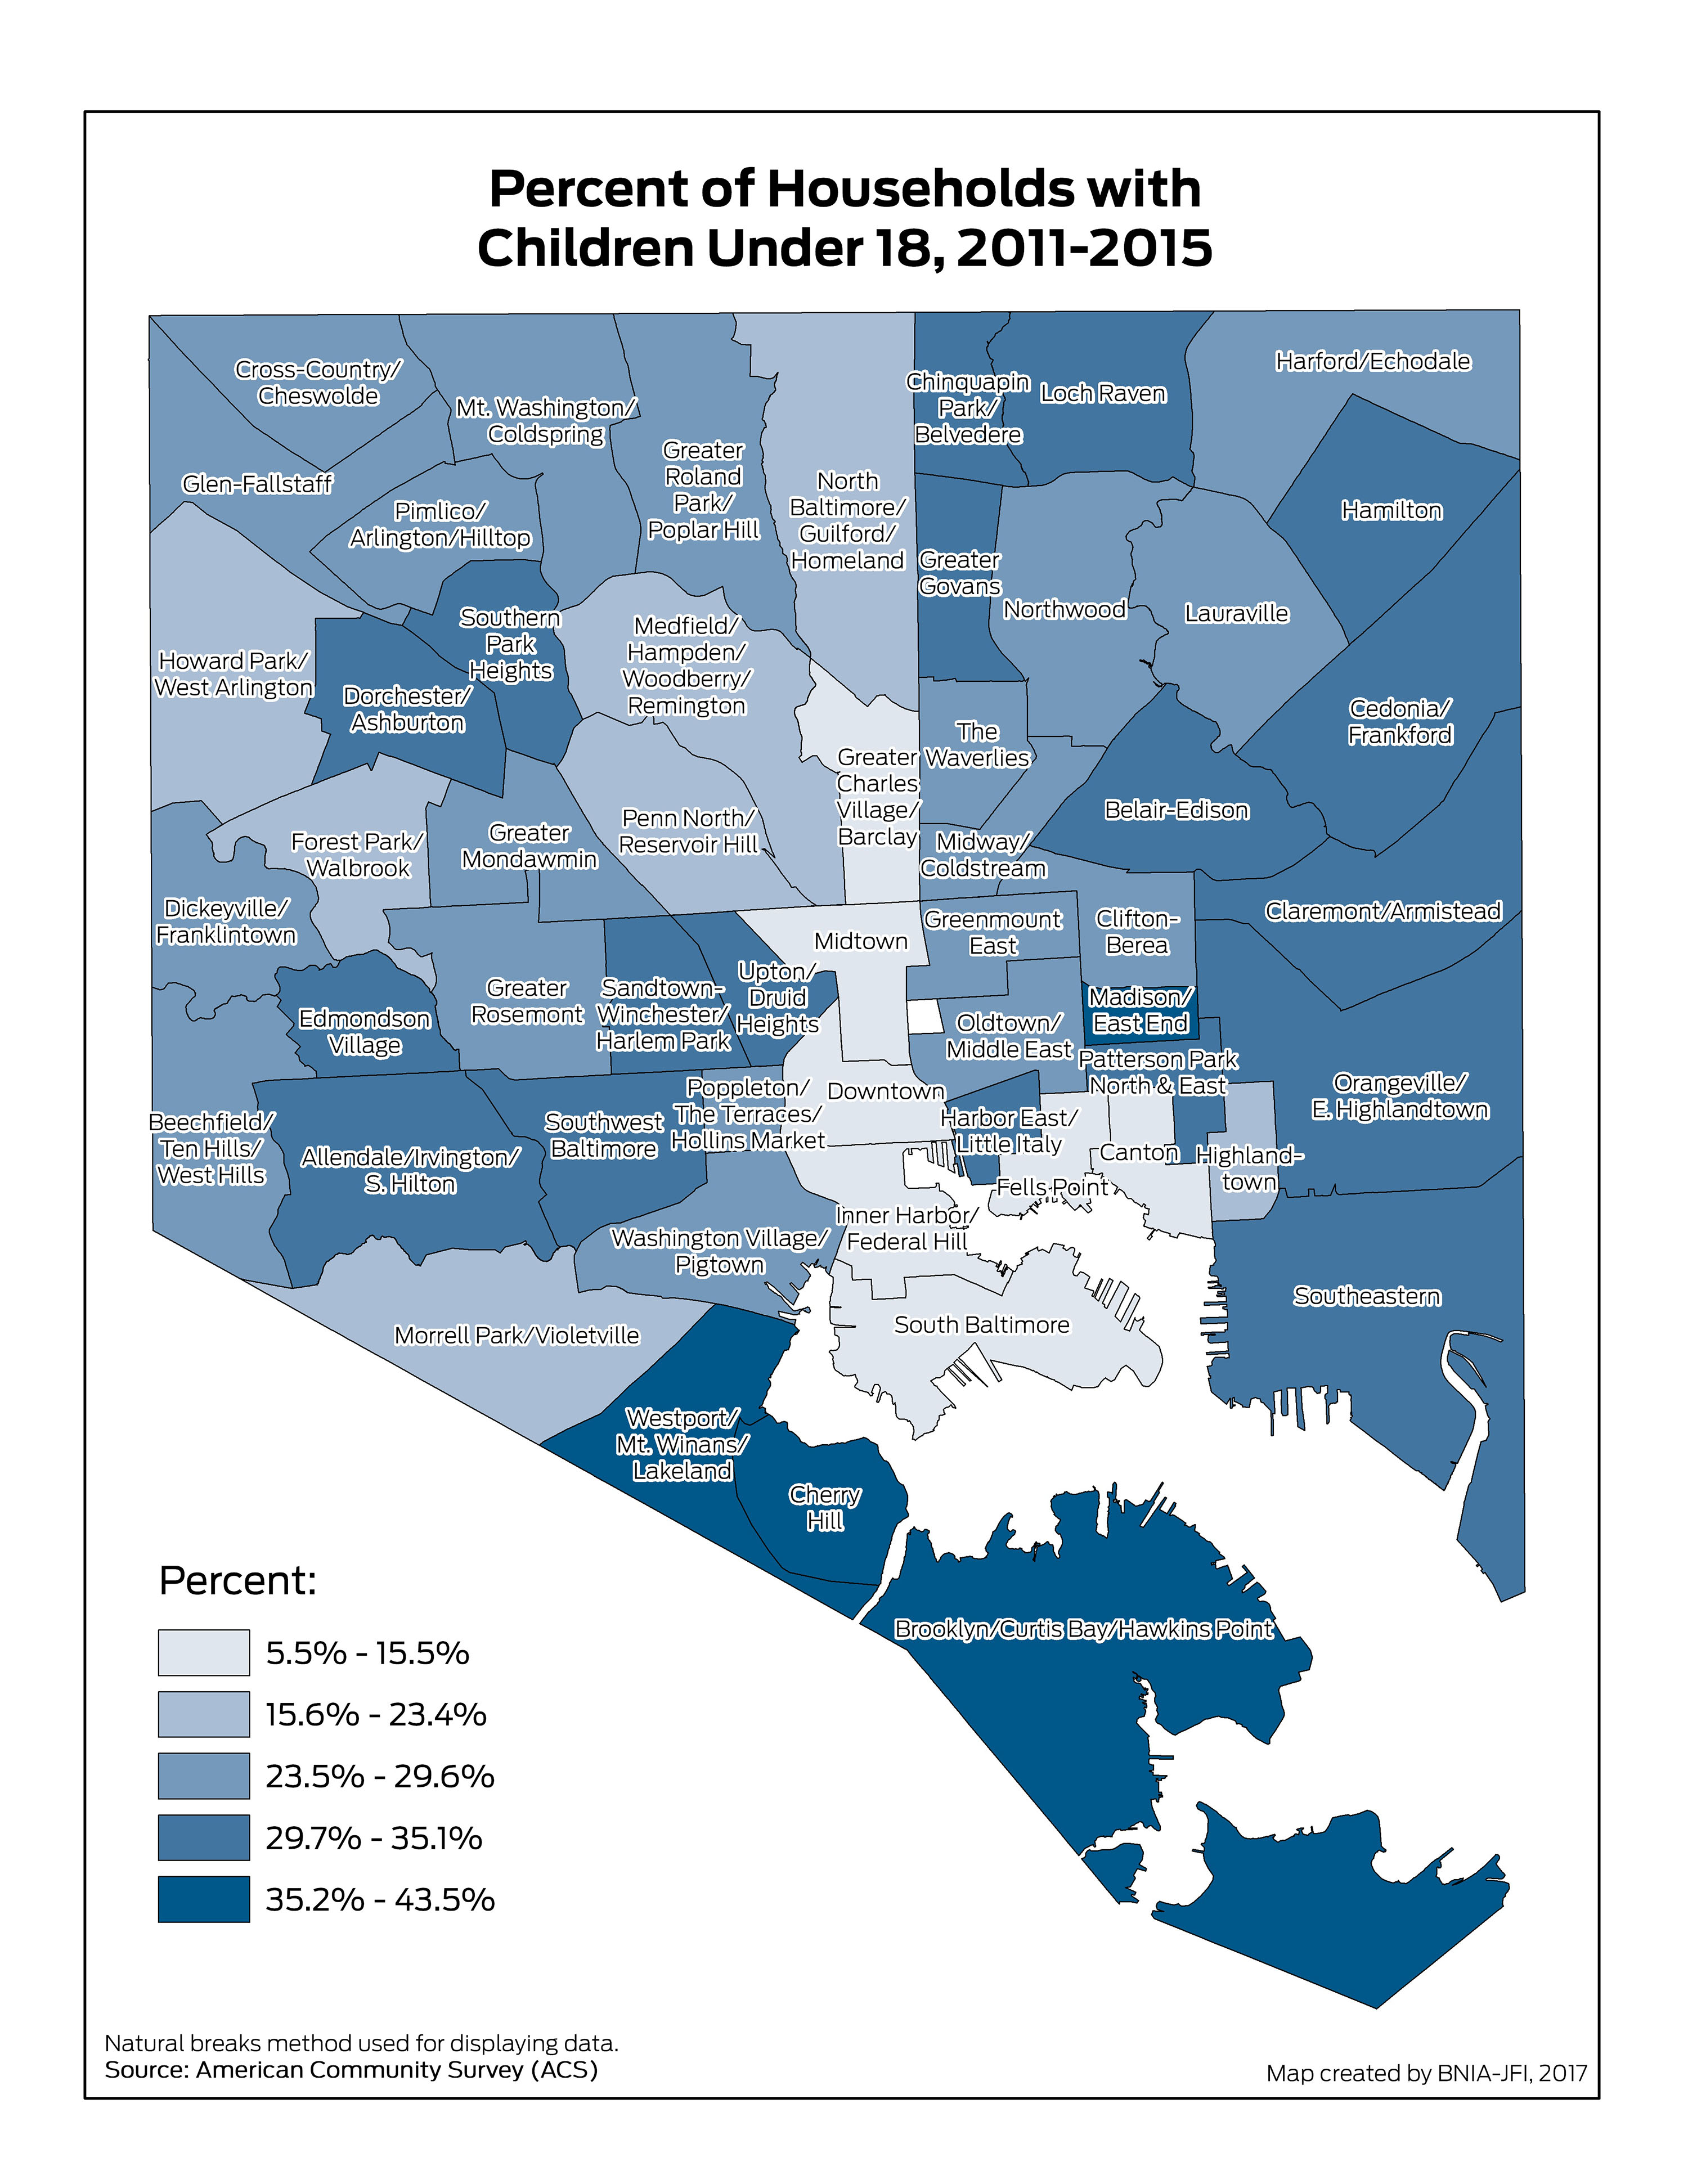
Percent of Households with Children Under 18
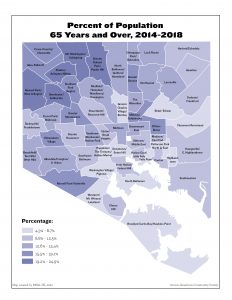
Percent of Population 65 Years and Over
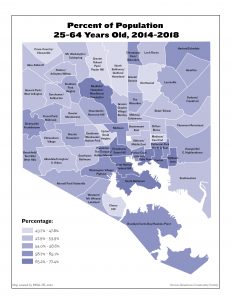
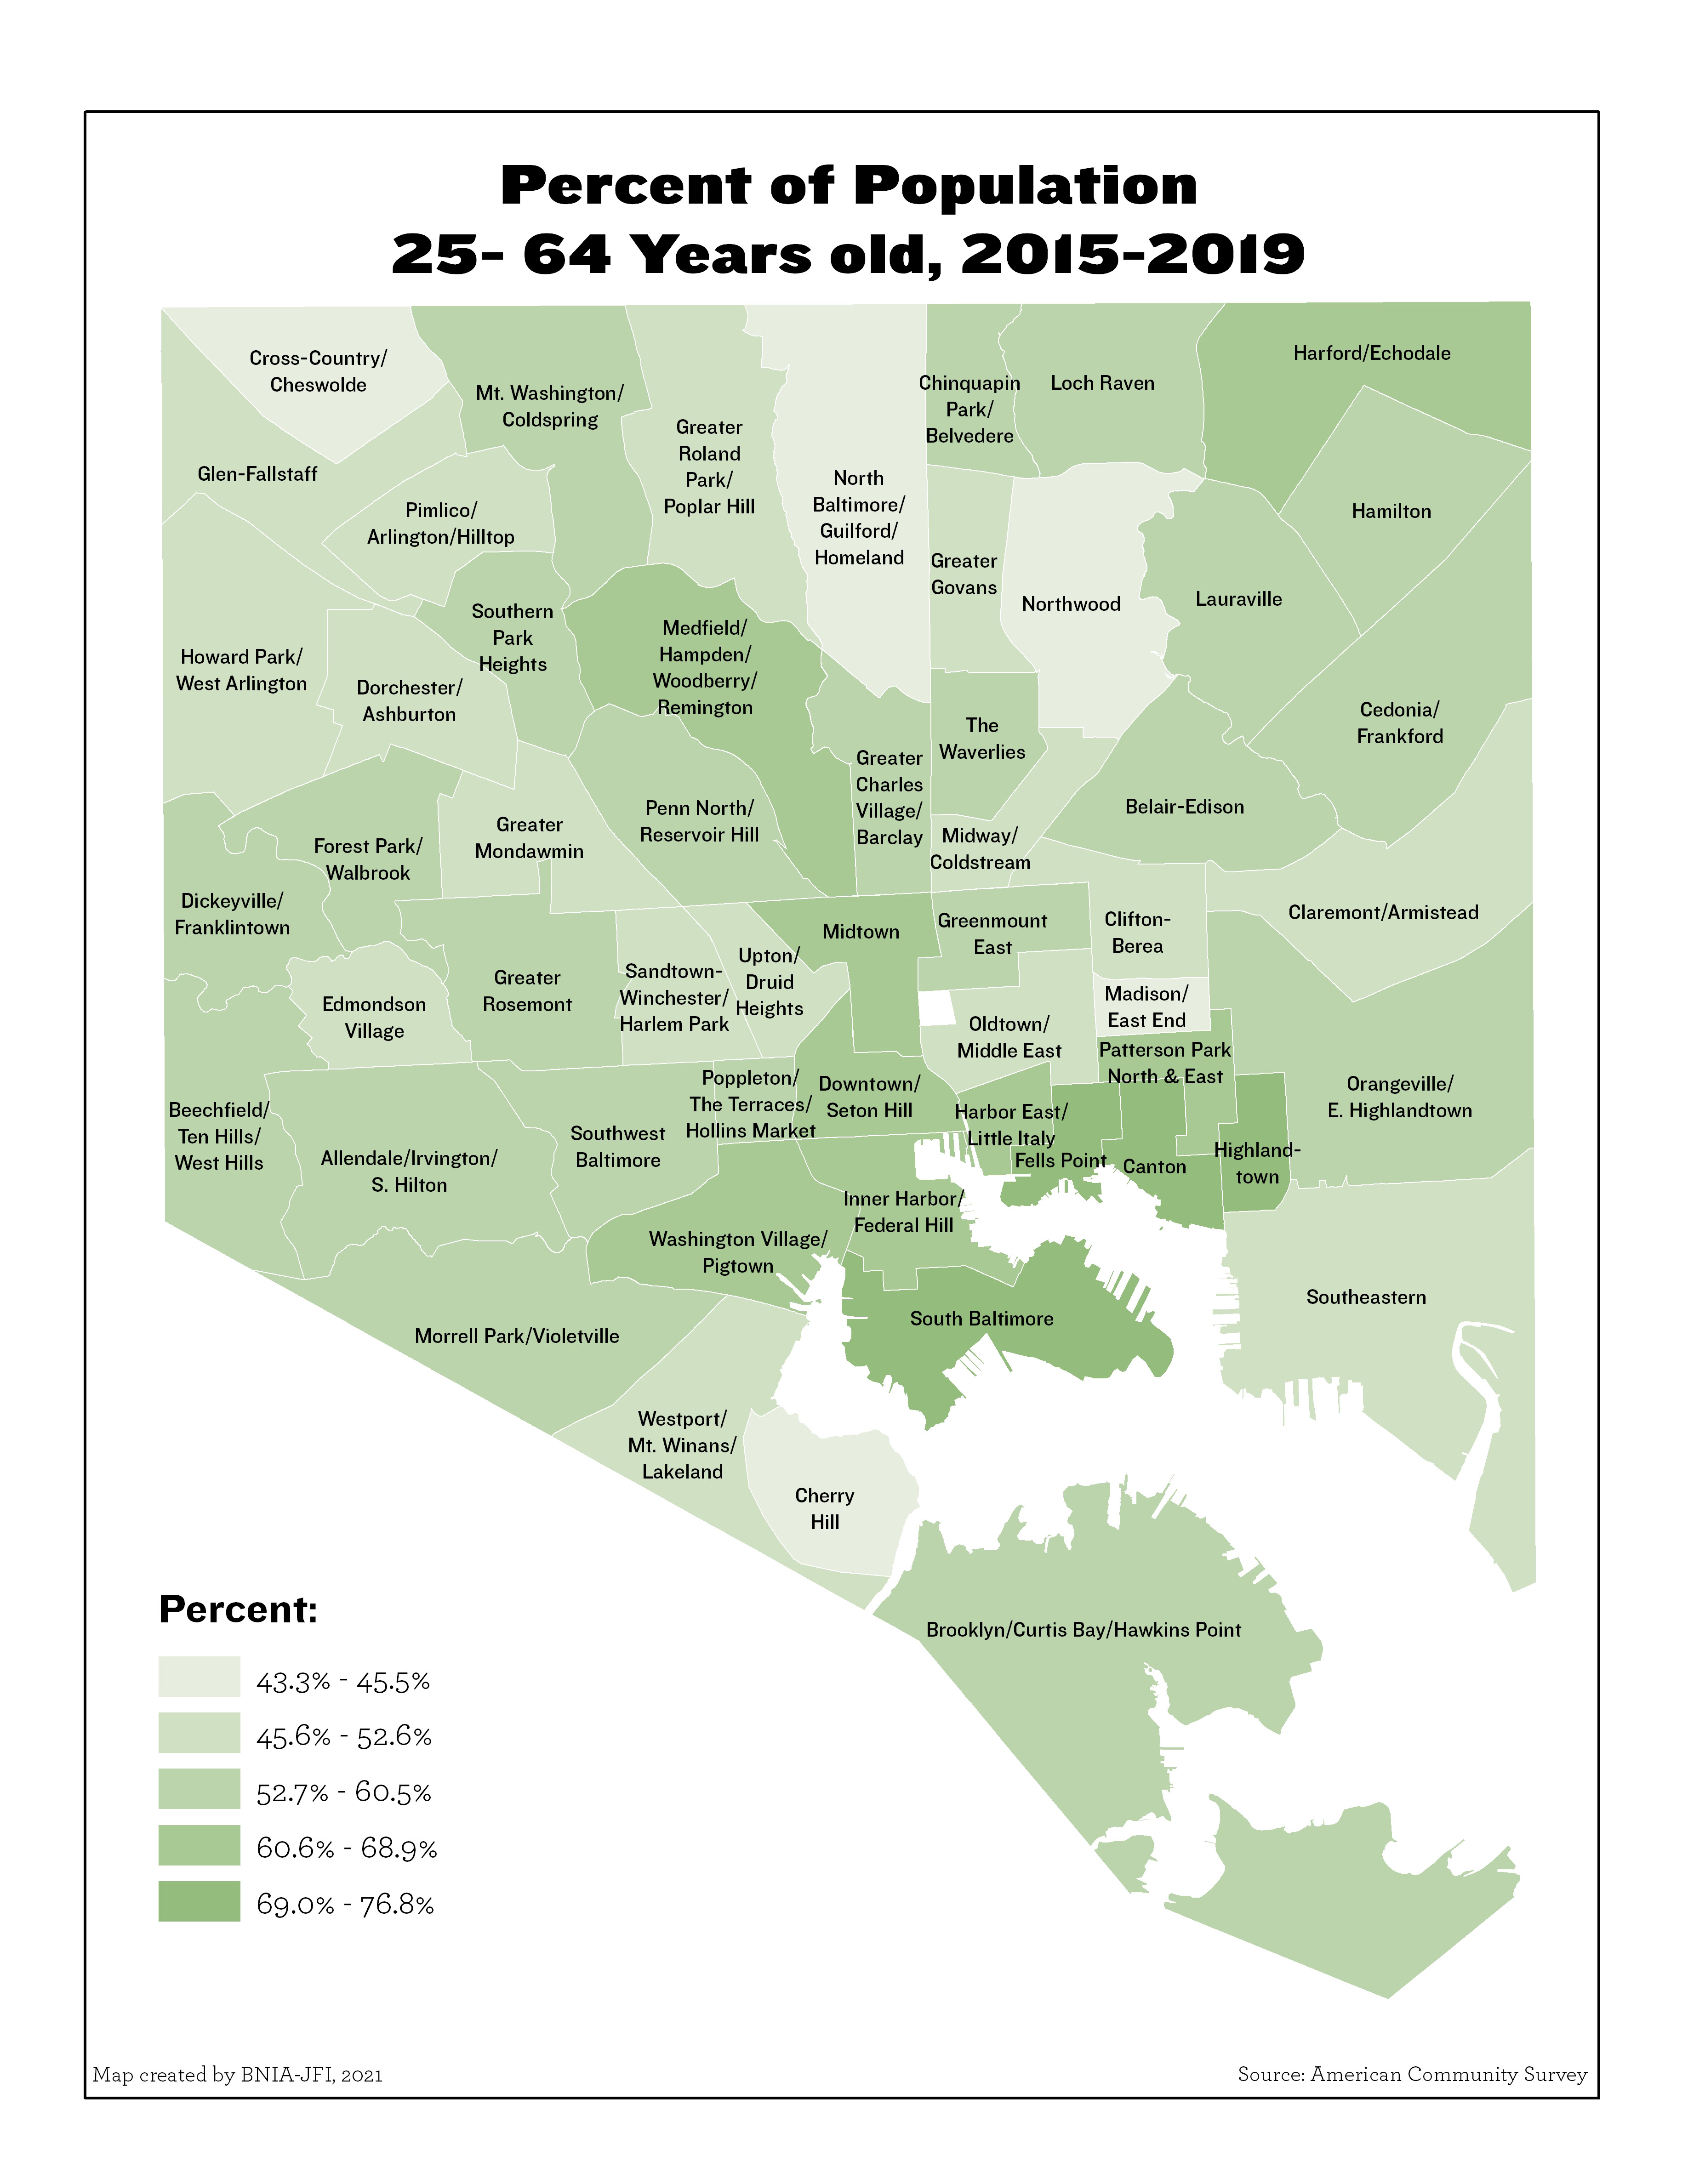
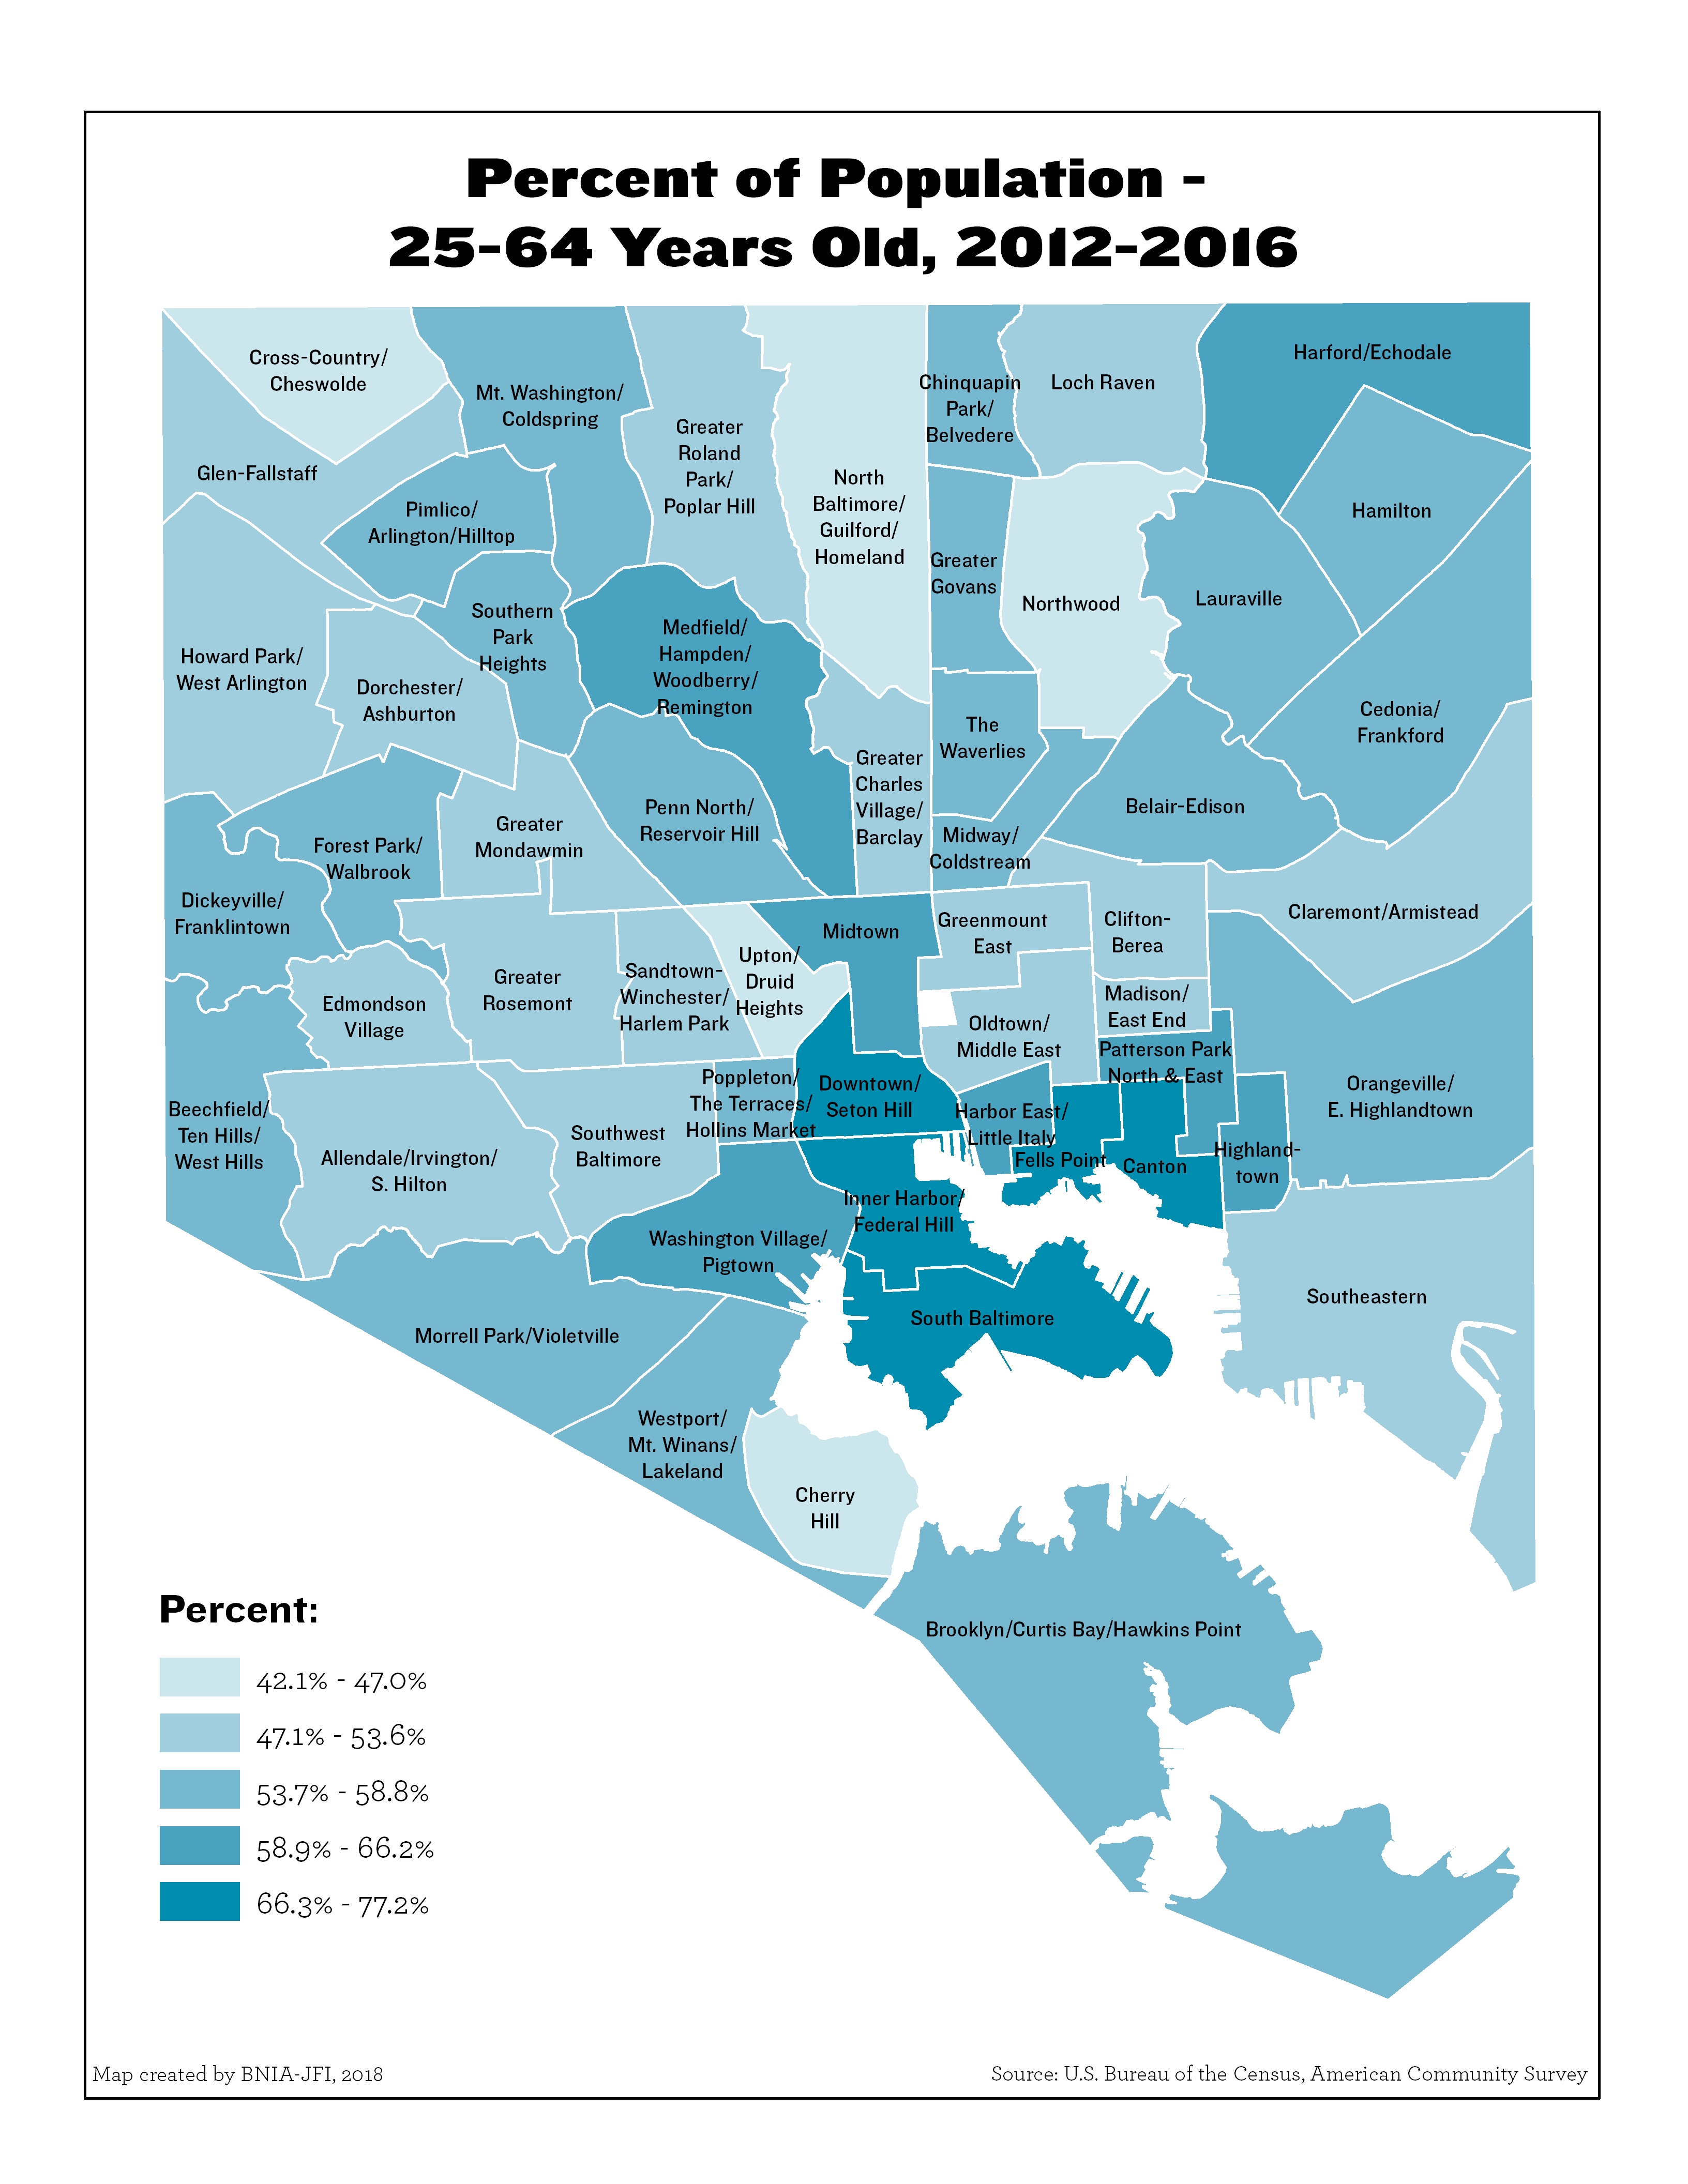
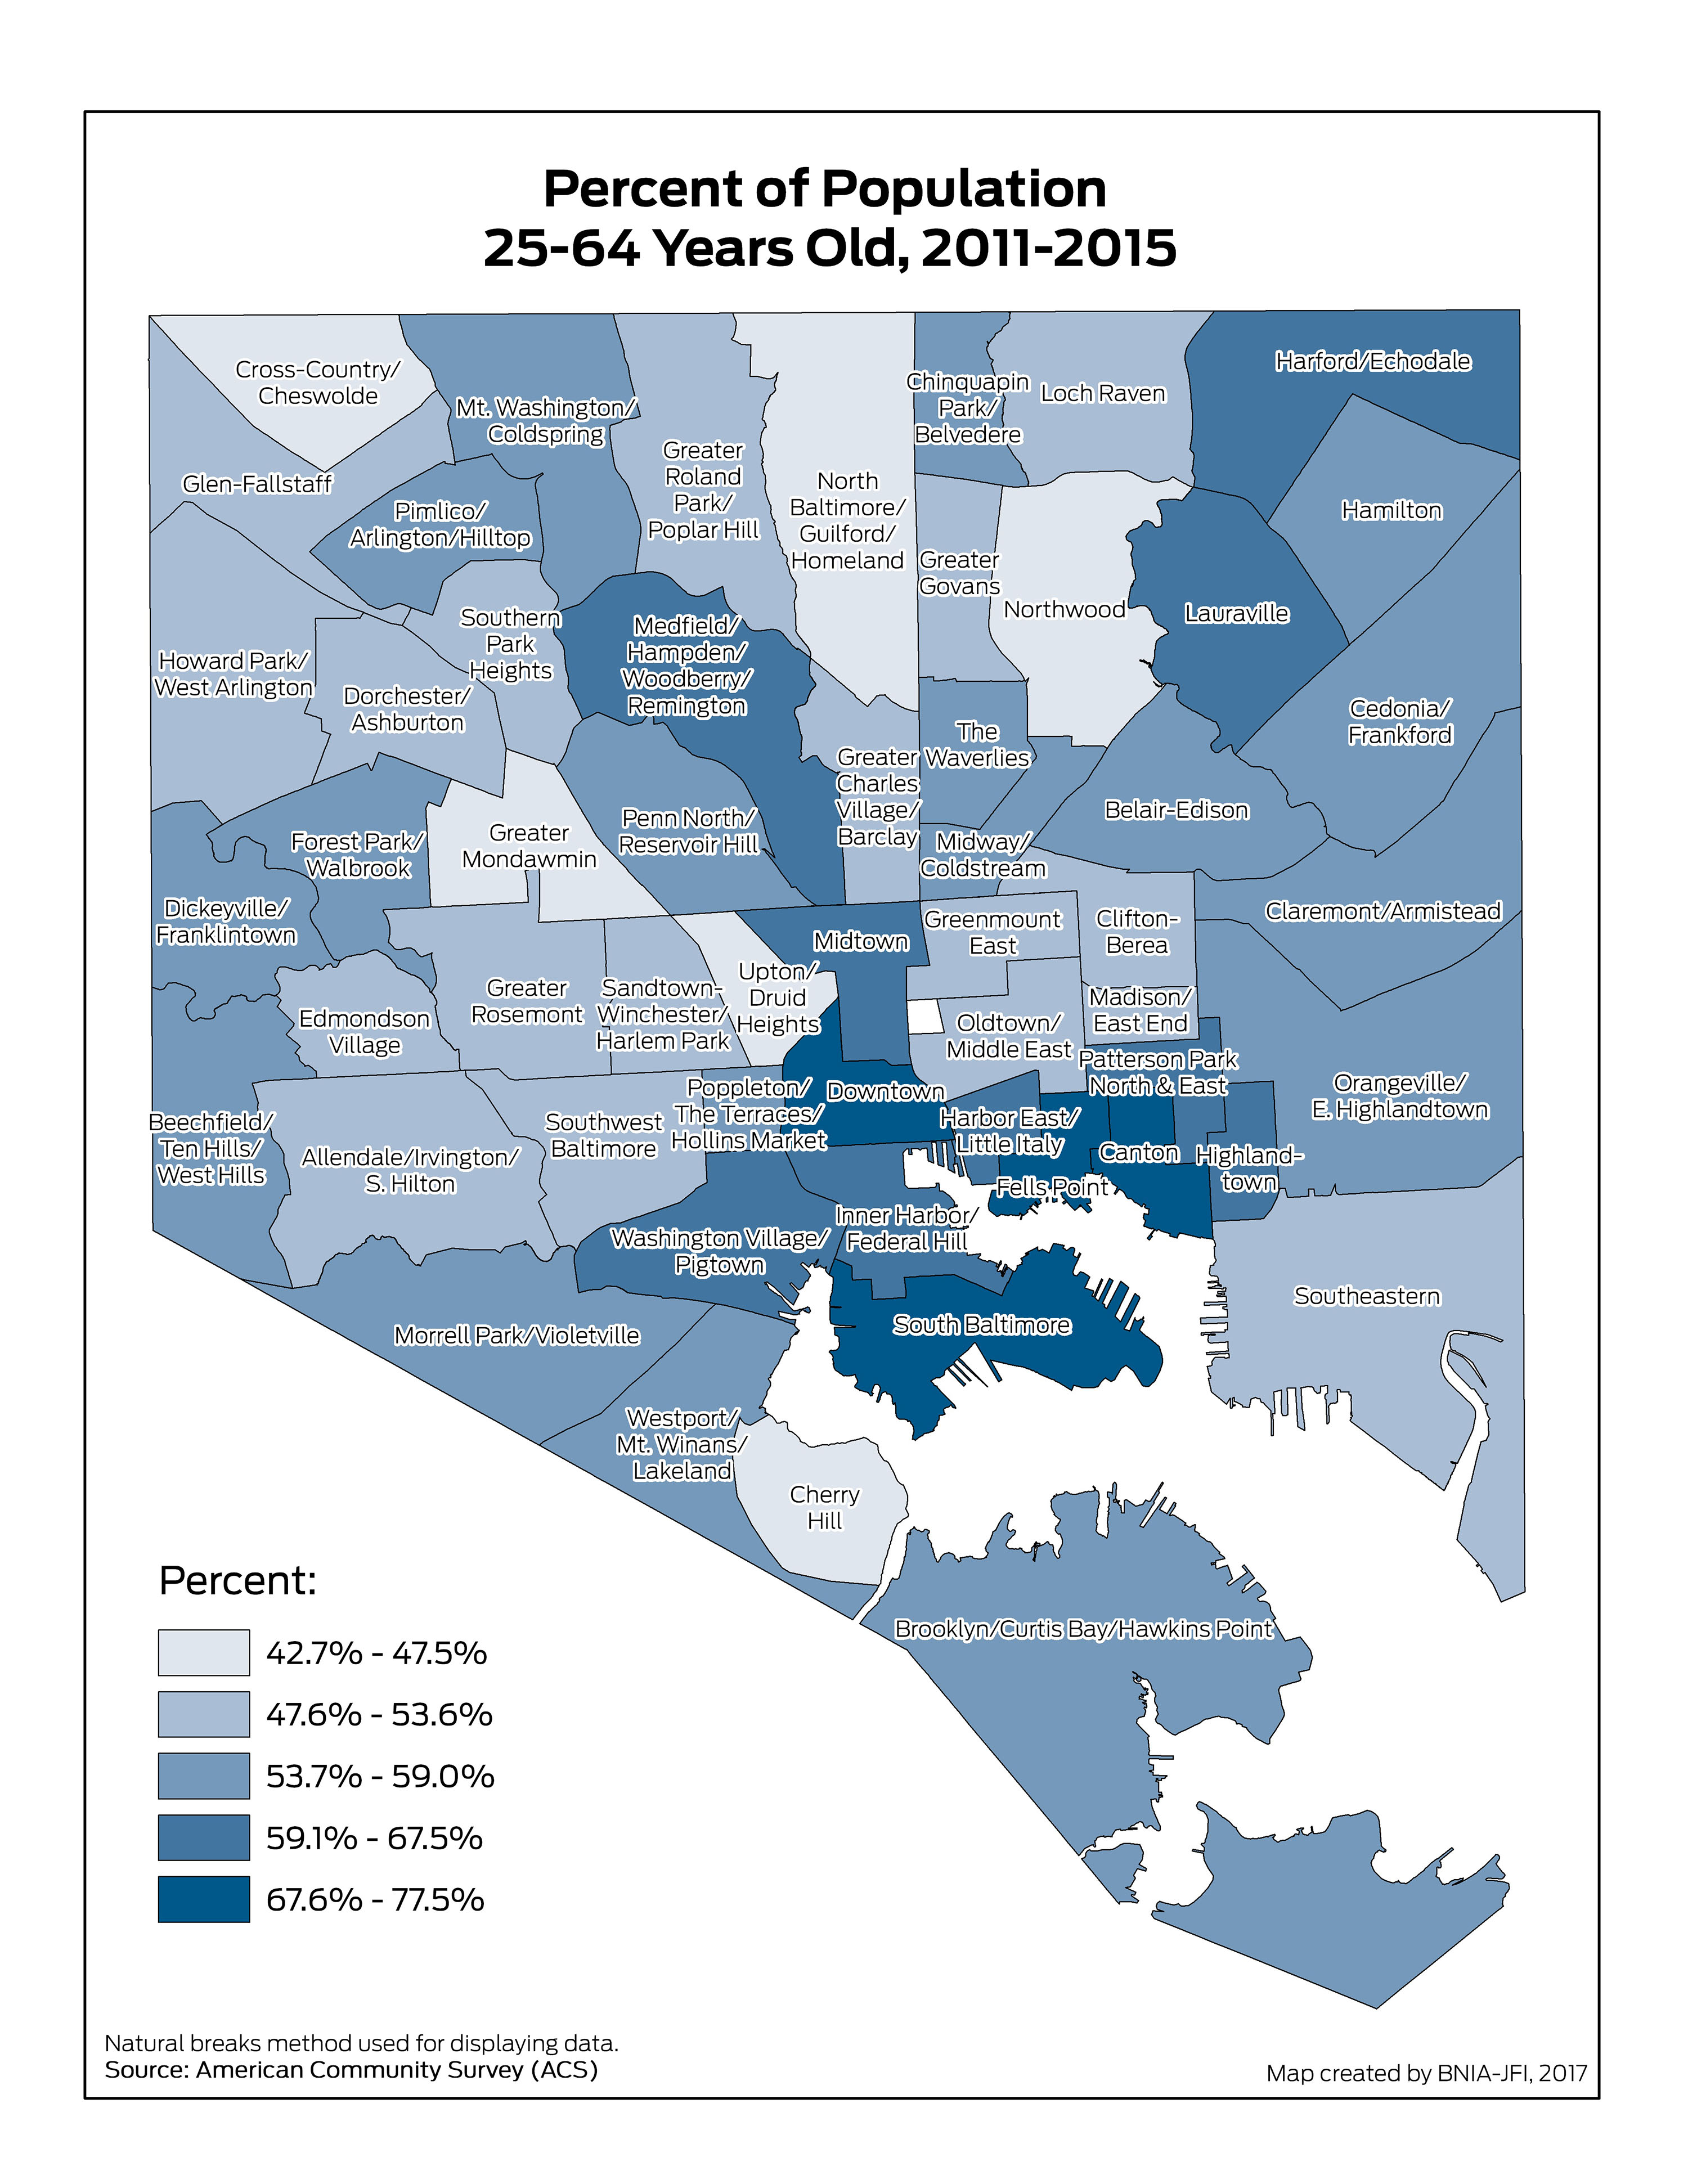
Percent of Population 25-64 Years Old
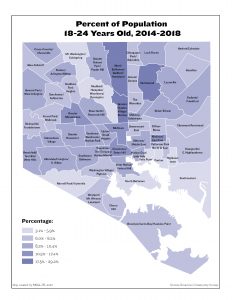
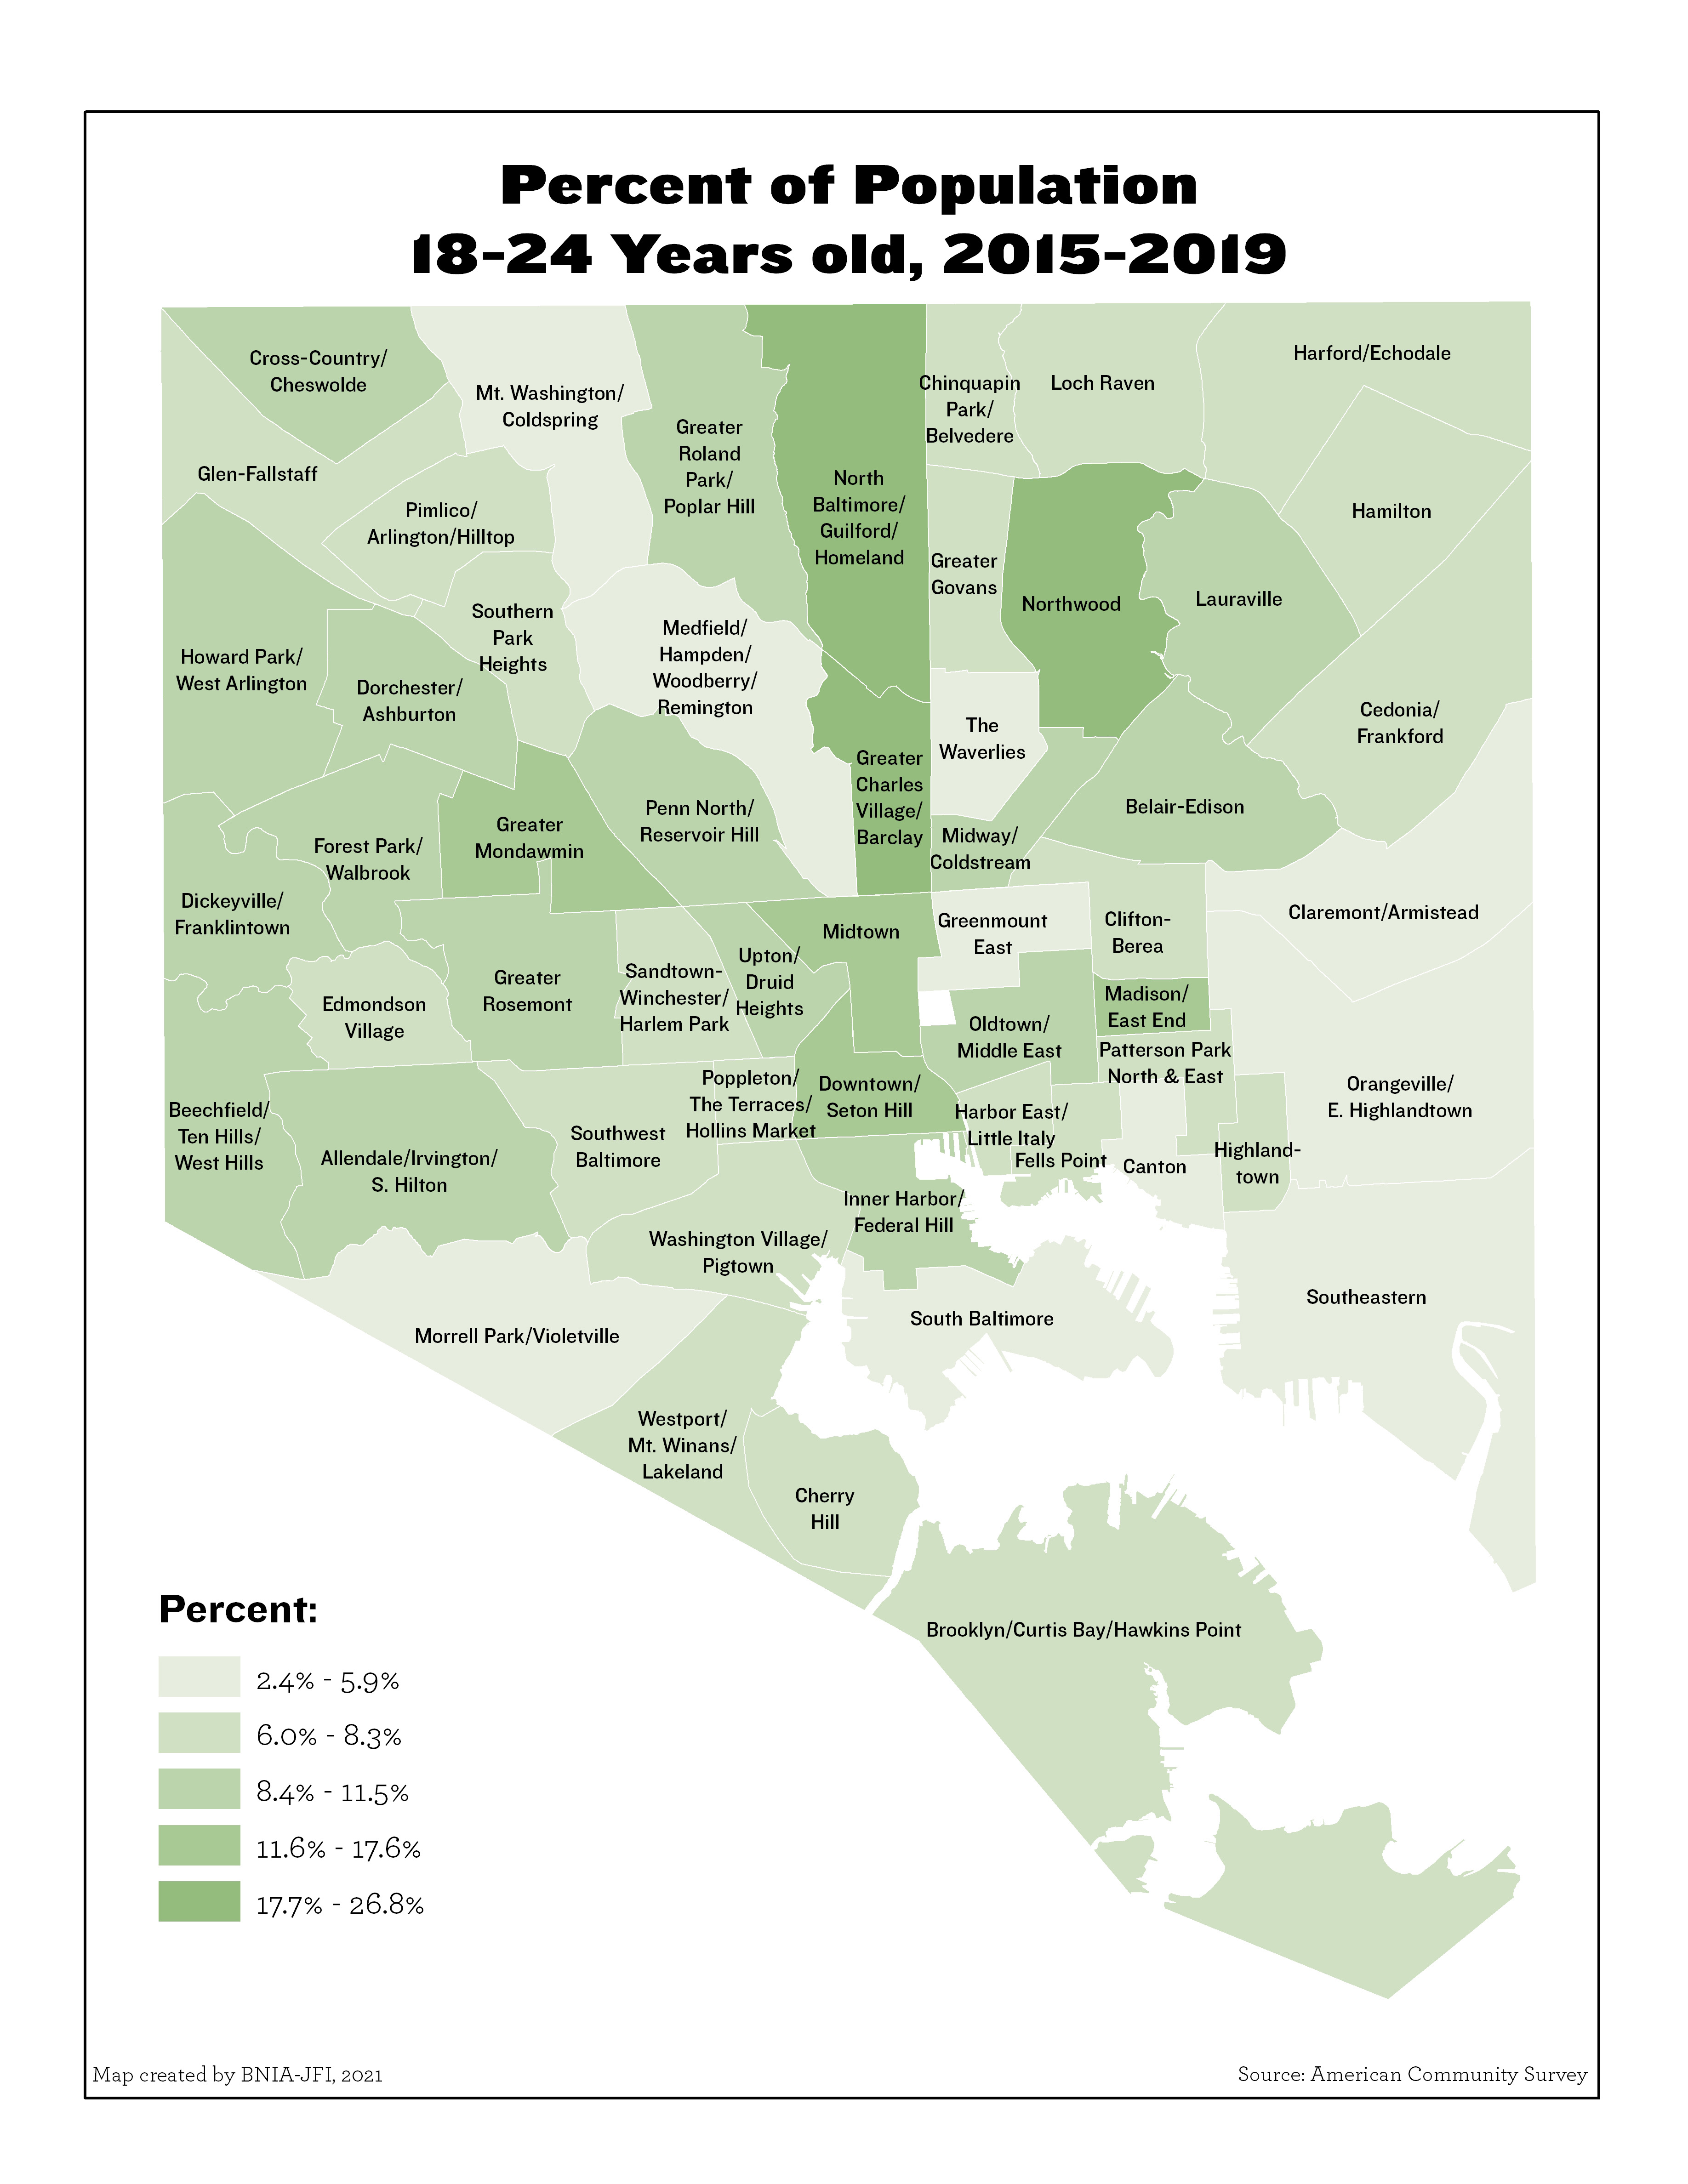
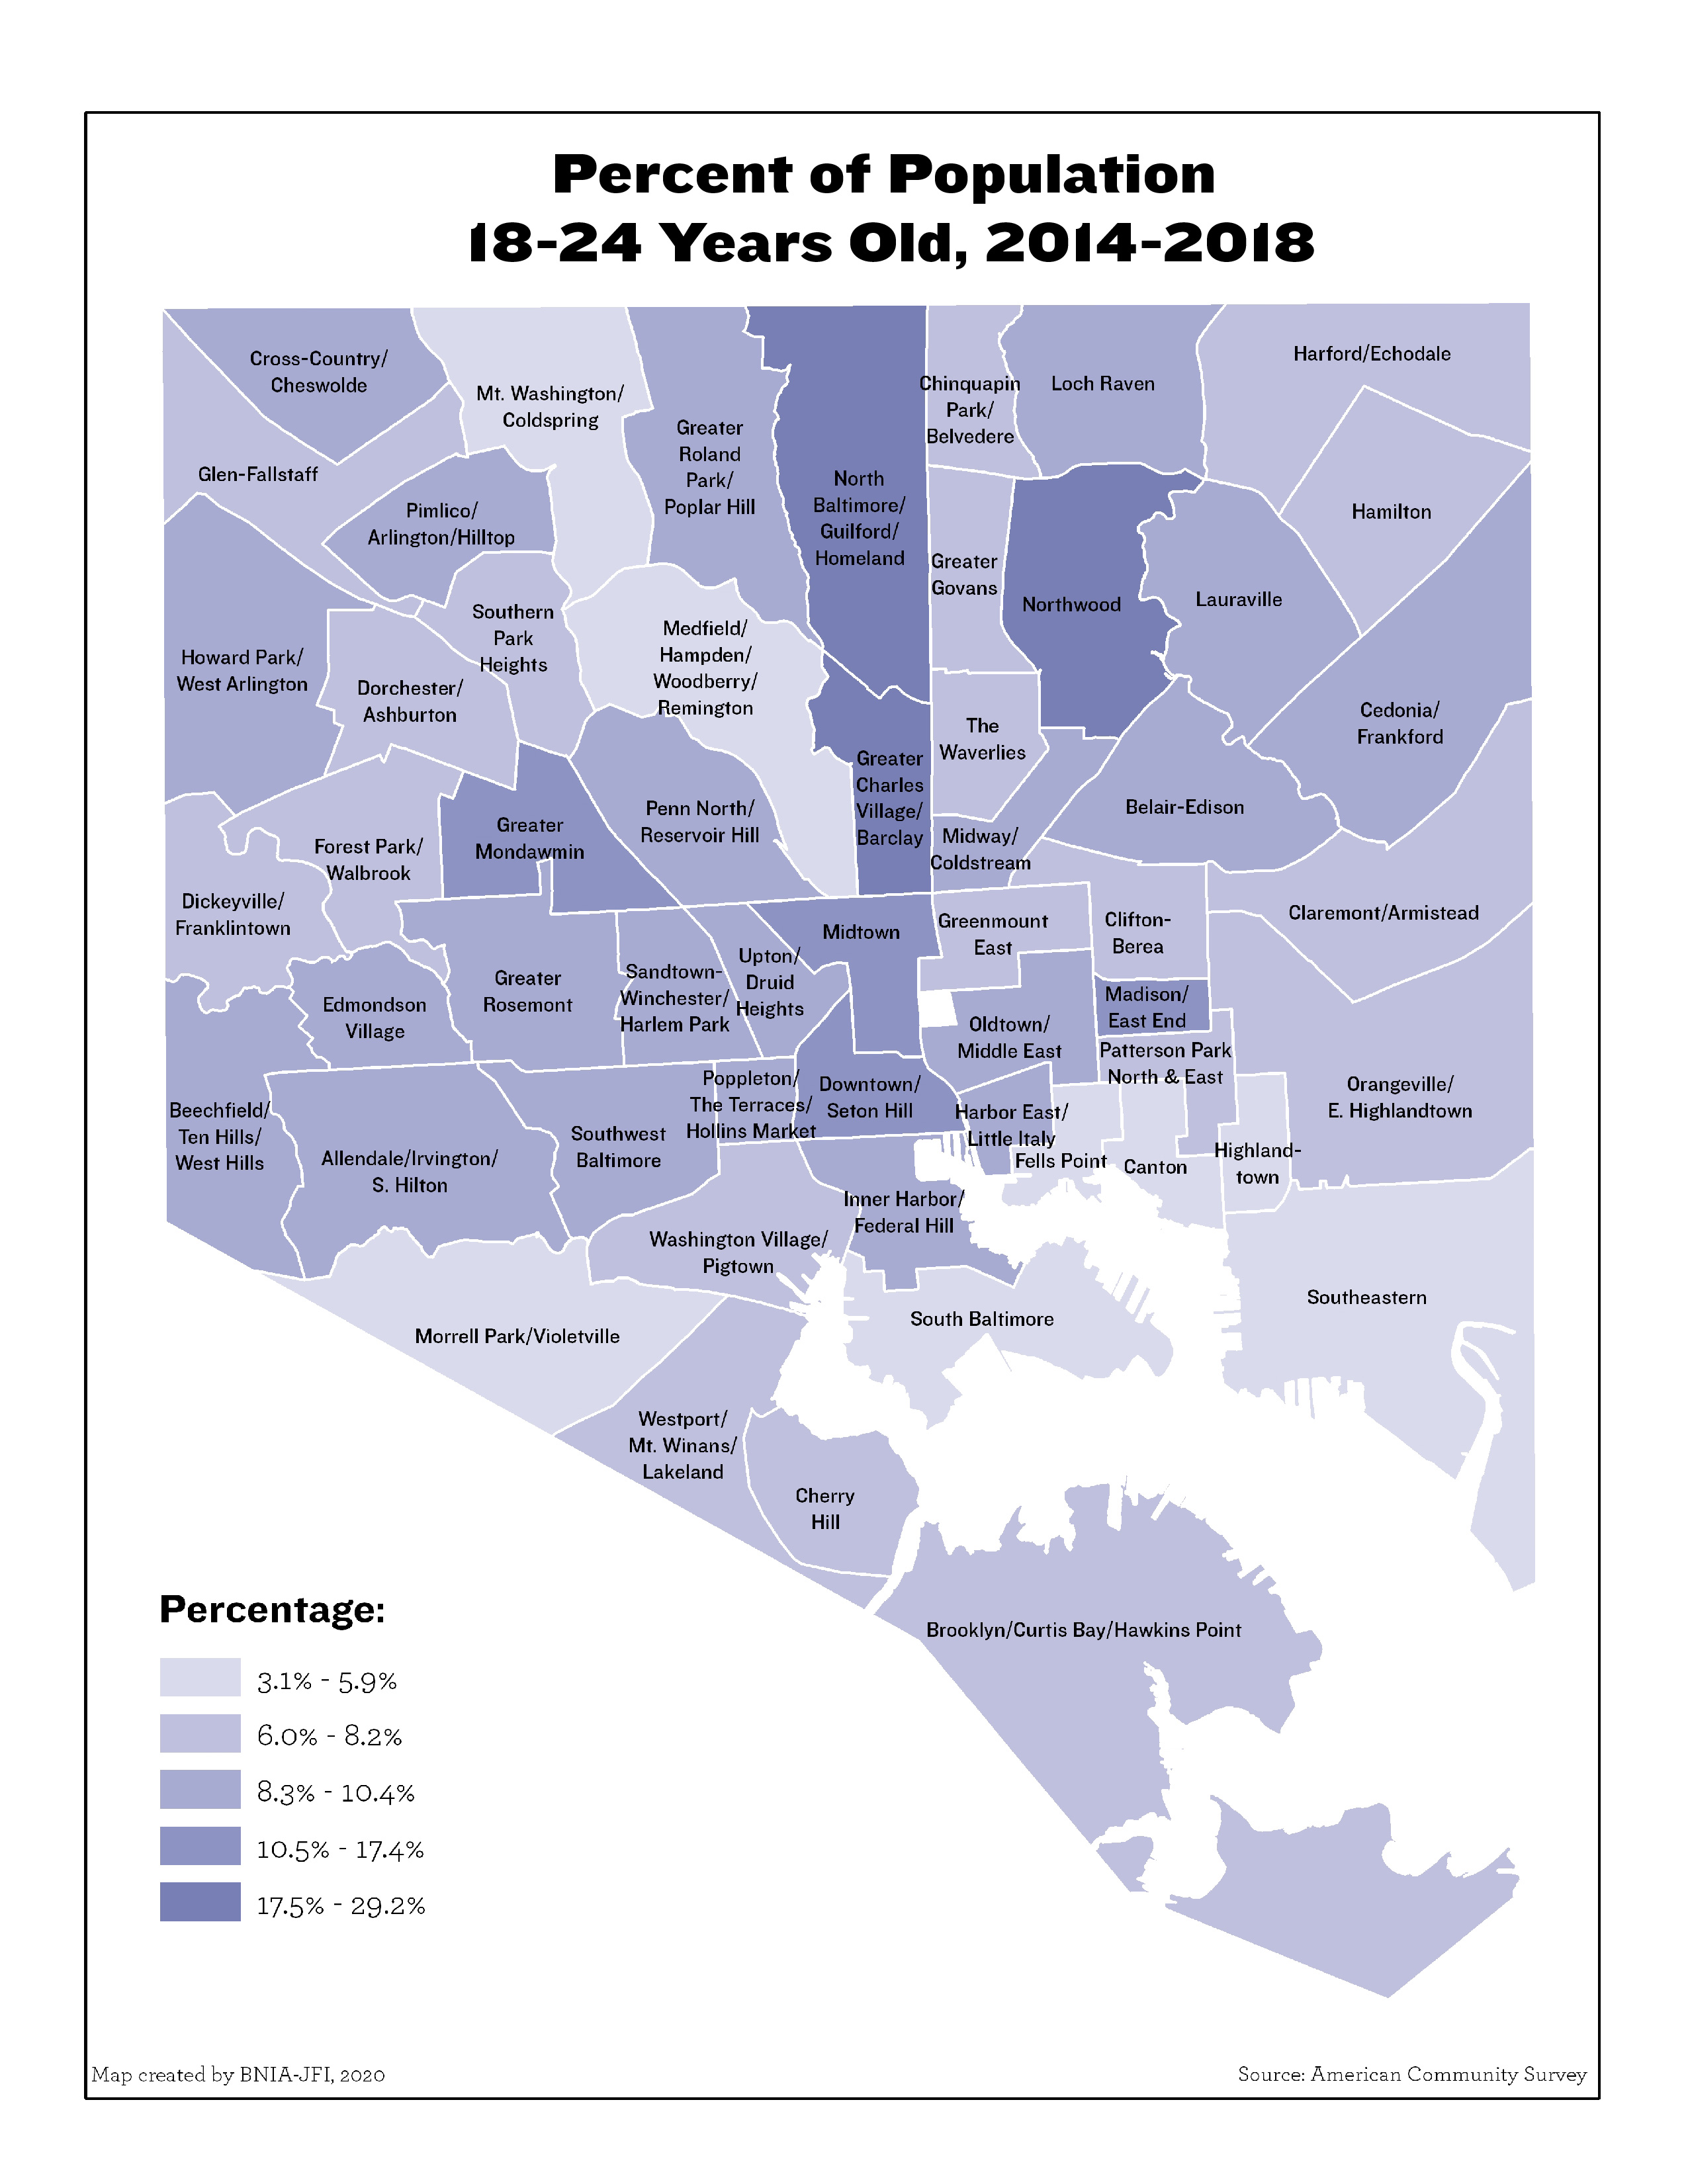
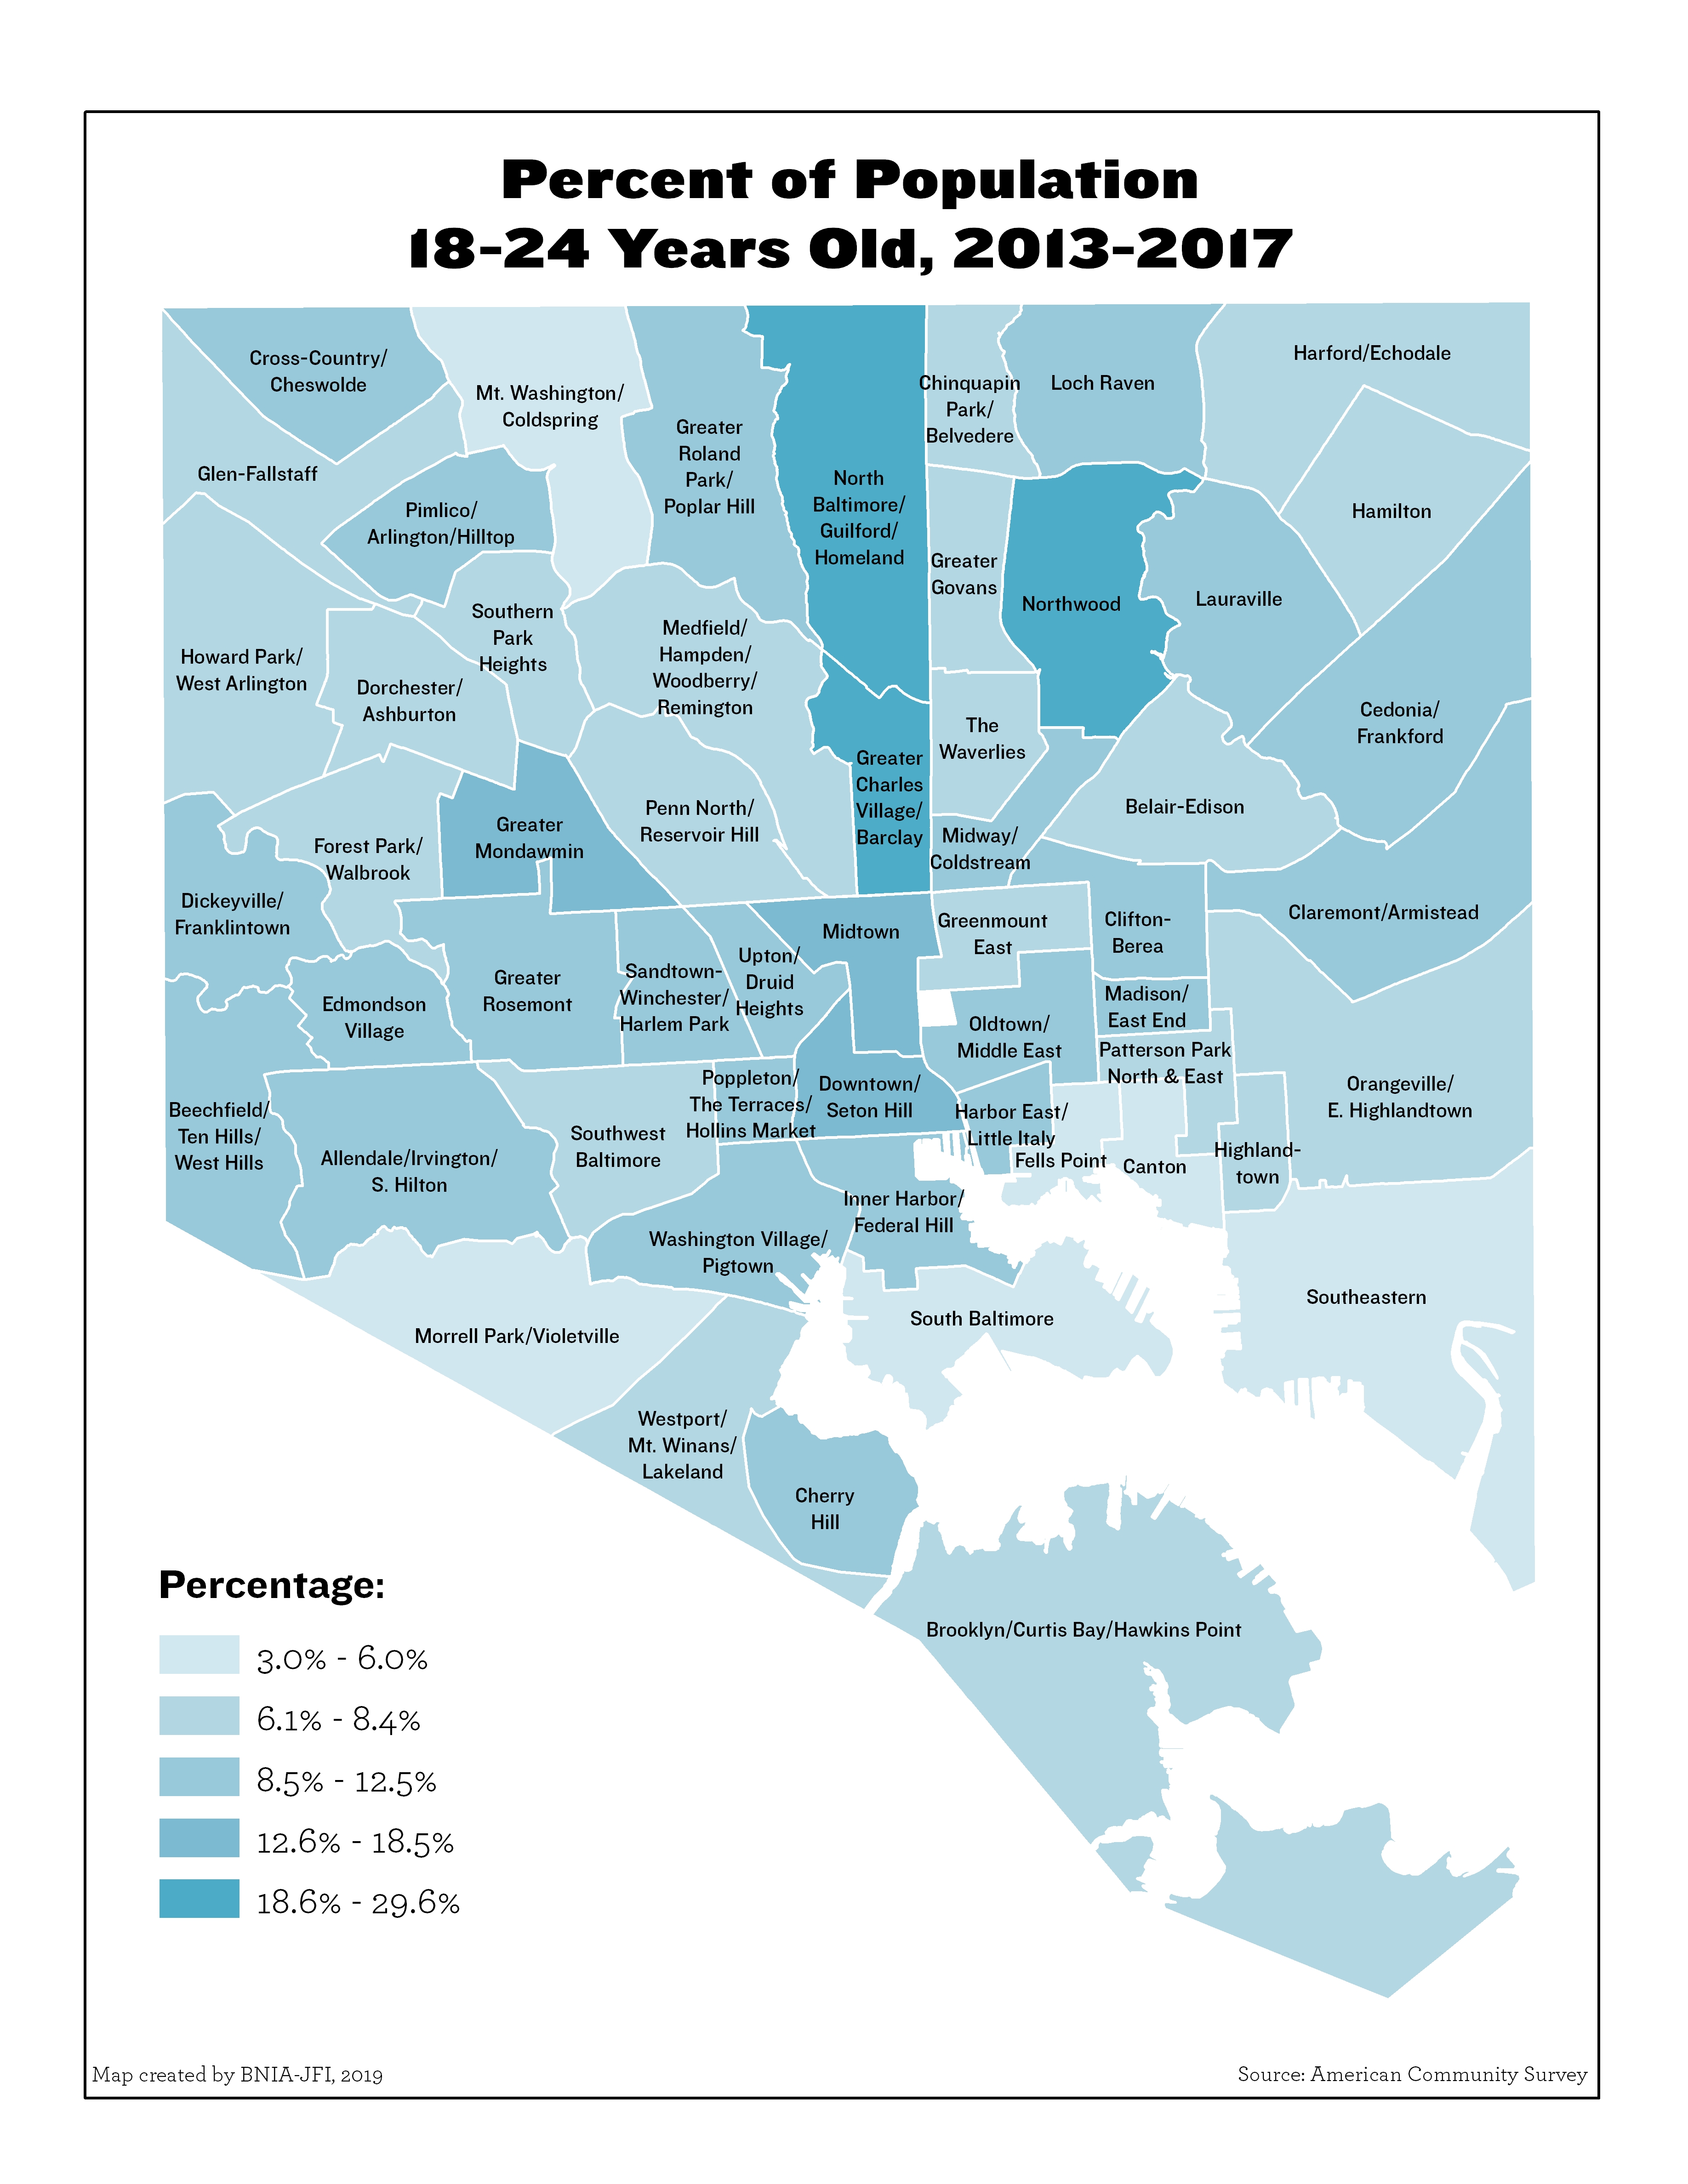
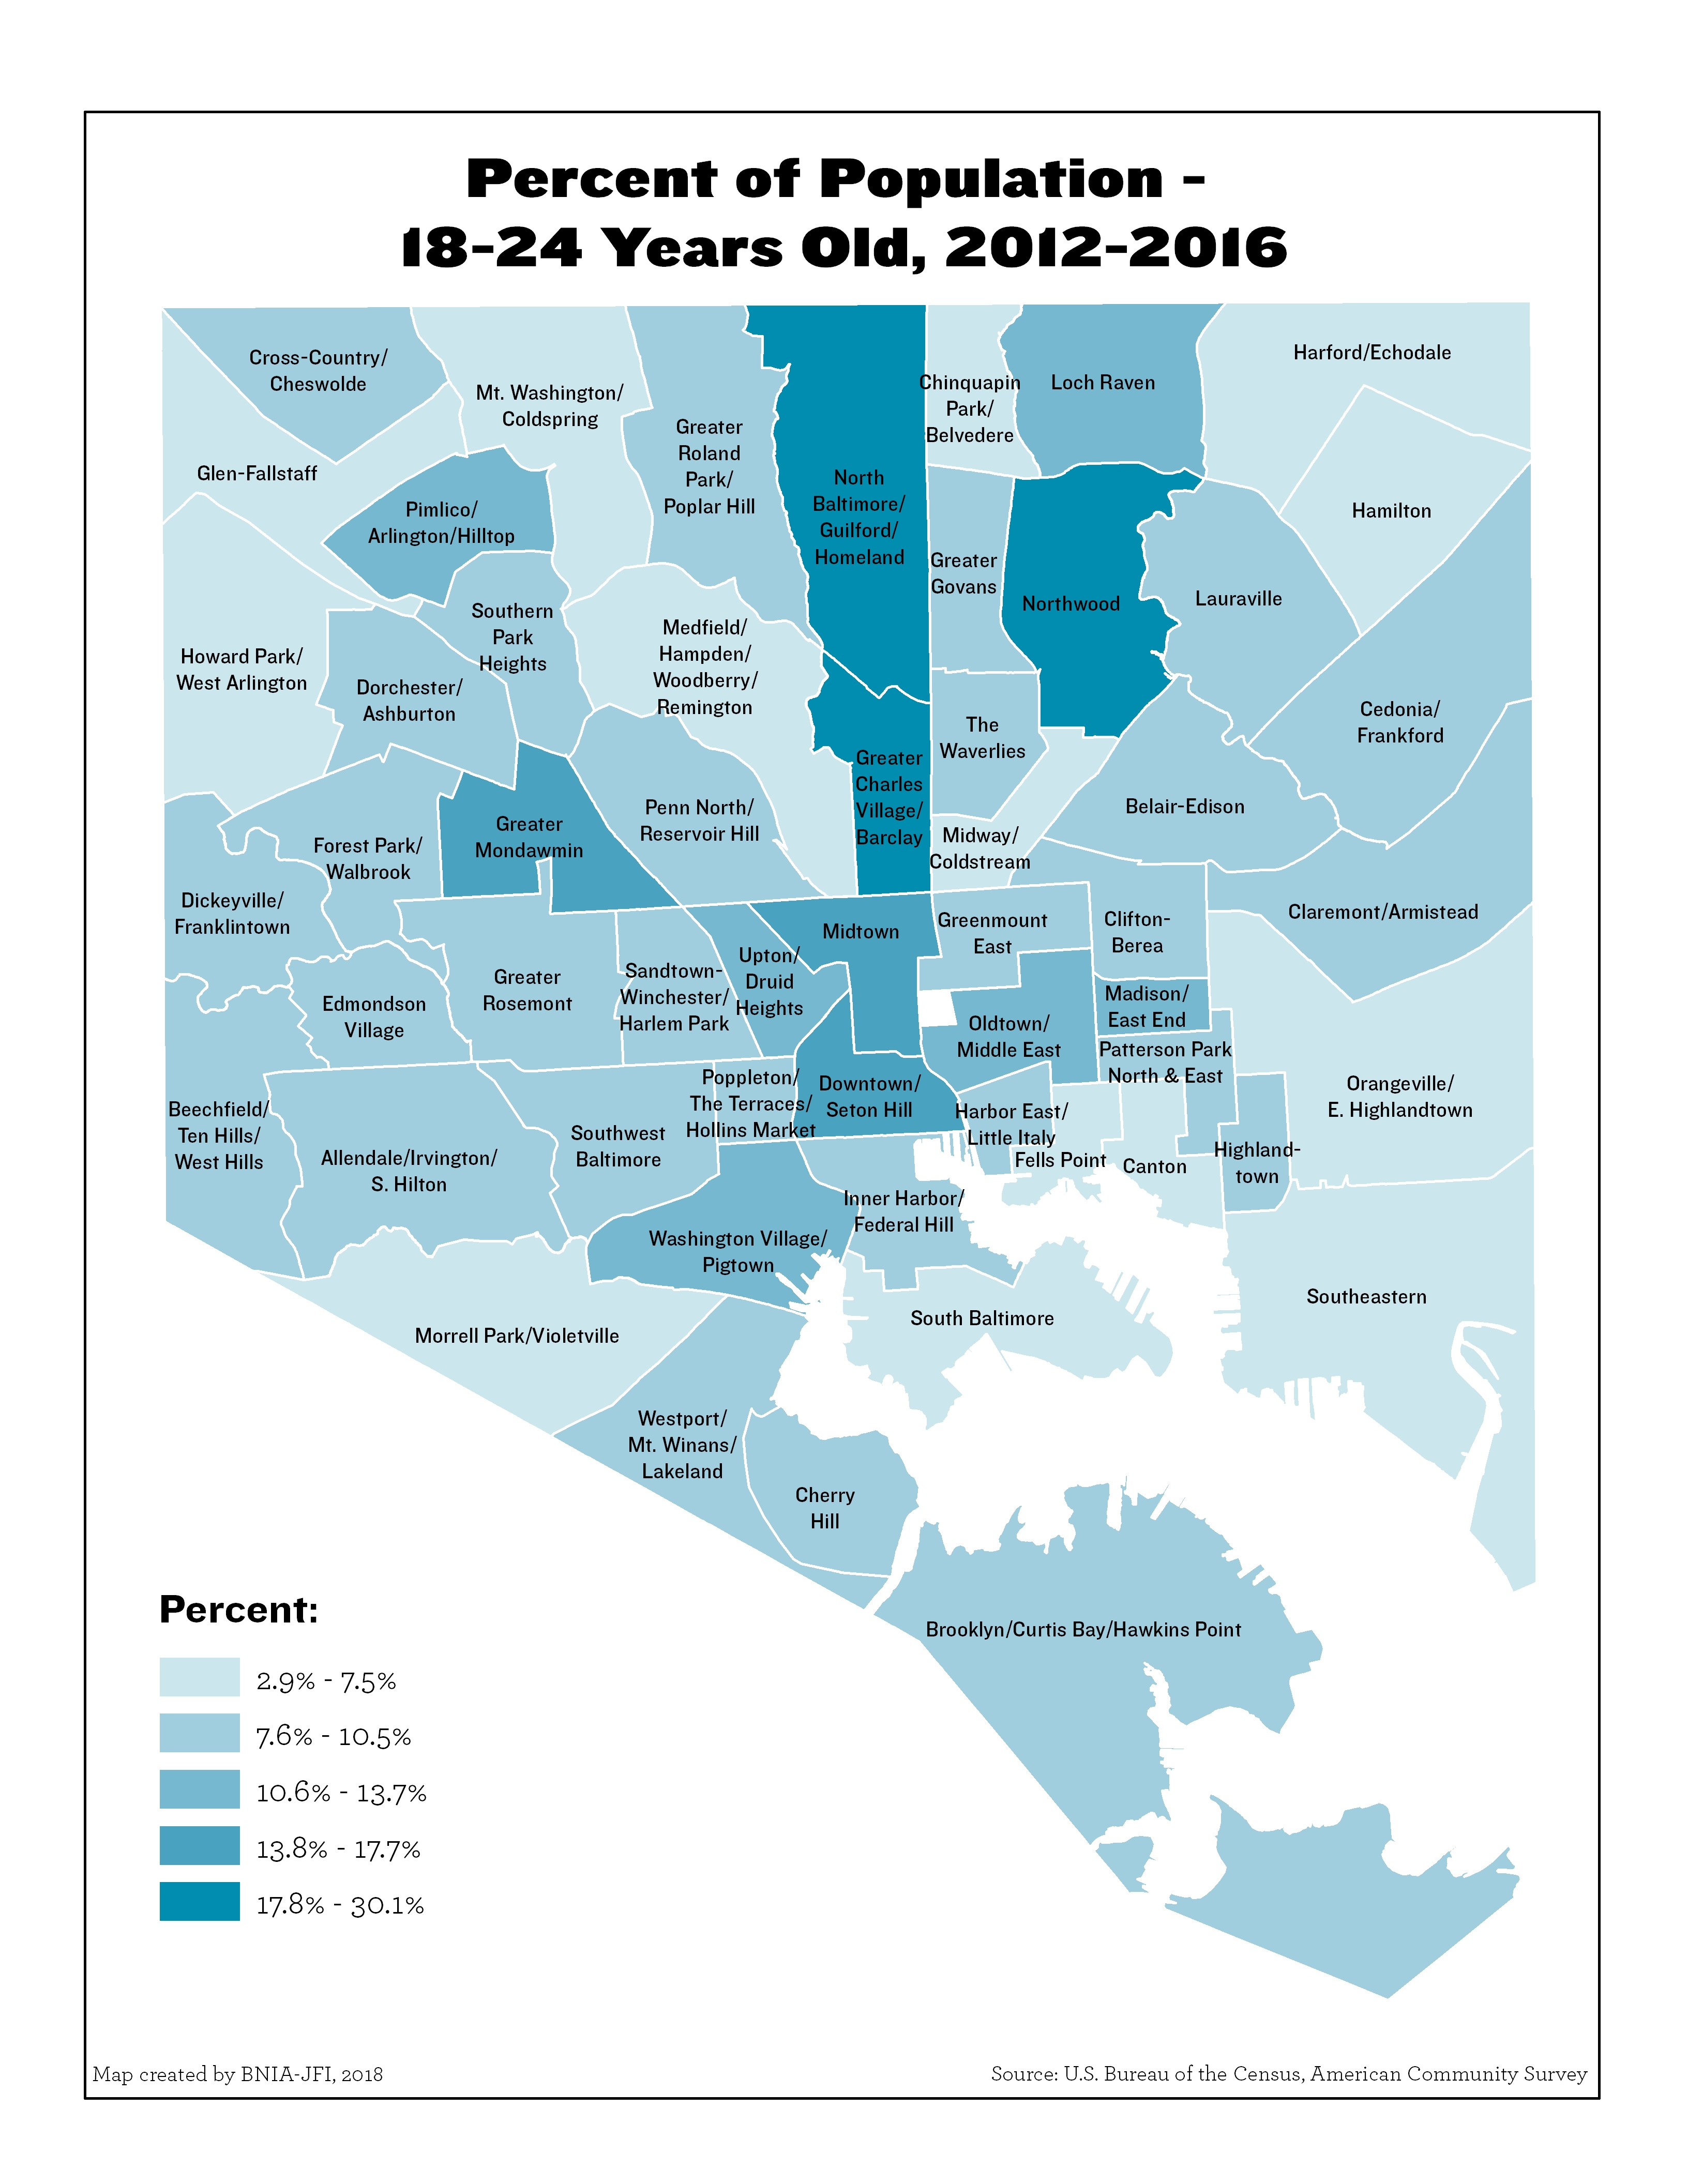
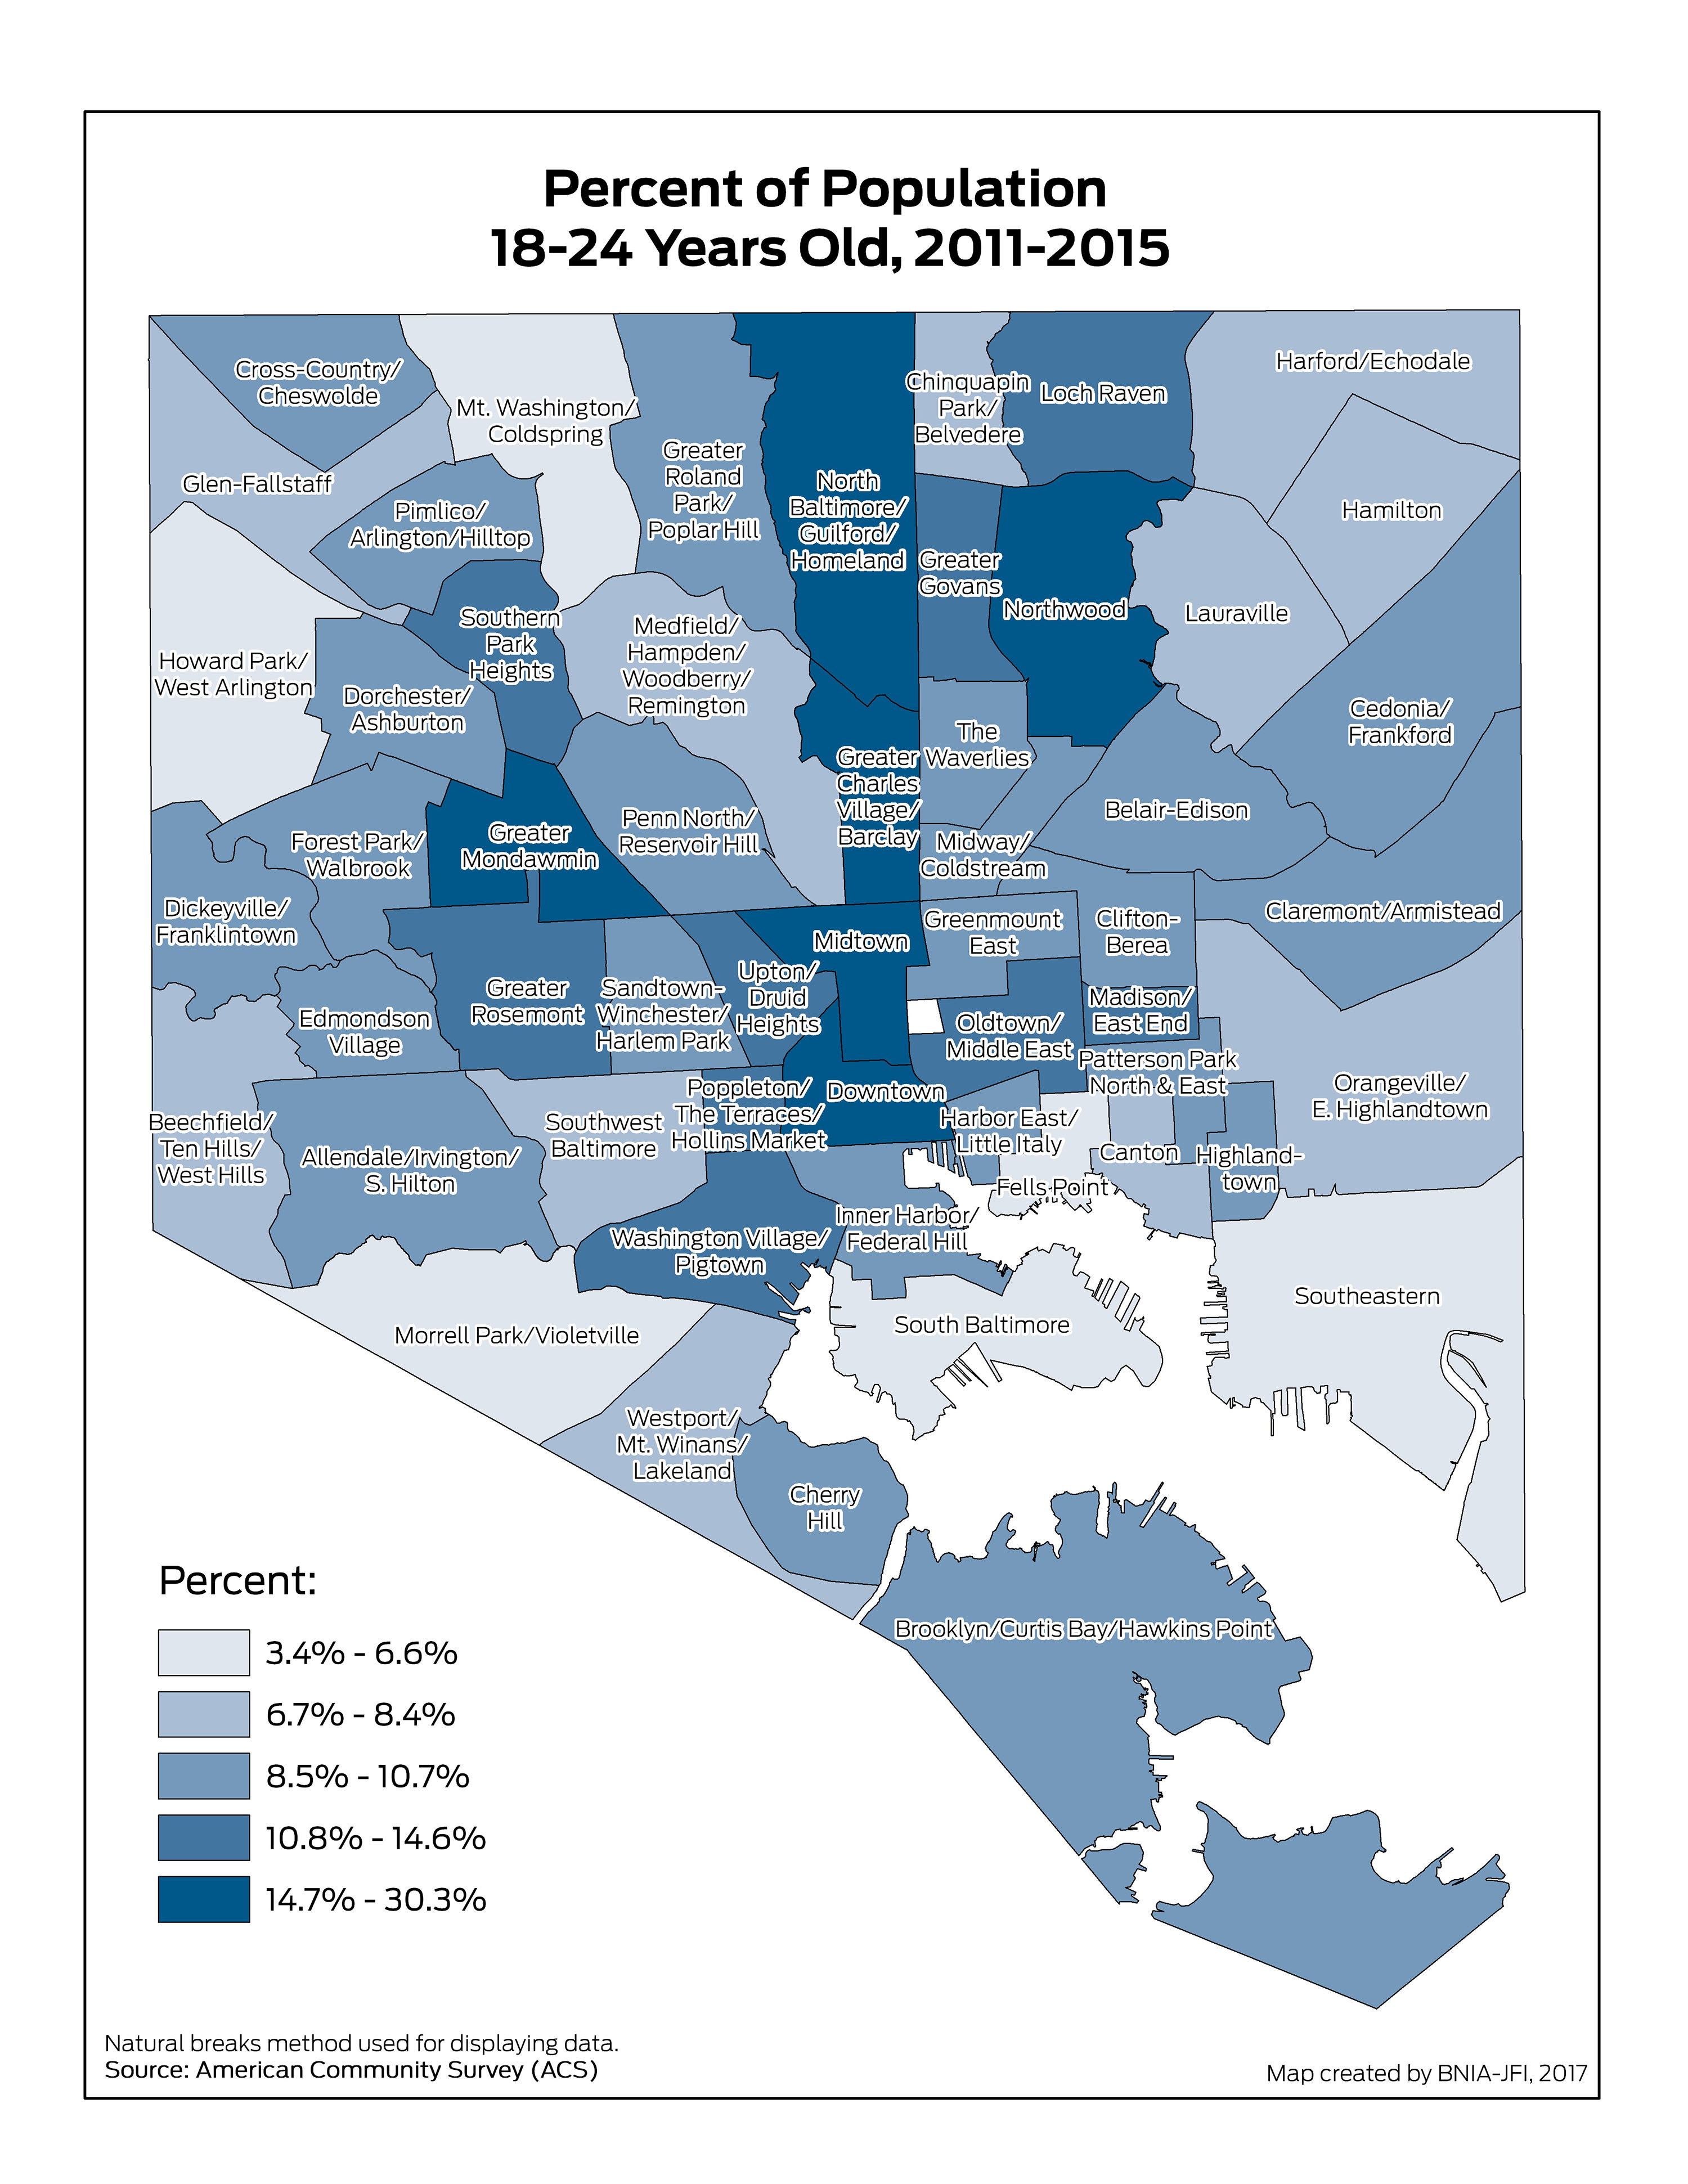
Percent of Population 18-24 Years Old
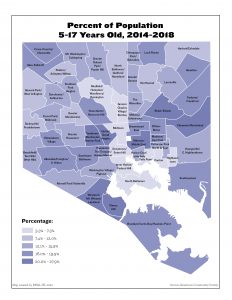
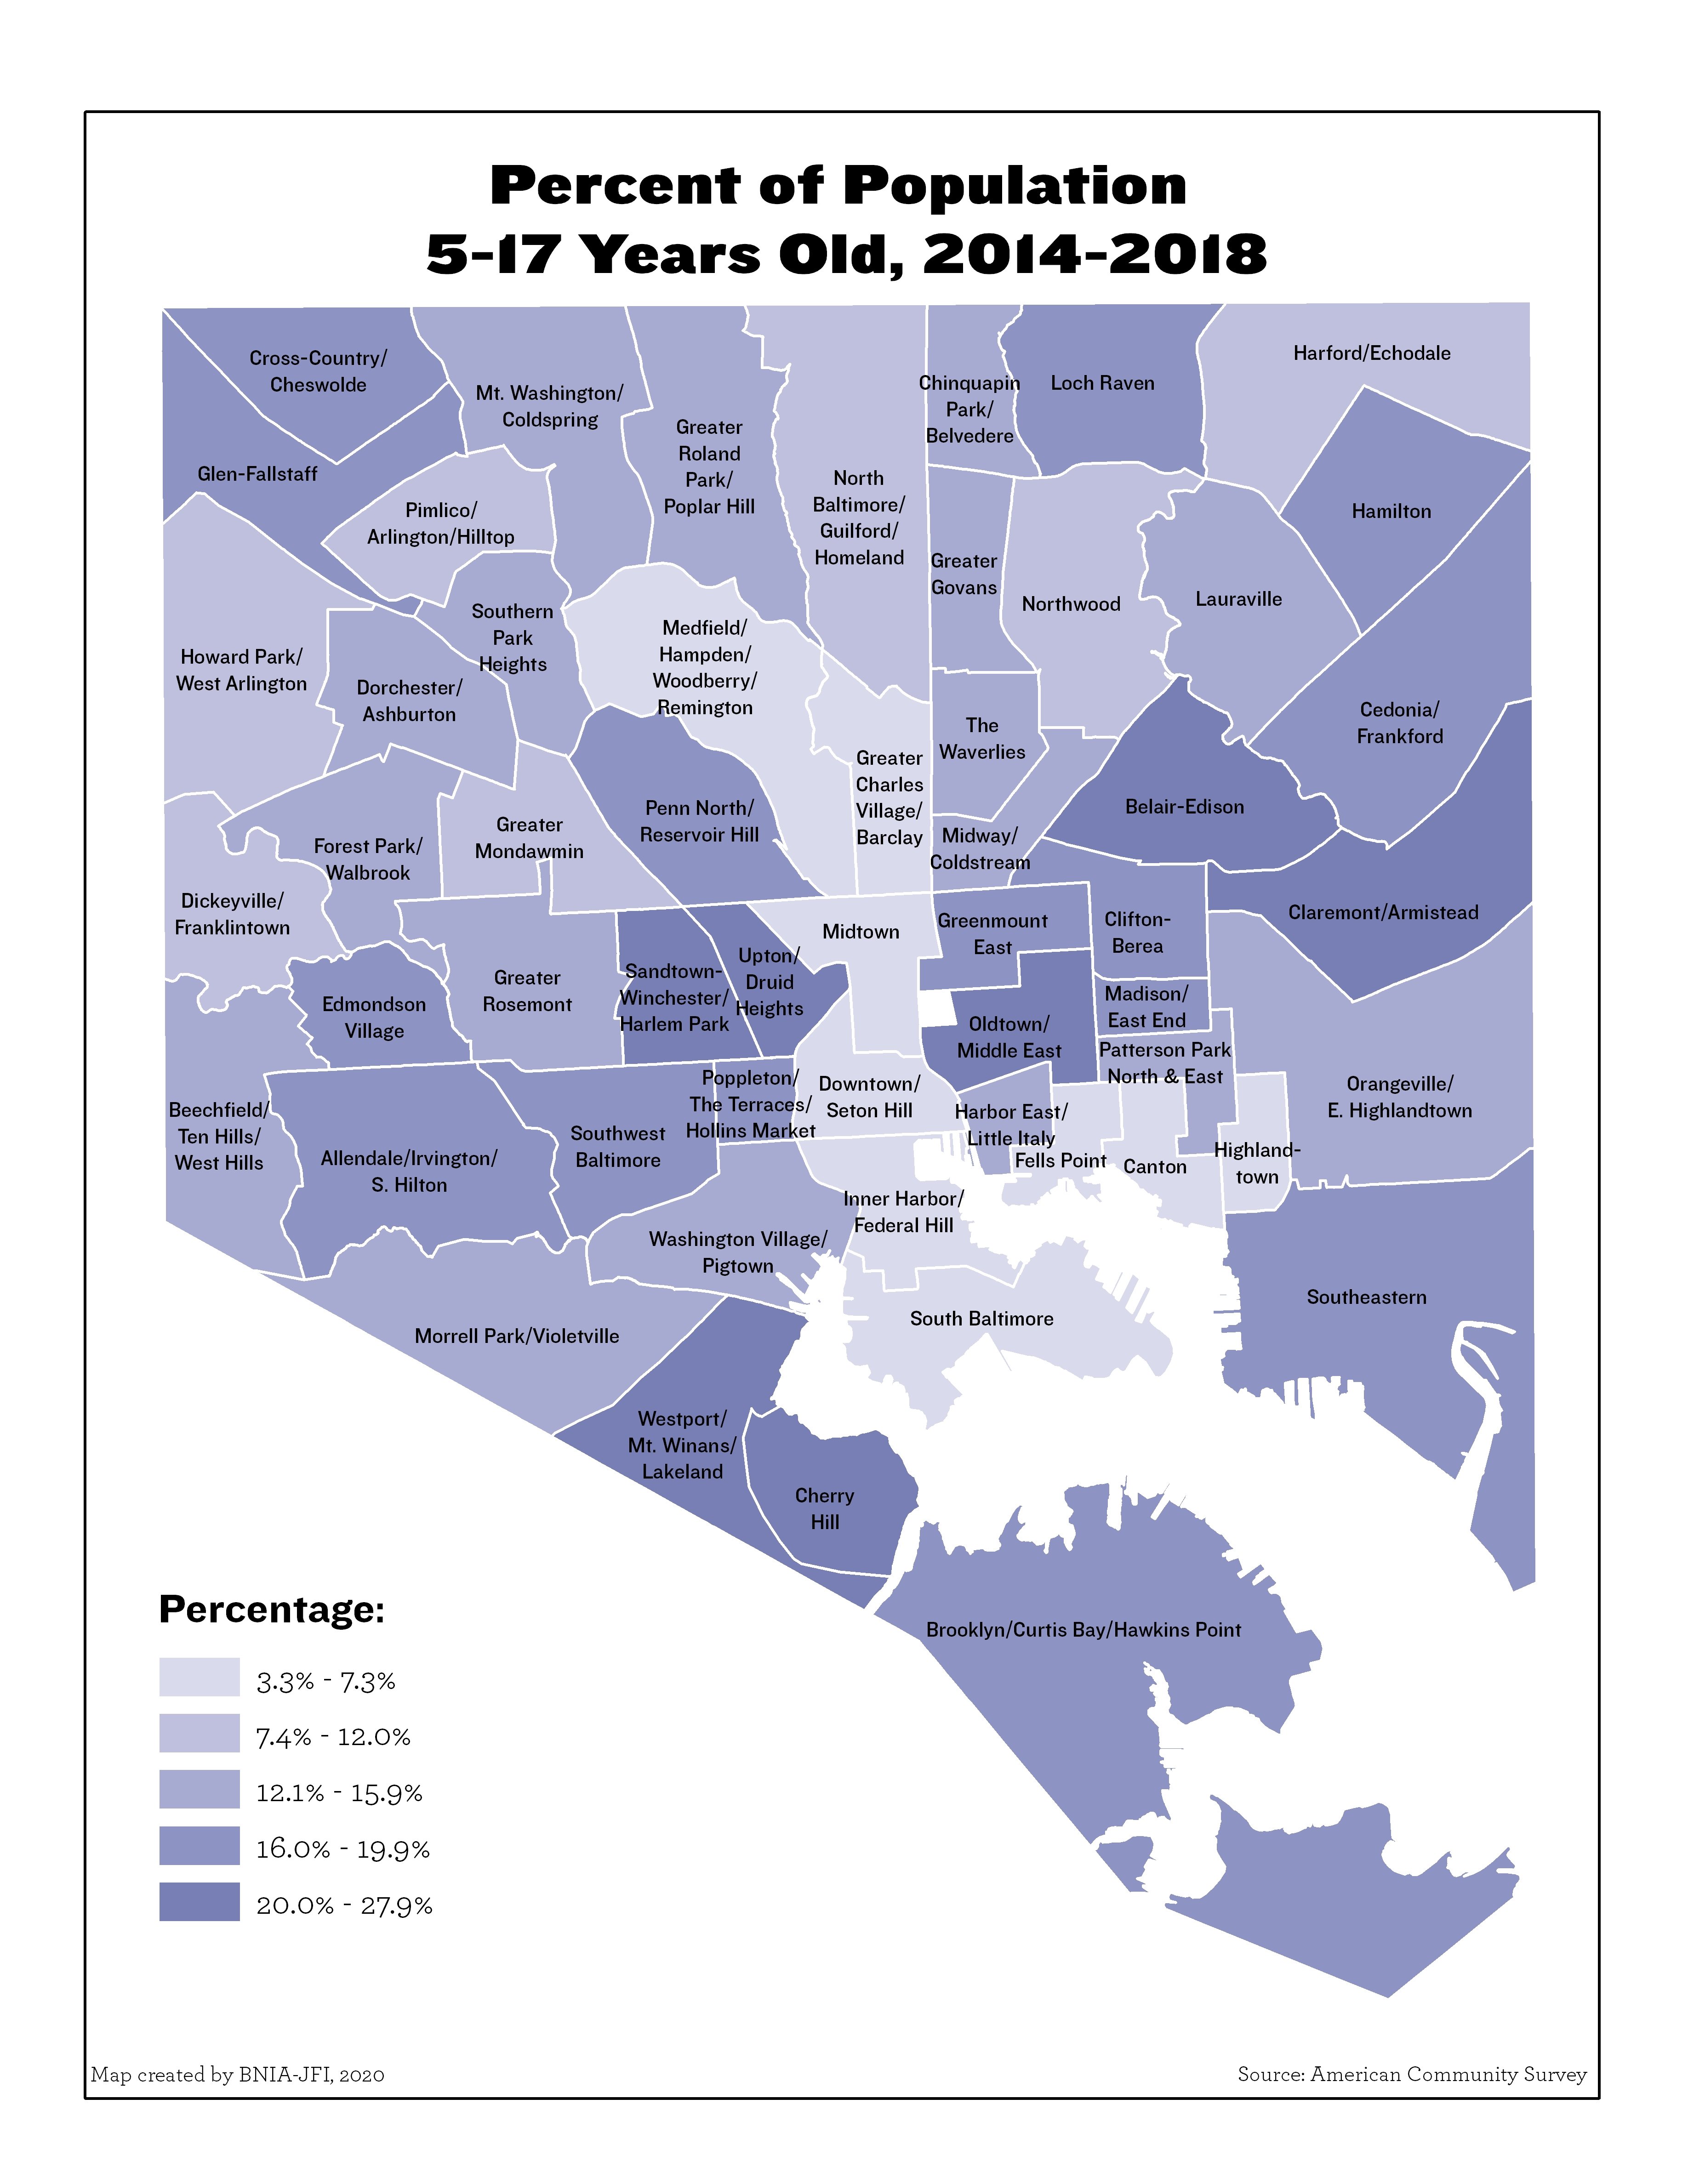
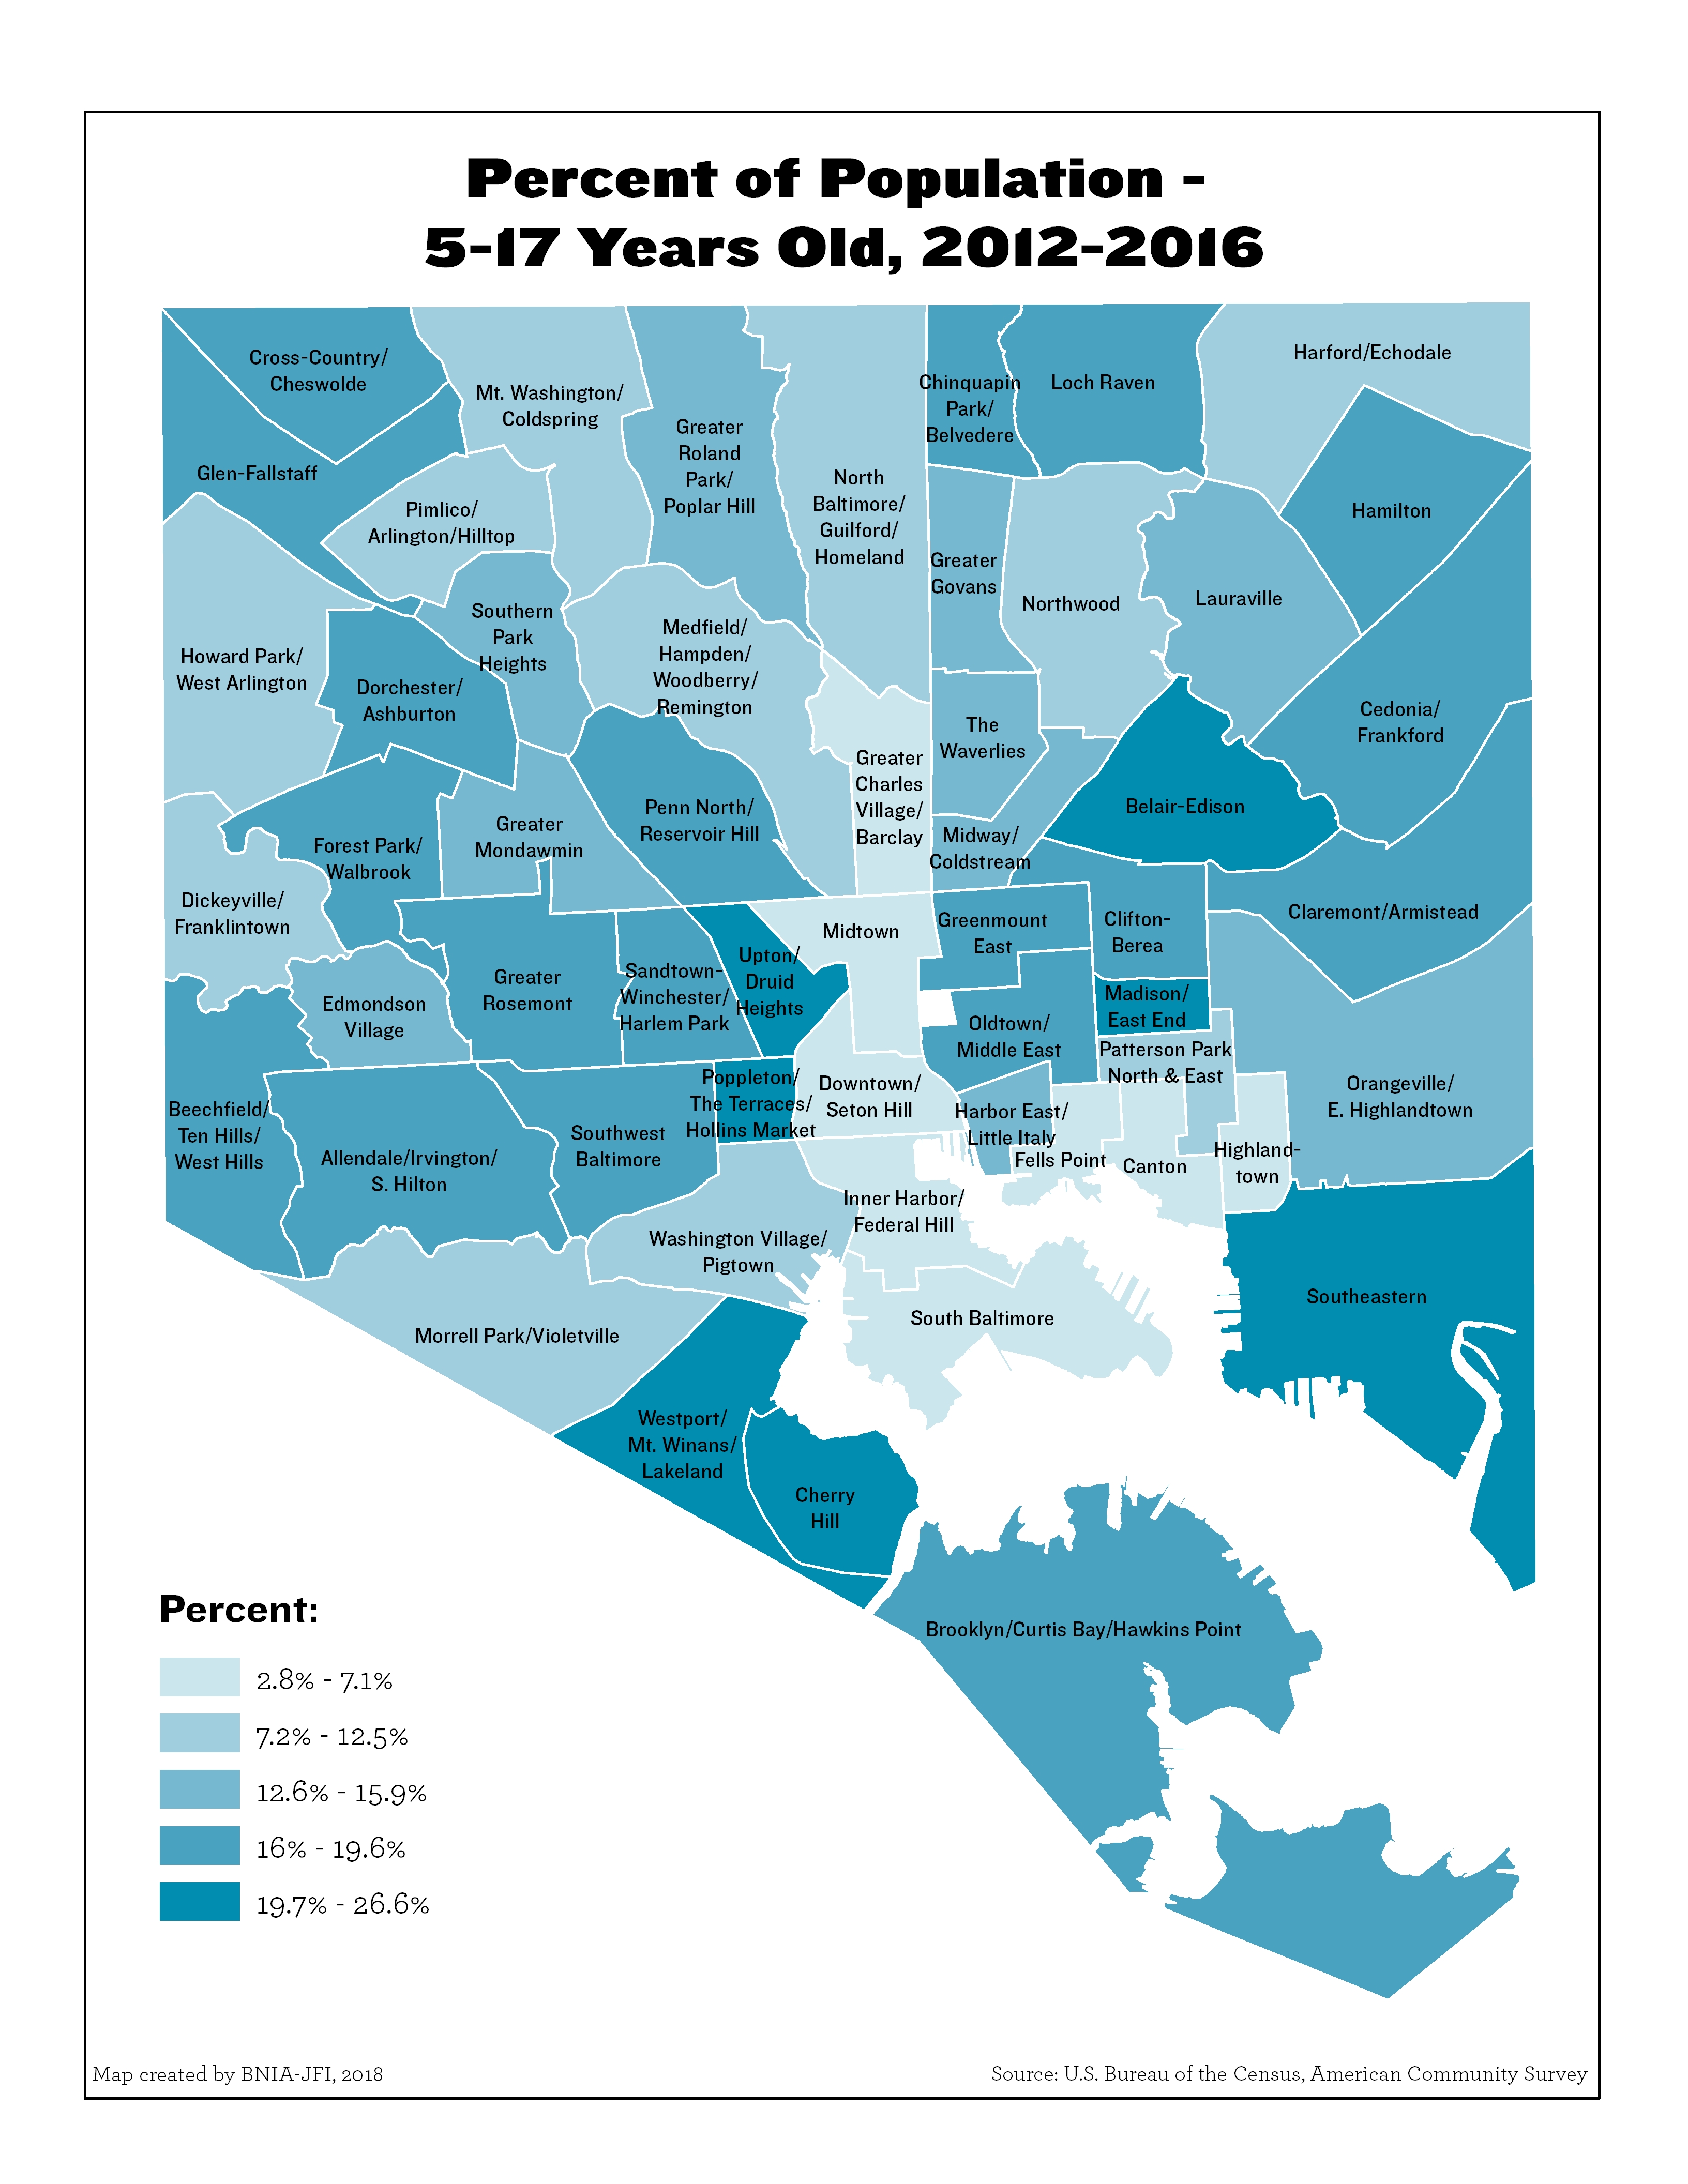
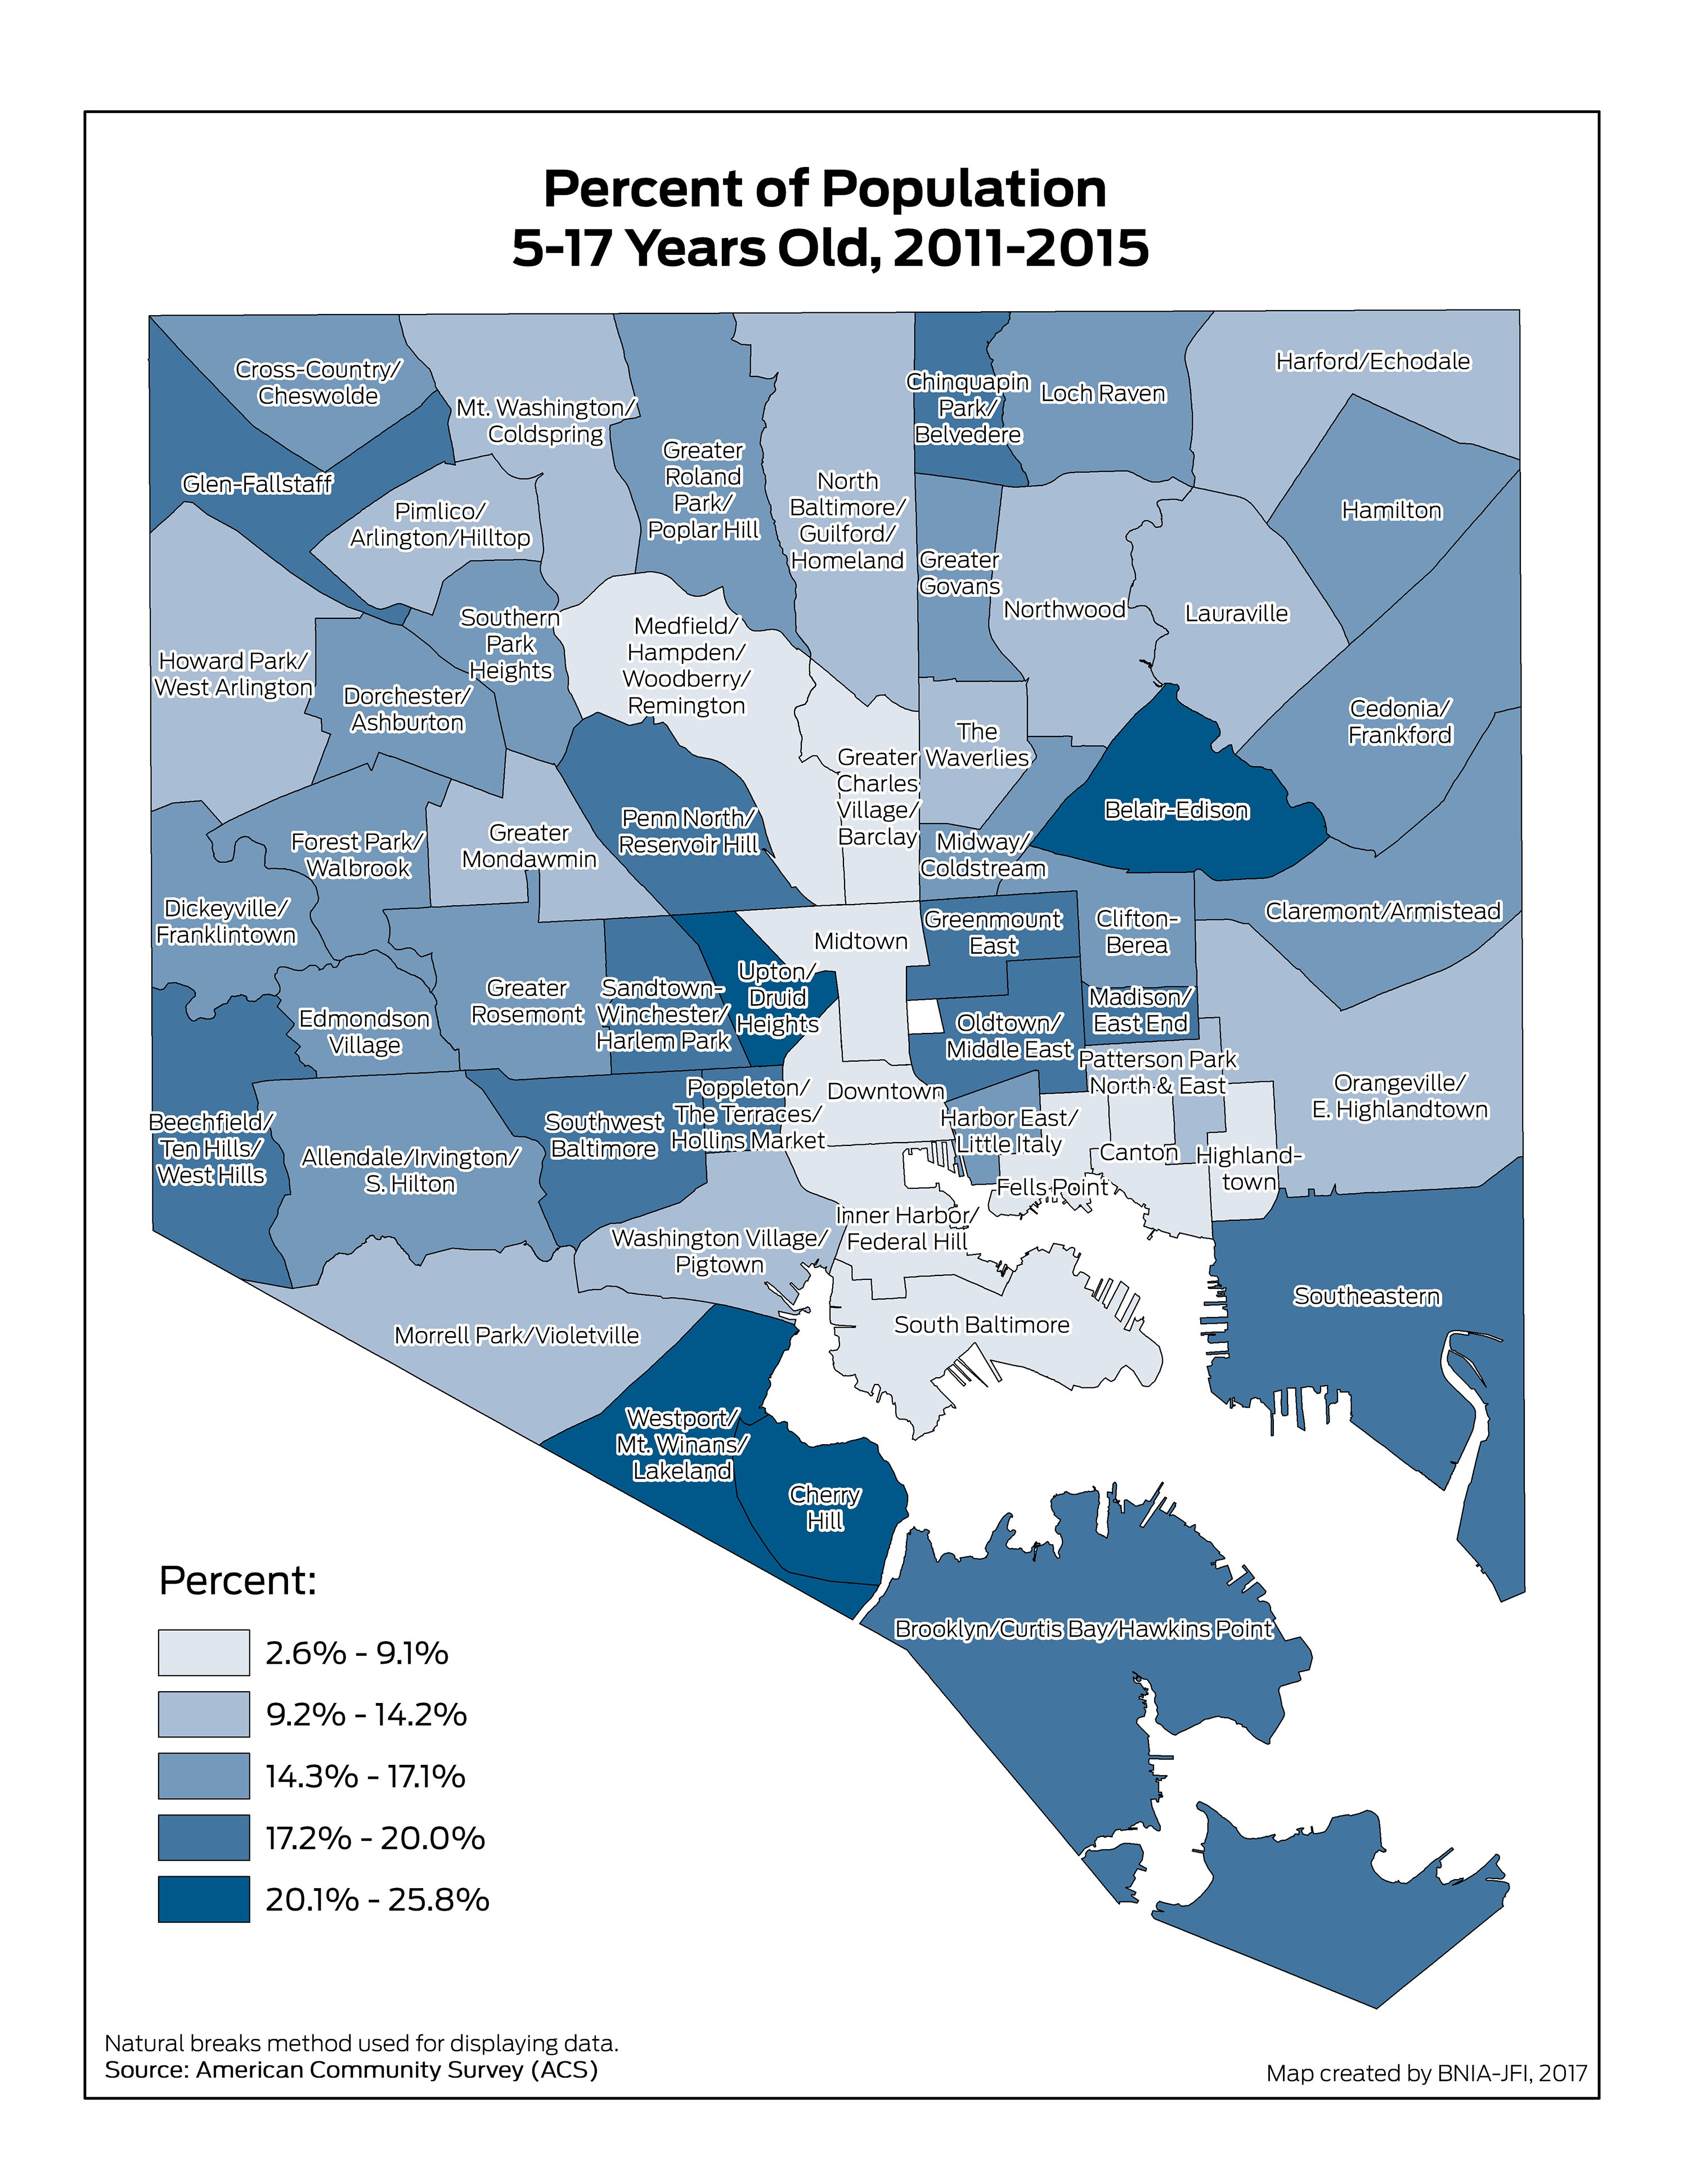
Percent of Population 5-17 Years Old
Percent of Population Under 5 Years Old