

At the Baltimore Neighborhood Indicators Alliance, our research has shown that we must address and eliminate the disparities among neighborhoods for a more equitable and just city overall. In the wake of the civil unrest that occurred in Baltimore in 2015, there is a critical urgency to ensure that all of Baltimore’s policies and programs not only remove barriers for people, but also the promote equity across all neighborhoods by focusing on three key goals. We have previously written about the first goal on housing diversity and affordability and a second goal for greater neighborhood accessibility and mobility. This blog focuses on the third goal to reduce and/or maintain low vacancy in every neighborhood.
Although Vital Signs report contains more than 100 indicators for every community in Baltimore, perhaps the single-most ultimate indicator of neighborhood vitality is population change. Between 2000 and 2010, Baltimore City as a whole experienced net population loss of 30,000 people which continued a half-century trend; since 1950 the City has lost 330,000 residents. This loss has not been equally distributed in recent years, with some neighborhoods growing and others shrinking.
Population growth or even stability in a neighborhood signals that a community provides locational advantages within the city and the region (i.e. quality housing, schools, jobs, urban amenities) that draw in new residents if a household moves away. Table 1 below shows the neighborhoods in Baltimore that lost and gained the most population between 2000 and 2010. Sandtown-Winchester/Harlem Park lost nearly 2,600 people (15%) over the last decade. If a neighborhood is losing thousands of people, this fundamental statistic is a clear statement about the quality of life in the neighborhood.
| Table 1: Population Change between 2000 and 2010 for Losing-most and Gaining-most Community Statistical Areas (CSA) | ||||
| Pop 2000 | Pop 2010 | Change | % | |
| Baltimore City | 651,154 | 620,961 | -30,193 | -4.6 |
| Greenmount East | 11,561 | 8,184 | -3,377 | -29.2 |
| Allendale/Irvington/S. Hilton | 19,129 | 16,217 | -2,912 | -15.2 |
| Clifton-Berea | 12,496 | 9,874 | -2,622 | -21.0 |
| Greater Rosemont | 21,877 | 19,259 | -2,618 | -12.0 |
| Sandtown-Winchester/Harlem Park | 17,495 | 14,896 | -2,599 | -14.9 |
| Canton | 7,010 | 8,100 | 1,090 | 15.5 |
| Cross-Country/Cheswolde | 11,796 | 13,034 | 1,238 | 10.5 |
| Downtown/Seton Hill | 4,767 | 6,446 | 1,679 | 35.2 |
| Harbor East/Little Italy | 3,523 | 5,407 | 1,884 | 53.5 |
The most evident indicator of population loss in a neighborhood is vacant and abandoned housing; while people might move away from a neighborhood, they don’t take their houses with them. Vacant houses are the physical vestiges of population decline, as many property-owners decided or were compelled by misfortune to abandon their properties. However, the ramifications of those properties rest on the shoulders of the people who currently live among the vacancies, as they are the ones who are reminded of and dealing with that loss of occupied housing every single day. For some neighborhoods, the problem has become overwhelming.
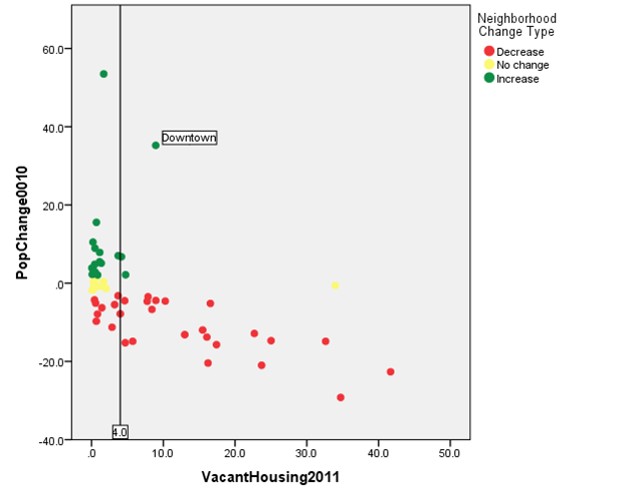
To unpack the relationship between vacant housing and population change, Figure 1 plots these two indicators together. The graphic shows all communities (except Downtown) that grew between 2000 and 2010 had vacancy rates at or below 4%. Not all communities with vacancy rates below 4% grew, as can be seen by the red dots in the plot below the threshold. This means that at the community-level, vacant and abandoned housing percentages below 4% can be considered a necessary but not sufficient condition for a neighborhood to be conducive for population growth.
So how can neighborhoods use this information? Table 2 provides the number of properties that would need to be addressed to bring the neighborhood to 4% vacancy. For Sandtown-Winchester/Harlem Park more than 1,800 properties need to be either rehabilitated or demolished or greened in order to achieve a level of vacancy more favorable to population growth.
| Table 2: Community Statistical Areas (CSA) with Highest Percent Vacant and Abandoned Housing in 2015 | % Vacant Housing 2015 | Number of Properties Needed to Bring CSA below 4% Vacancy |
| Sandtown Winchester/Harlem Park |
35.4% |
1,901 |
| Upton/Druid Heights |
34.0% |
649 |
| Greenmount East |
32.5% |
1,165 |
Many of Baltimore’s most vulnerable and/or disadvantaged populations are also living in neighborhoods with high rates of vacant housing, which can be thought of as an environmental injustice. Vacant housing and neighborhood disinvestment is having a similar effect on negative life outcomes as living near other environmental hazards, and we need policies and interventions in place to protect people in the same way.
The Key Recommendations to Reduce or Maintain vacant and abandoned housing below 4% in every neighborhood:
- For the 7 CSAs that have the highest rates of vacancy in 2015, communities need to plan and focus together, with city agencies and outside resources, on the best course of action in their neighborhood to create a vision for a less-than-4%-vacancy reality.
| Community | 2010 | 2015 | Percent Change | |
| Sandtown-Winchester/Harlem Park | 31.0% | 35.4% | 4.4 | |
| Upton/Druid Heights | 35.5% | 34.0% | -1.5 | |
| Greenmount East | 38.6% | 32.5% | -6.1 | |
| Southwest Baltimore | 25.2% | 28.1% | 2.9 | |
| Clifton-Berea | 24.5% | 26.7% | 2.2 | |
| Oldtown/Middle East | 40.1% | 26.6% | -13.5 | |
| Midway/Coldstream | 16.6% | 20.0% | 3.4 |
- Ensure middle vacancy neighborhoods do not cross over to high vacancy neighborhoods through preventative measures such as legal services that help all property owners record a clear and adequate will to convey ownership to a well-informed beneficiary or potentially as a donation to the City or a community land-trust.
| Community | 2010 | 2015 | Percent Change |
| Pimlico/Arlington/Hilltop | 13.1% | 14.9% | 1.8 |
| Greater Mondawmin | 10.3% | 12.3% | 2.0 |
| Downtown/Seton Hill | 8.4% | 11.6% | 3.2 |
| Washington Village/Pigtown | 8.7% | 6.8% | -1.9 |
| Westport/Mount Winans/Lakeland | 8.1% | 6.5% | -1.6 |
| Forest Park/Walbrook | 5.6% | 6.3% | 0.7 |
| Brooklyn/Curtis Bay/Hawkins Point | 3.7% | 6.2% | 2.5 |