
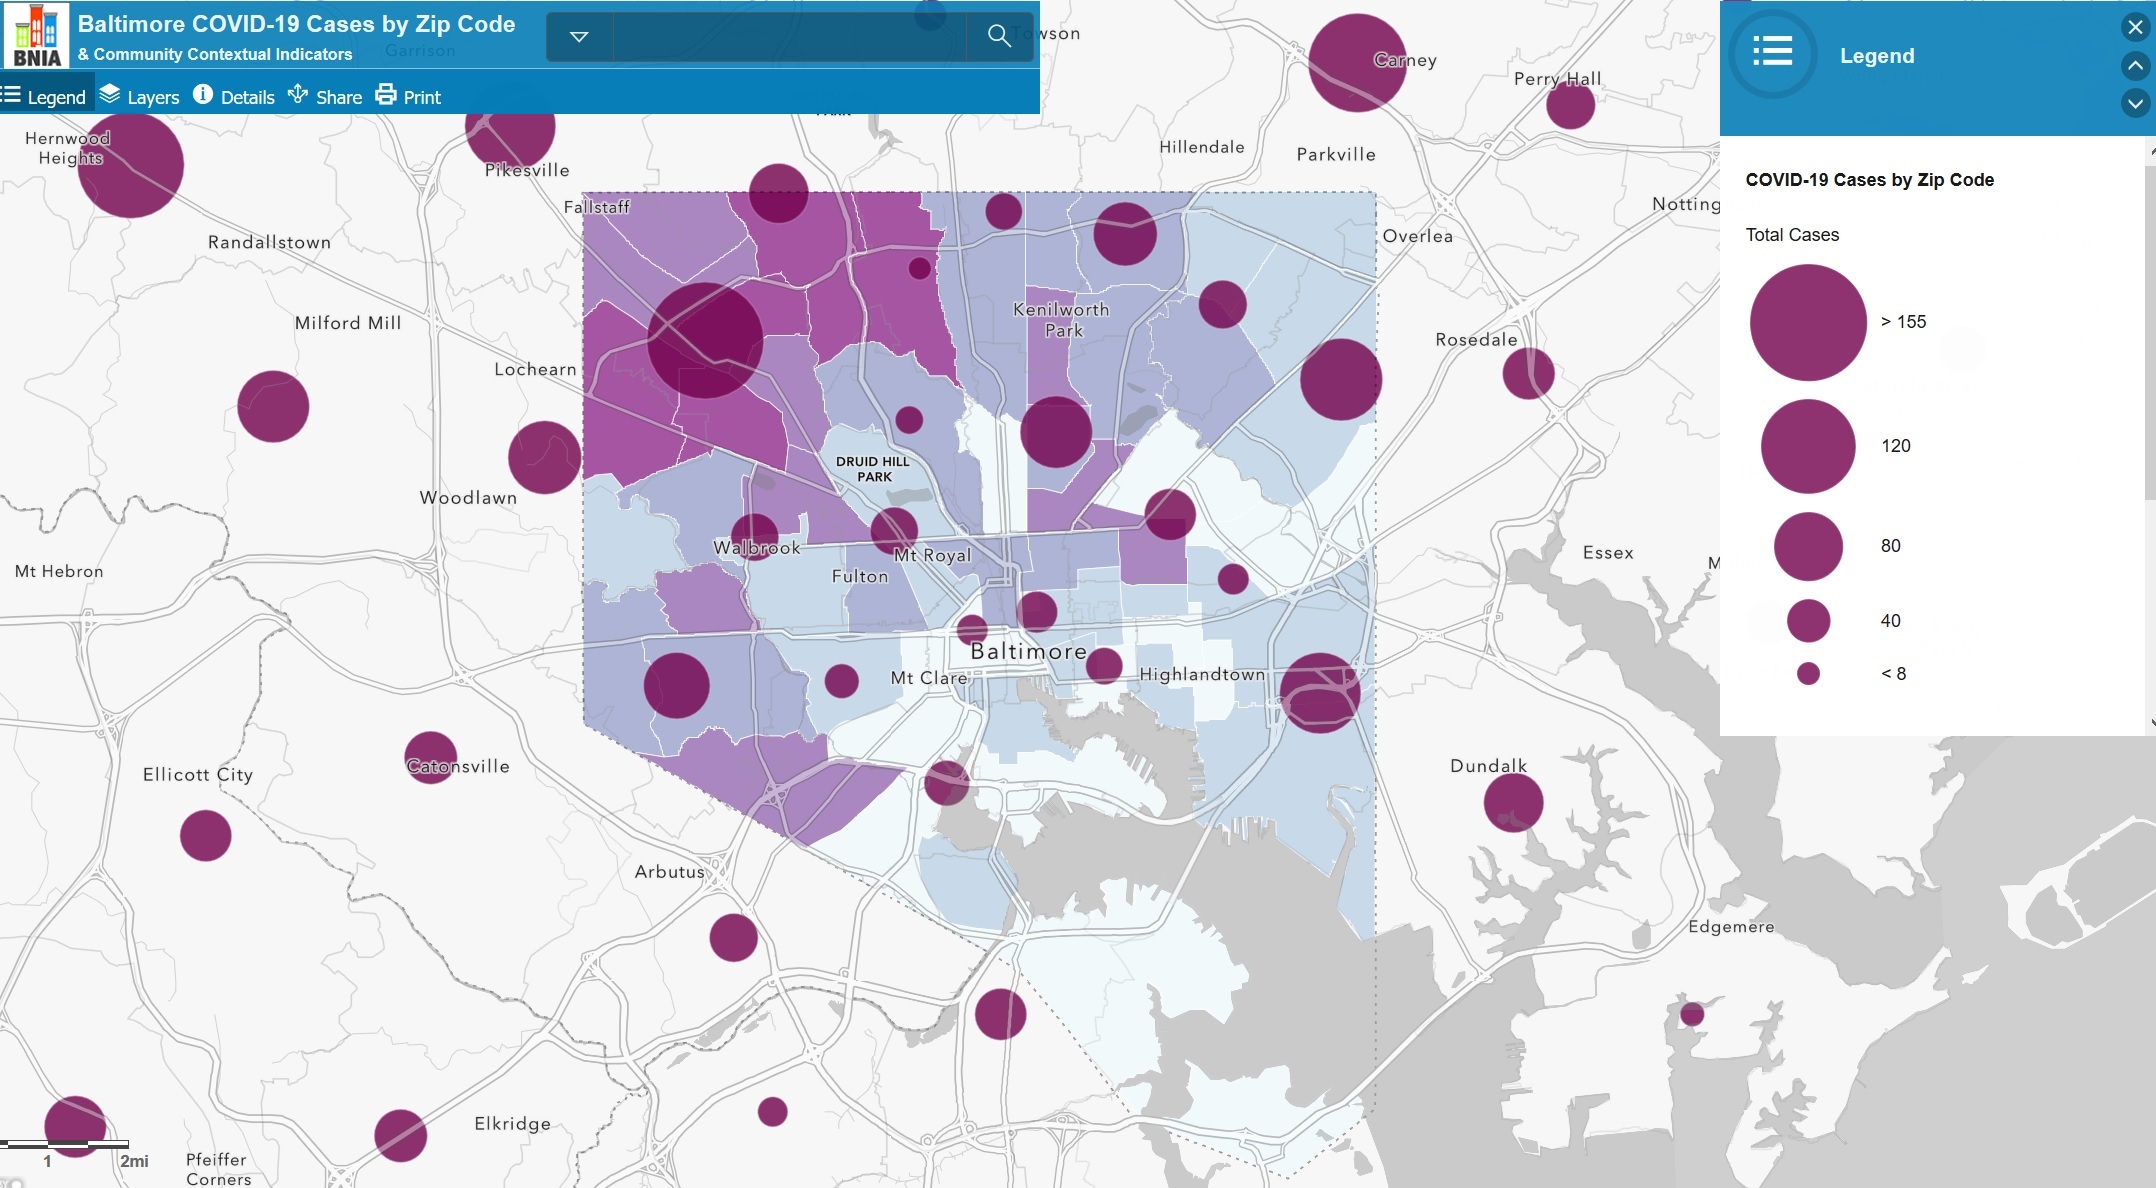
Click to Explore the map
The Baltimore Neighborhood Indicators Alliance – Jacob France Institute (BNIA-JFI) has created this tool to visualize COVID-19 cases by zip code alongside community indicators tracked in our annual Vital Signs report to create an understanding of the communities vulnerable to and impacted by coronavirus.
Age
Indicator: Percent of Population 65 Years and Over
This statistic measures the percentage of the population aged 65 and over, showing concentrations of seniors living in Baltimore City. According to data published by the CDC, hospitalization rates associated with COVID-19 increase with age, with seniors being the must vulnerable population.
Indicator: Percent of Population Aged 5-17
According to the latest estimates, approximately 14% of Baltimore’s population is represented by school-aged children. With the closing of public and private schools parents are taking on schooling duties and for essential workers, seeking assistance with child care.
Race/Ethnicity

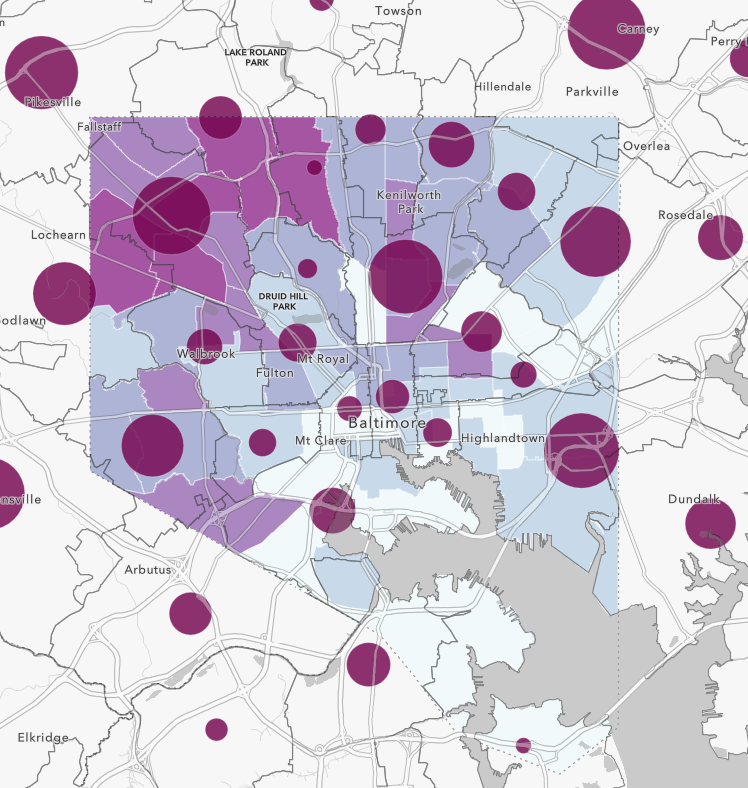
Indicator: Percent of Residents – Black/African-American
This statistic measures the percentage of residents that identify as Black/African-American. According to data published by the Maryland Department of Health, Black residents make up a disproportionate share of COVID-19 cases. The percentage of residents that are White/Caucasian and Hispanic are also provided for reference. Read more from The Baltimore Sun…
Housing Insecurity
Indicator: Percent of Households Paying Over 30% of their Income on Rent
Well beyond the estimated 3,000 homeless persons, nearly 10% of all households in Baltimore are housing insecure. Baltimore has a wait list of 14,000 applications for housing assistance, and the list is now closed to new applicants because the average wait time is more than five years. In 2018, the percentage of households paying more than 30% of their total household income on rent was 48.8%. This level of housing insecurity highlights households that are already in a vulnerable financial situation, one that may be made worse as unemployment continues to rise due to COVID-19.
Economic Insecurity

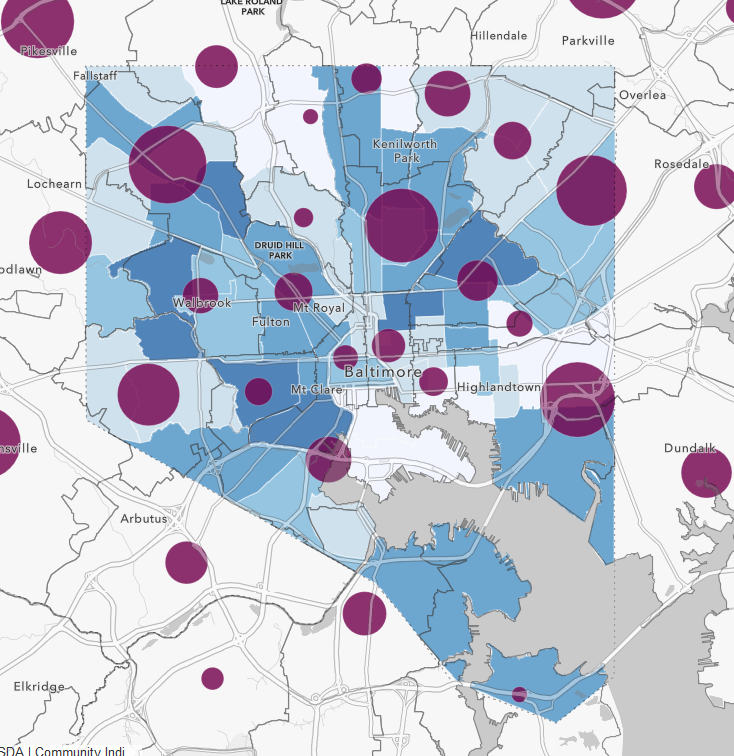
Indicator: Percent of Households Earning Less than $25,000
This statistic measures the percentage of households earning less than $25,000 per year. Too many of Baltimore’s working families are living in a state of persistent financial insecurity, one emergency away like the current pandemic situation from falling into debt or losing a home. In Baltimore City, 16.6% of family households live in poverty; however, more than 55% are liquid asset poor, which means they do not have enough savings to live above the poverty level for three months if they suffer an income disruption such as a job loss or medical crisis.
Indicator: Percent of Households with No Vehicle Available
In Baltimore City, 28.9% of households do not have access to a vehicle. The lack of transportation options for essential workers traveling to their job, families visiting the doctor, and others traveling to get groceries or prescriptions results in higher public transportation demand despite service reductions by MTA Maryland.
Lack of Digital Access
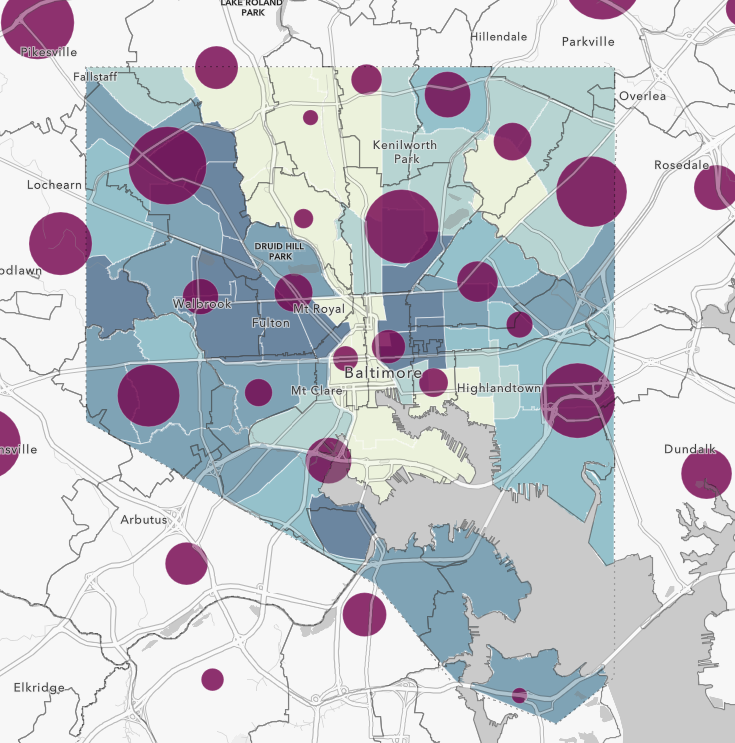
Indicator: Percent of Households with No Internet Available
According to 2018 estimates that approximately 22% of Baltimore City households do not have access to the internet at home. The lack internet prevents households in Baltimore from being able to work, shop or access online educational resources for students from home.
For more information about coronavirus in Maryland, please visit coronavirus.maryland.gov.
More resources can be found below:
- Baltimore City Emergency Food Insecurity Response
- United Way of Central Maryland 211 Hotline
- Mayor’s Office of Employment Development
- Baltimore Community Foundation COVID 19 Fund
- Maryland COVID-19 Emergency Relief Fund Programs for Businesses