
By Bozkurt Karaoglan
“In 2019, for everyone thousand residents in Downtown/Seton Hill area of Baltimore City, there were 25 fast food outlets per 1000 residents. As of the last census, the total population of this area is 9,448. In the Dorchester/Ashburton area, there was only 1 fast-food outlet per one thousand residents in the same year, and the population is 10,441.”
Above information comes from BNIA (Baltimore Neighborhood Indicators Alliance) whose mission is to provide “reliable and actionable quality of life indicators for Baltimore’s neighborhoods.” An indicator is a set of statistics that measures social phenomena. The name of the indicator given above is “Fast Food Outlet Density (per 1,000 Residents)”, and the statistics for this indicator were collected by Johns Hopkins University, Center for a Livable Future. Although the number of the indicators varied over the years because of availability and funding, since 2009, BNIA have provided at least 180 different indicators that measured our city under 8 different topics. Indicators are vital to any community, because it is through indicators that the residents can have valid and actionable data about their communities. The funding of schools, police departments, city spending on social programs, business opportunities and various other critical decisions are all made based on indicators. Most importantly, the ability to make more precise predictions about indictors can significantly impact the decisions made about our communities.
Project goal
My project was to apply an artificial neural network algorithm (ANN) to BNIA’s indicators published between the years 2010 and 2019 and attempt to predict the Part 1 Crime indicator for the year 2020 . By definition the Part 1 crime rate captures incidents of homicide, rape, aggravated assault, robbery, burglary, larceny, and auto theft that are reported to the Police Department.
Tools and Environment
The data tools and coding environment I used during this project were: Python general purpose programming language for Pearson Correlation calculations and correlation heatmap visualizations, R statistical programming language for multiple regression analysis, Excel for data cleaning, raw data transformation, data storage and Google Colab for the coding environment.
Data source and type
All my data came from BNIA`s website and it is publicly available at https://bniajfi.org/. BNIA stores and offers their data on the website in both PDF (portable document format) and Excel spreadsheets formats. My data type was all float type numeric data which included rates per one thousand, and percentages. I did not have any text data. During the preparation phase of my project, I excluded the date type data from my analysis. Out of more than 180 indicators I chose 25 indicators from 3 different topics.
Data cleaning and preparation
Although BNIA provides a single master Excel file which contains the data for all indicators starting from 2009, I had to prepare a separate Excel spreadsheet. In my Excel sheet I placed 10 years’ worth of historical data for a single indicator under the same column. My first column had the names of 55 community Statistical Areas (CSA) that make up the Baltimore City. I had 25 columns/variables with 55 rows/observations in my Excel spreadsheet. BNIA`s original data for my selected indicators was clean and standardized. I did not have to do any data cleaning or transformations. I rounded my data values to two digits and kept this format uniformed throughout the analysis.
What is a neural network algorithm?
An artificial neural network algorithm (ANN) is a mathematical tool that can predict outcomes based on historical data. Analogous to the workings of actual neuronal activity in the human brain, ANN is widely used for pattern recognition, classification, and optimization problems.
BNIA`s indicators and initial attempt
Simple neural network with one hidden layer to demonstrate the idea behind neural nets

My project had the simple hypothesis that more than 180 indicators and 10 years` worth of historical data for each indicator can be treated as inputs in a neural network algorithm and successfully predict the value of Part 1 Crime indicator solely based on other indicators. In the above image, all the inputs represent the historical data about indicators; the hidden layer represents the intermediary level where the weights are assigned to each input and later adjusted; and finally, the output layer represents the prediction.
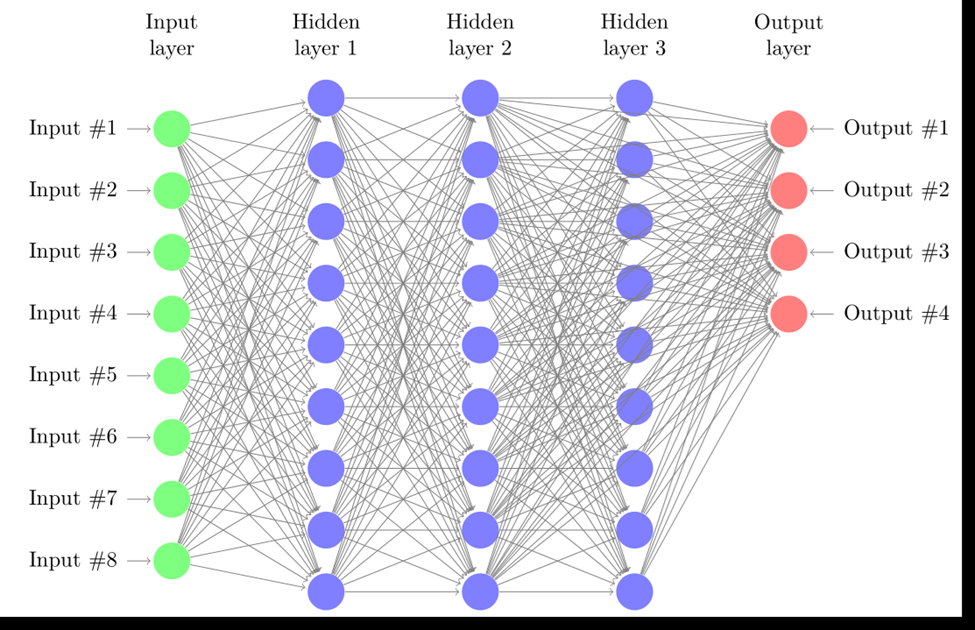
Complex neural network with three hidden layers
Change of course because more preparations needed
Building a neural network from scratch proved to be more time consuming than I expected. Given the time allotted for my project, I had to revise my initial goal to predict Part 1 Crime using ANN. After discussing the issue with my project sponsor, I broadened the scope of my project and made it a two-part project. Due to time constrictions, we decided to prepare and run a multiple regression analysis for the first part of the project where we made a prediction for Part1 Crime rate for the year 2020. We relegated the task of building a neural network as the second part of the project, albeit an ongoing one even after the deadline for our project.
Running Multiple Regression Analysis
The indicators I have chosen for my project are grouped under three different topics: Crime and Safety, Census Demographics and Workforce and Development. My indicators were:
Census Demographics Indicators 2010-2019
1-Percent Population (25 Years and over) with a Bachelor’s Degree or Above
2-Percent of Children Living Below the Poverty Line
3-Percent of Family Households Living Below the Poverty Line
4-Percent of Households Earning $25,000 to $40,000
5-Percent of Households Earning $40,000 to $60,000
6-Percent of Households Earning $60,000 to $75,000
7-Percent of Households Earning Less than $25,000
8-Percent of Households Earning More than $75,000
9- Total Population
Crime and Safety Indicators 2010-2019
1-Number of Automobile Accident Calls for Service per 1,000 Residents
2-Number of Common Assault Calls for Service per 1,000 Residents
3-Number of Gun-Related Homicides per 1,000 Residents
4-Number of Narcotics Calls for Service per 1,000 Residents
5-Number of Shootings per 1,000 Residents
6-Part 1 Crime Rate per 1,000 Residents (Dependent Variable)
7-Property Crime Rate per 1,000 Residents
8-Rate of Street Light Outages per 1,000 Residents
9-Violent Crime Rate per 1,000 Residents
Workforce and Economic Development Indicators 2010-2019
1- Percent Population (25 Years and over) with a Bachelor’s Degree or Above
2-Percent Population (25 Years and over) With High School Diploma and Some College or Associates Degree
3-Percent Population (25 Years and over) With Less Than a High School Diploma or GED
4-Percent Population 16-64 Employed
5-Percent Population 16-64 Not in Labor Force
6-Percent Population 16-64 Unemployed and Looking for Work
Dependent Variable
As highlighted above the variable we were trying to predict was Part 1 Crime Rate per 1000 Residents. To check for linearity by outputting scatterplot I used R code
ggpairs(data=my_data, columns=1:25, title=” Scatterplot for chosen indicators”)
To calculate correlations and outputting a correlation matrix, I used Python code
Partial screenshot of Python code used to create a correlation matrix

To diagnose collinearity, I calculated variance inflation factors (VIF) among my variables using Python’s ‘statsmodel’ package and eliminated all variables which scored higher than 10. The threshold 10 is the most used threshold for VIF. The VIF is the most frequently used statistical test for diagnosing multicollinearity in a set of regression variables.
Partial screenshot of Python code used to calculate VIF scores

To check for heteroskedasticity and run the regression, I used R code
Partial screenshot of R code

Conclusion: Causality vs. Linearity and Social vs. Mathematical
The linear regression yielded a meaningful prediction for Part 1 Crime Rate per 1,000 Residents after excluding the variables which scored above 10 for their VIF score.
However, the regression part of my project was meant to highlight the core concept of regression which made ‘prediction’ possible in the first place; and that concept is ‘linearity.’

Regression analysis can only ‘predict’ if there is a ‘linear’ relation exists between dependent and independent variables. However, in its true sense if there is a linear relation between two variables, what we are doing is not in fact ‘predicting’ but rather ‘solving’, ‘evaluating’, ‘proving’, ‘constructing’ or ‘deconstructing’ one variable from another. Because when there is a linear relation, one does not need to predict at all; one can simply solve X (independent variable) for Y (dependent variable) or evaluate X for Y and vice versa. This means regression analysis has a fundamental limitation. It excludes any non-linear relation between variables. This seemingly trivial point becomes important in designing statistical models with our social indicators because through statistical models we quantify and predict the quality of life in our communities and make community-wide decisions based on our predictions.
Rarely, mathematicians talk about ‘causality,’ if ever they do. They simply do not need the concept of causality as they quantify and solve their problems. And rarely do social scientists claim ‘causal’ relation between two variables even after they run a successful regression analysis with actionable predictive results. They simply assume that social events are too complex and multidimensional. The importance of ANN is that they can capture non-linear relations because they are designed analogous to the workings of actual neurons and have the advantage to employ ‘activation functions’ which conceptually imitates the ‘action potential’ of neuronal activity in the brain. This use of activation functions is what makes the ANN predictions epistemologically different. Although their ability to capture non-linear relations makes ANNs powerful mathematical tools, this difference must be researched further within the larger context of public policy and algorithms.
Moreover, quantifying the possible non-linear relations among BNIA`s indicators using ANNs may enable BNIA and similar institutions to offer new data and enable new questions about our city.
per 1,000 residents [CK1]
Although you define the indicator later on in your summary it might be good to include here [CK2]
Is this an original graphic? If not, provide source citation [CK3]
Stock pic I found online [BK4]