Children and Family Health – Other Years:
Vital Signs 17 (2017) | Vital Signs 16 (2016) | Vital Signs 15 (2015) | Vital Signs 14 (2014) | Vital Signs 13 (2013) |Vital Signs 12 (2012)
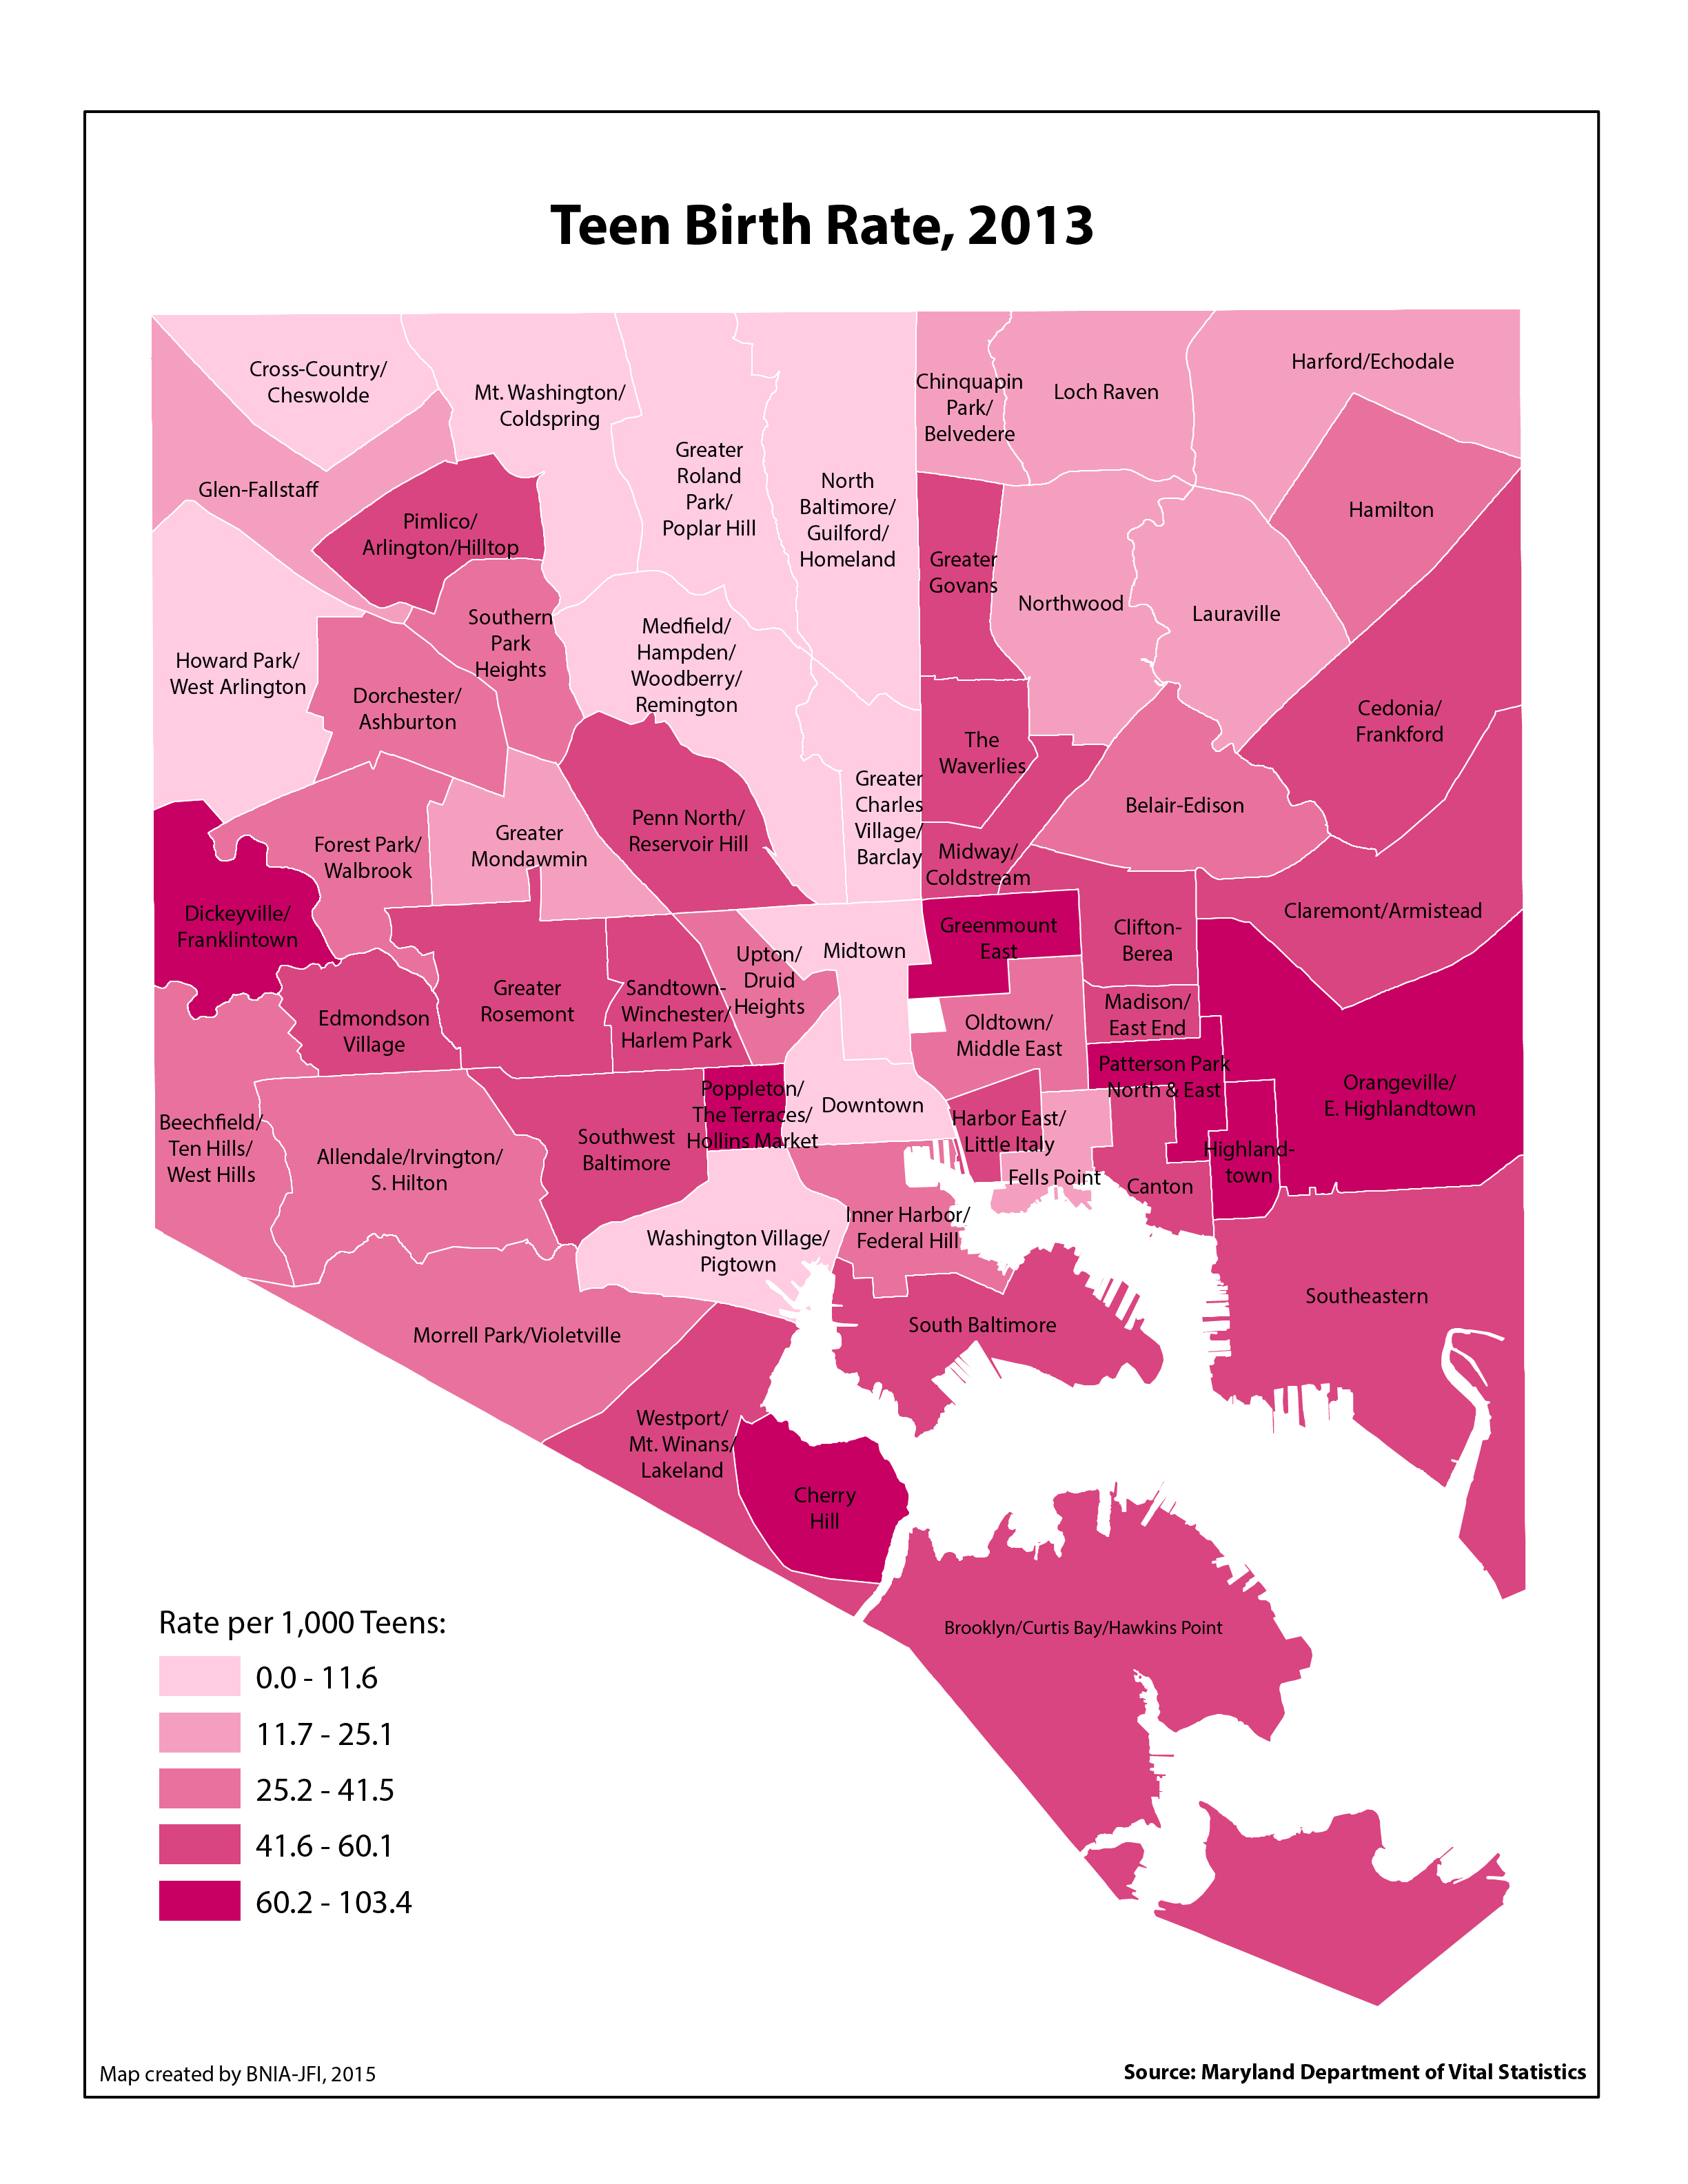
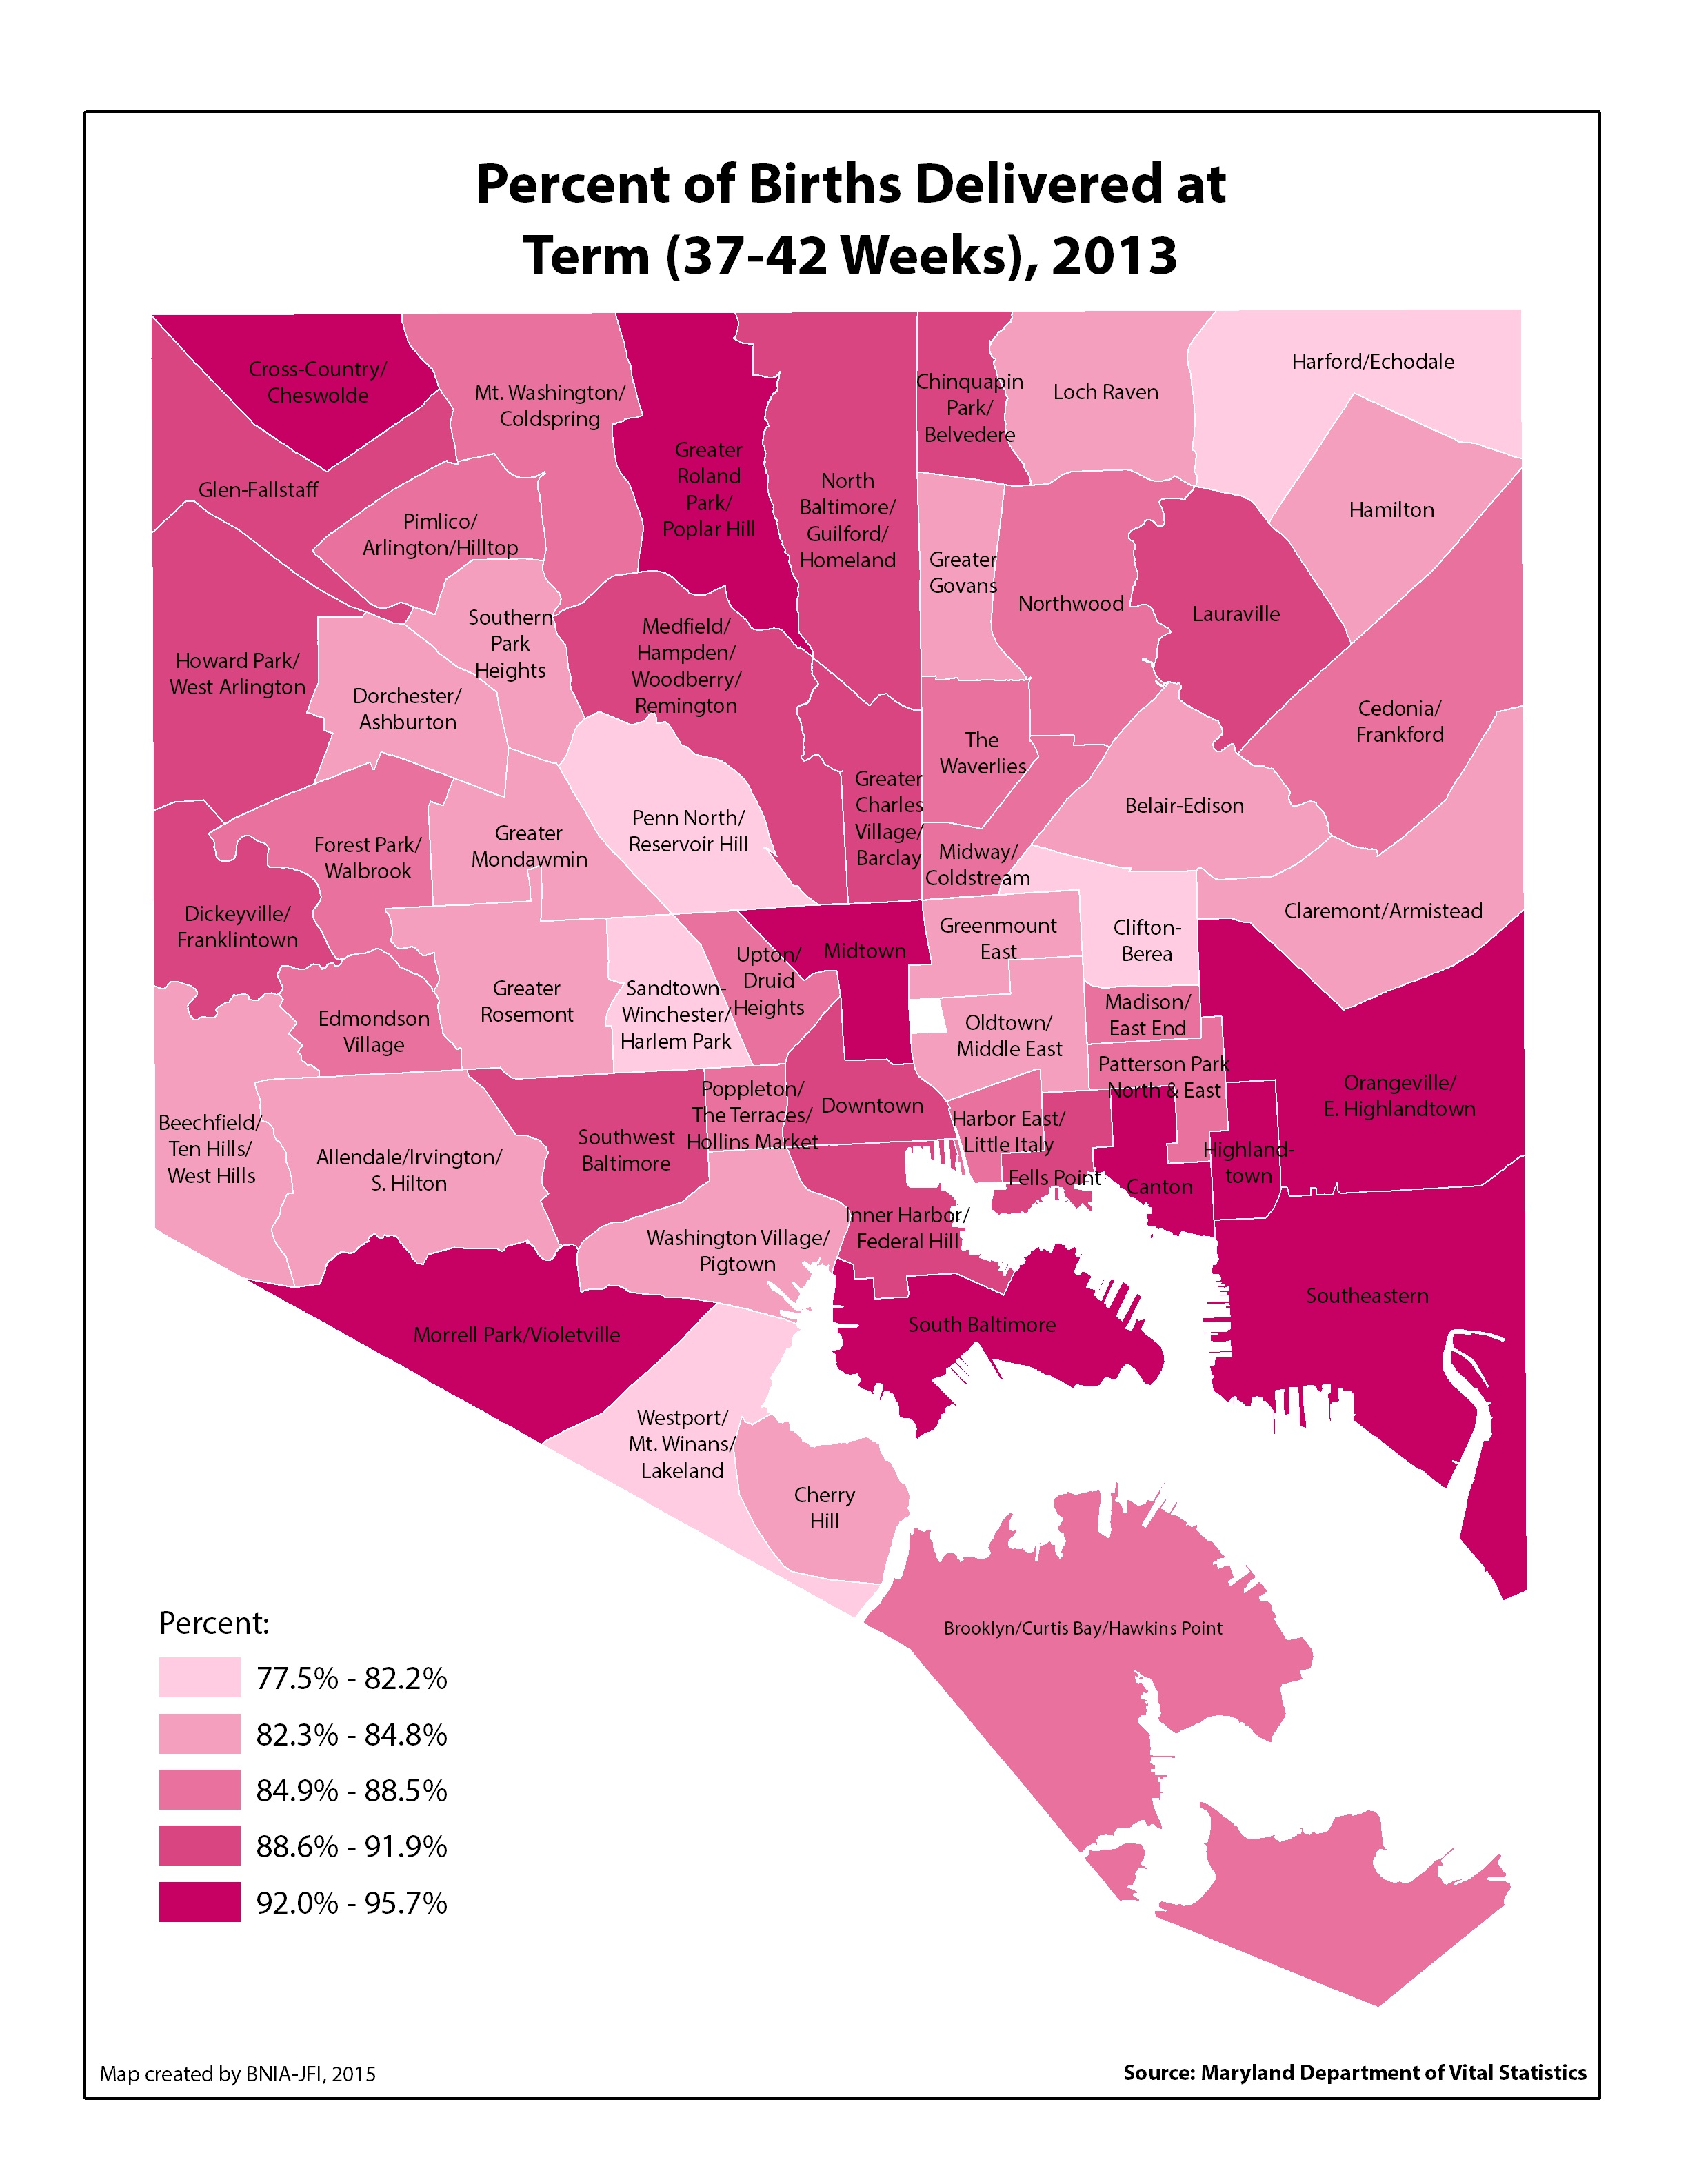
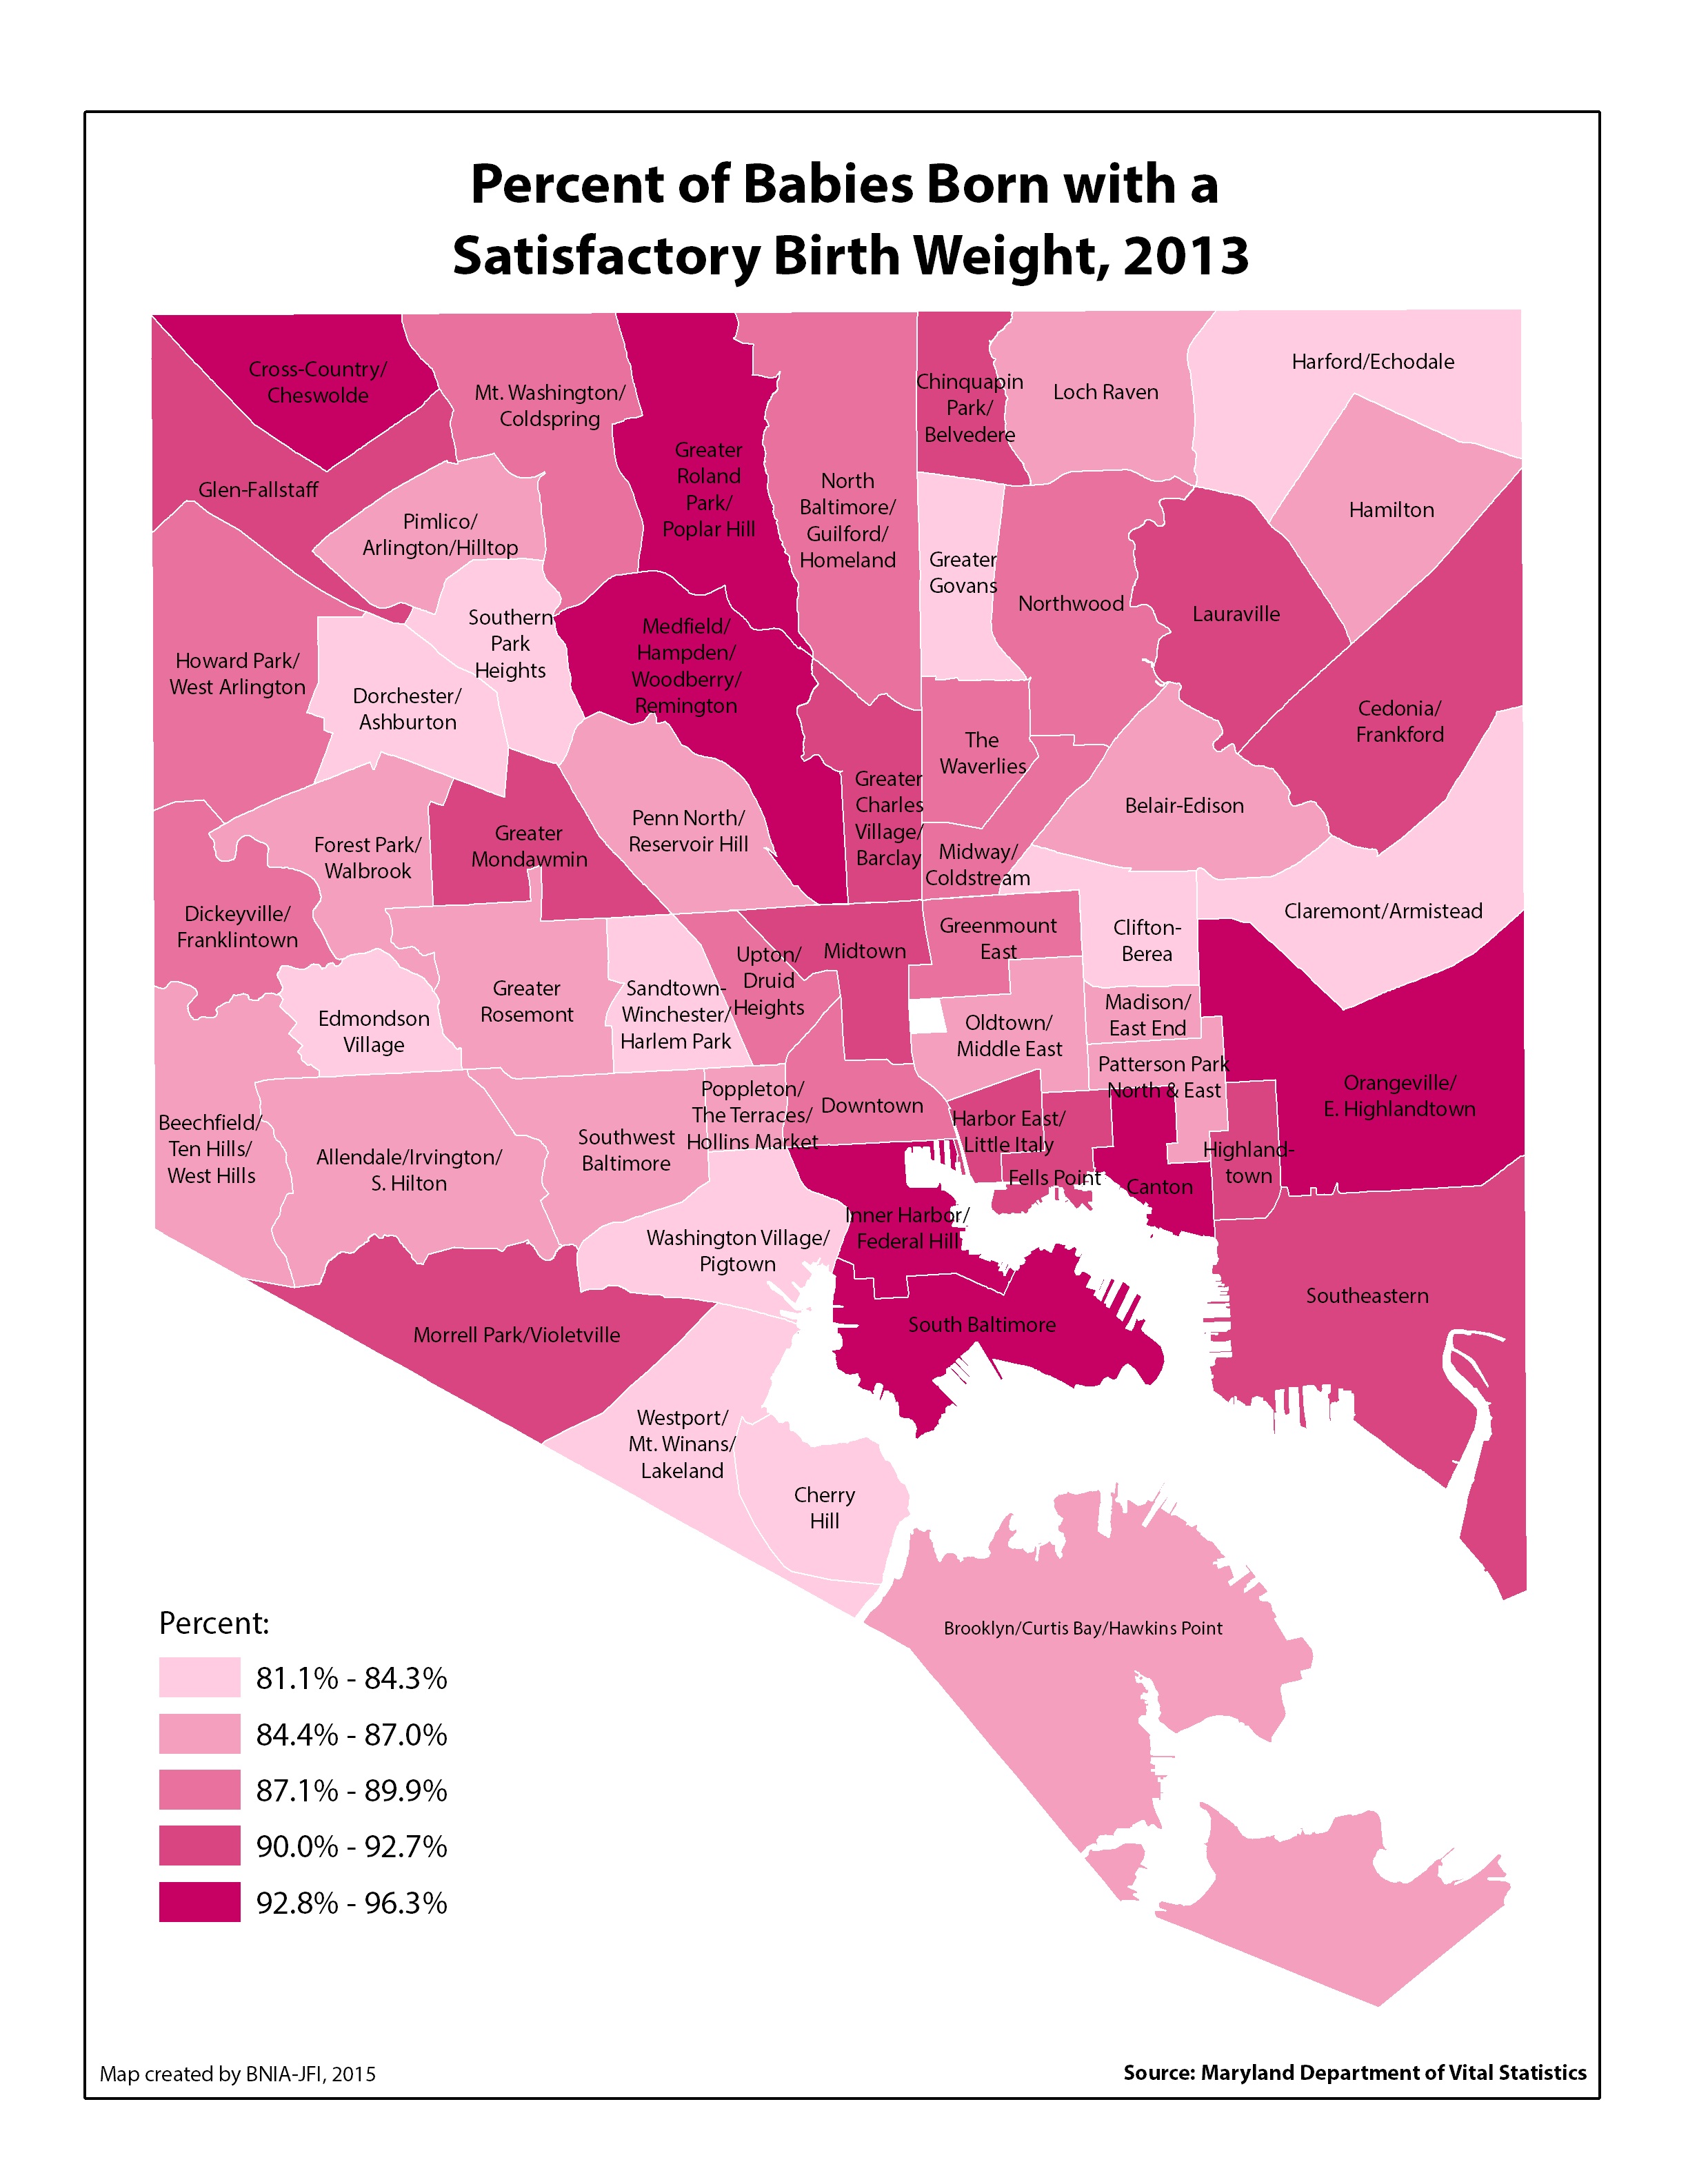
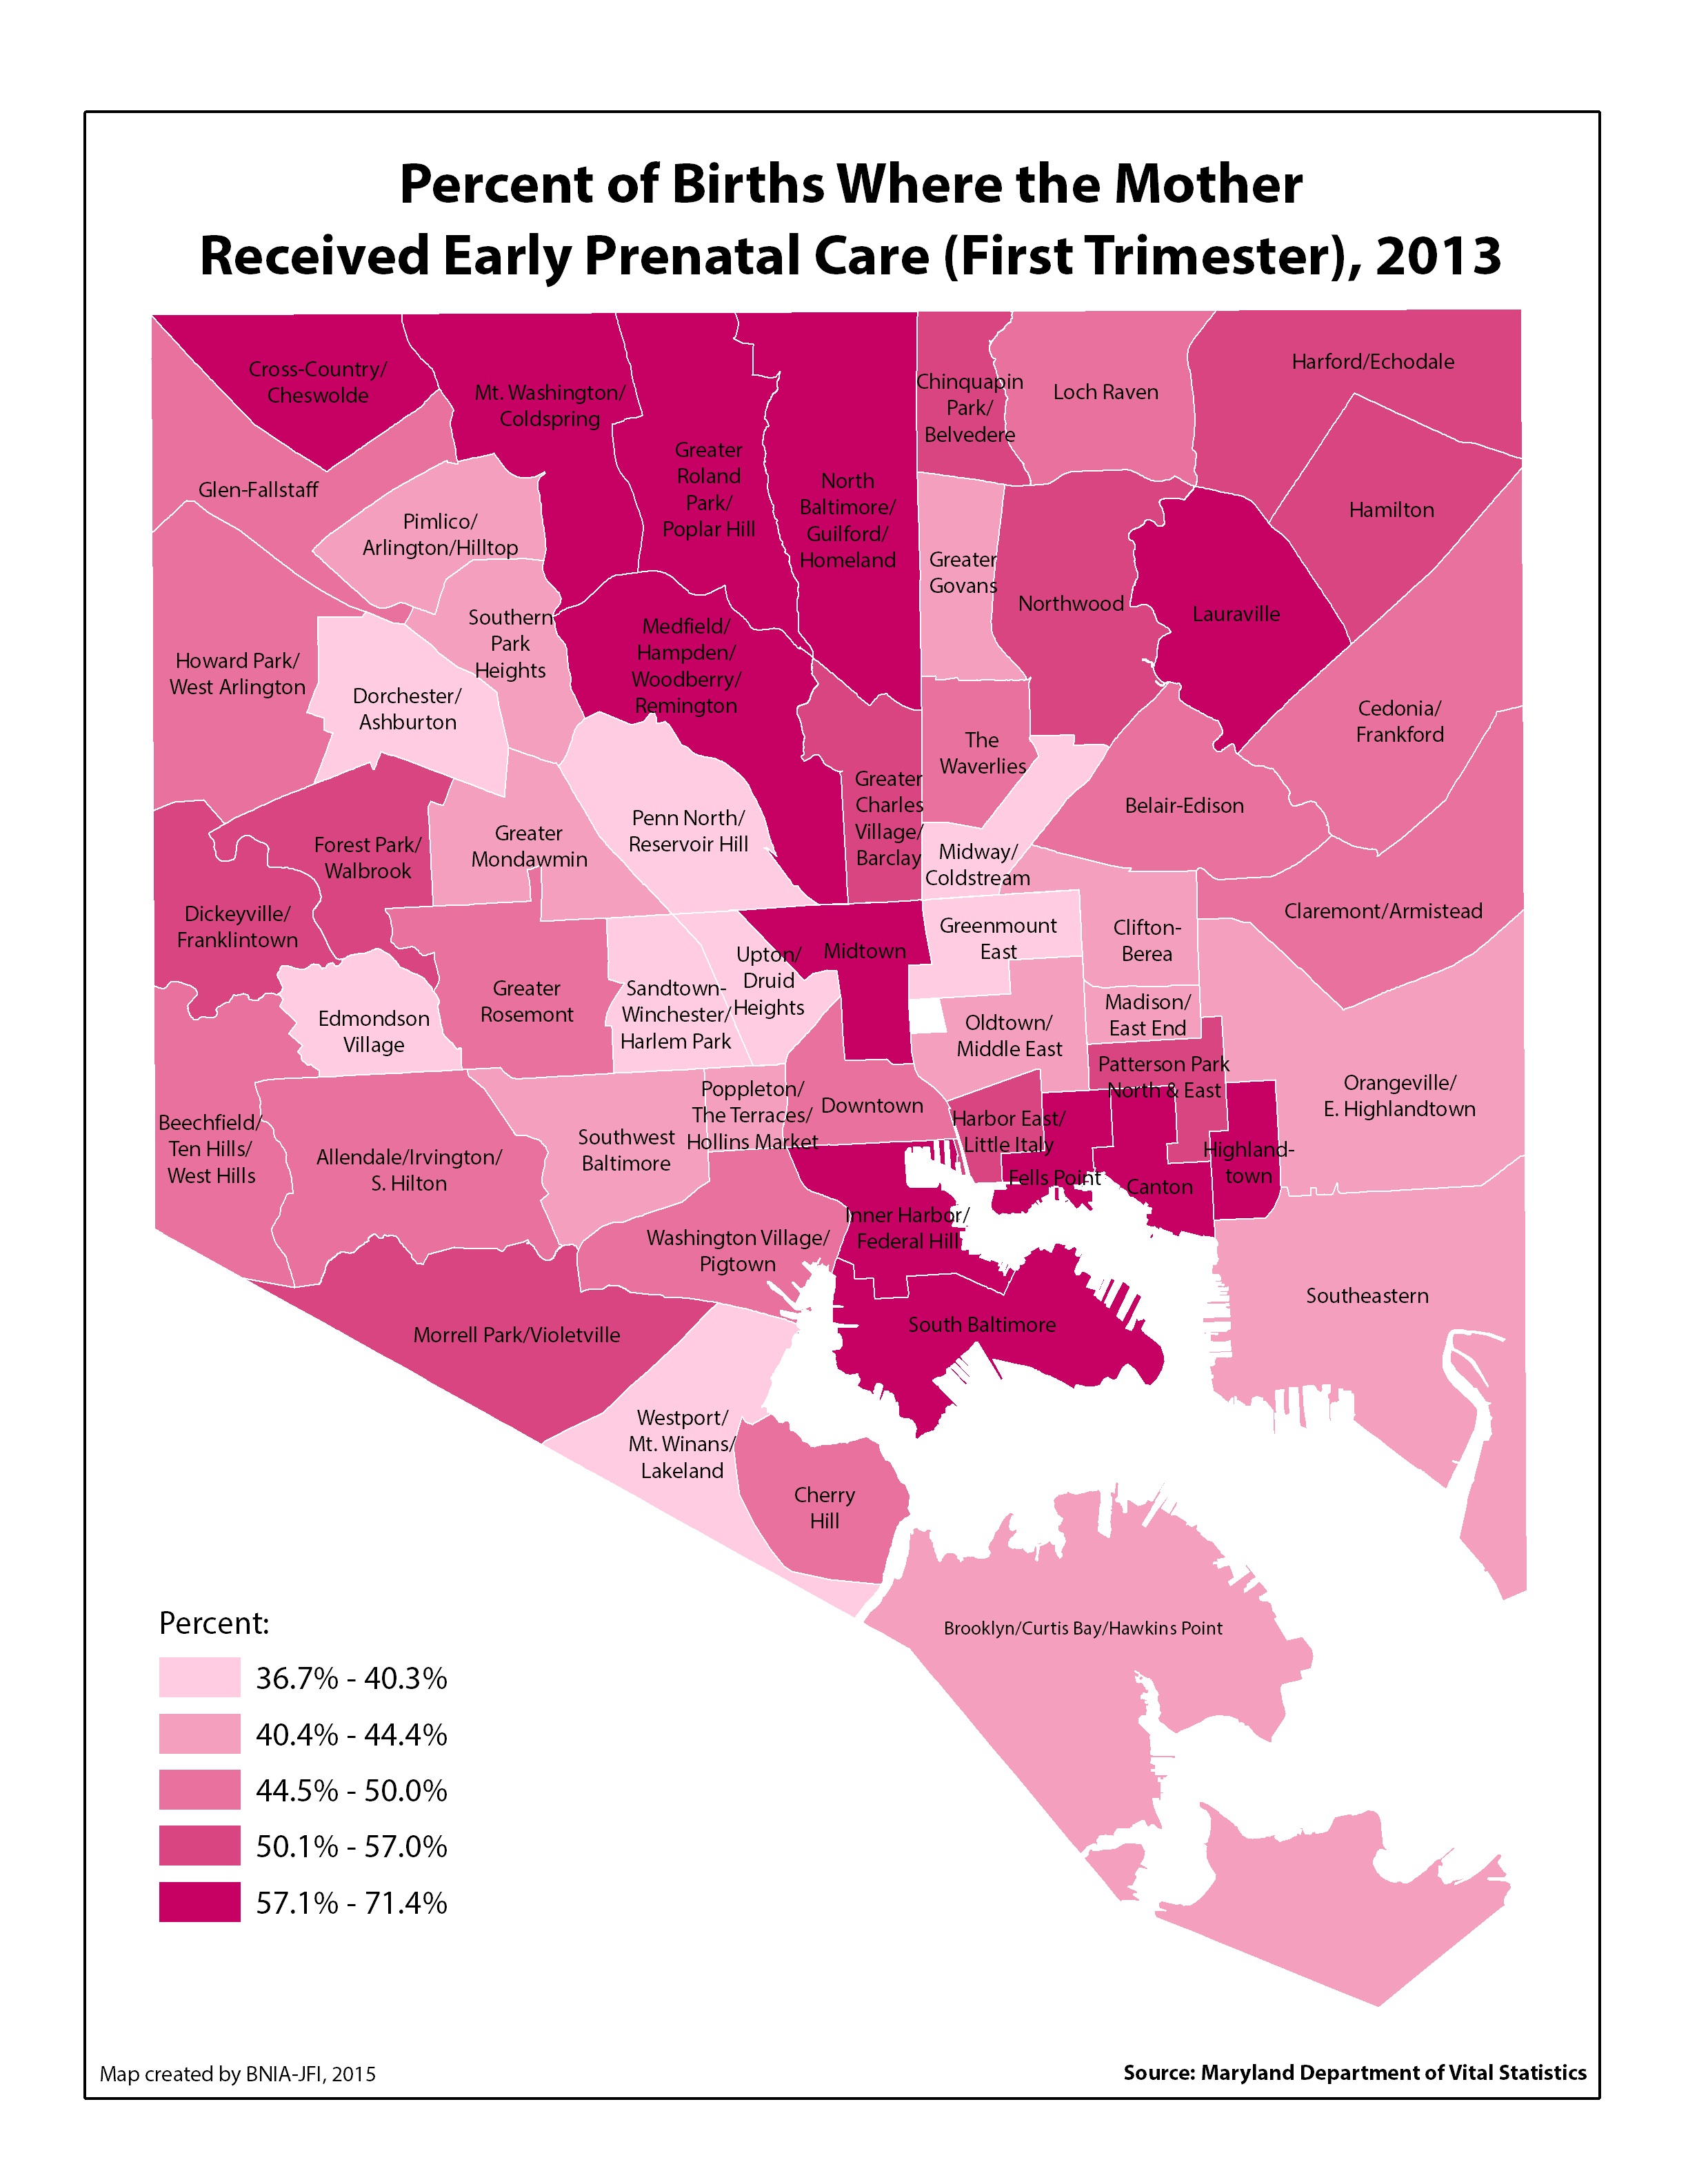
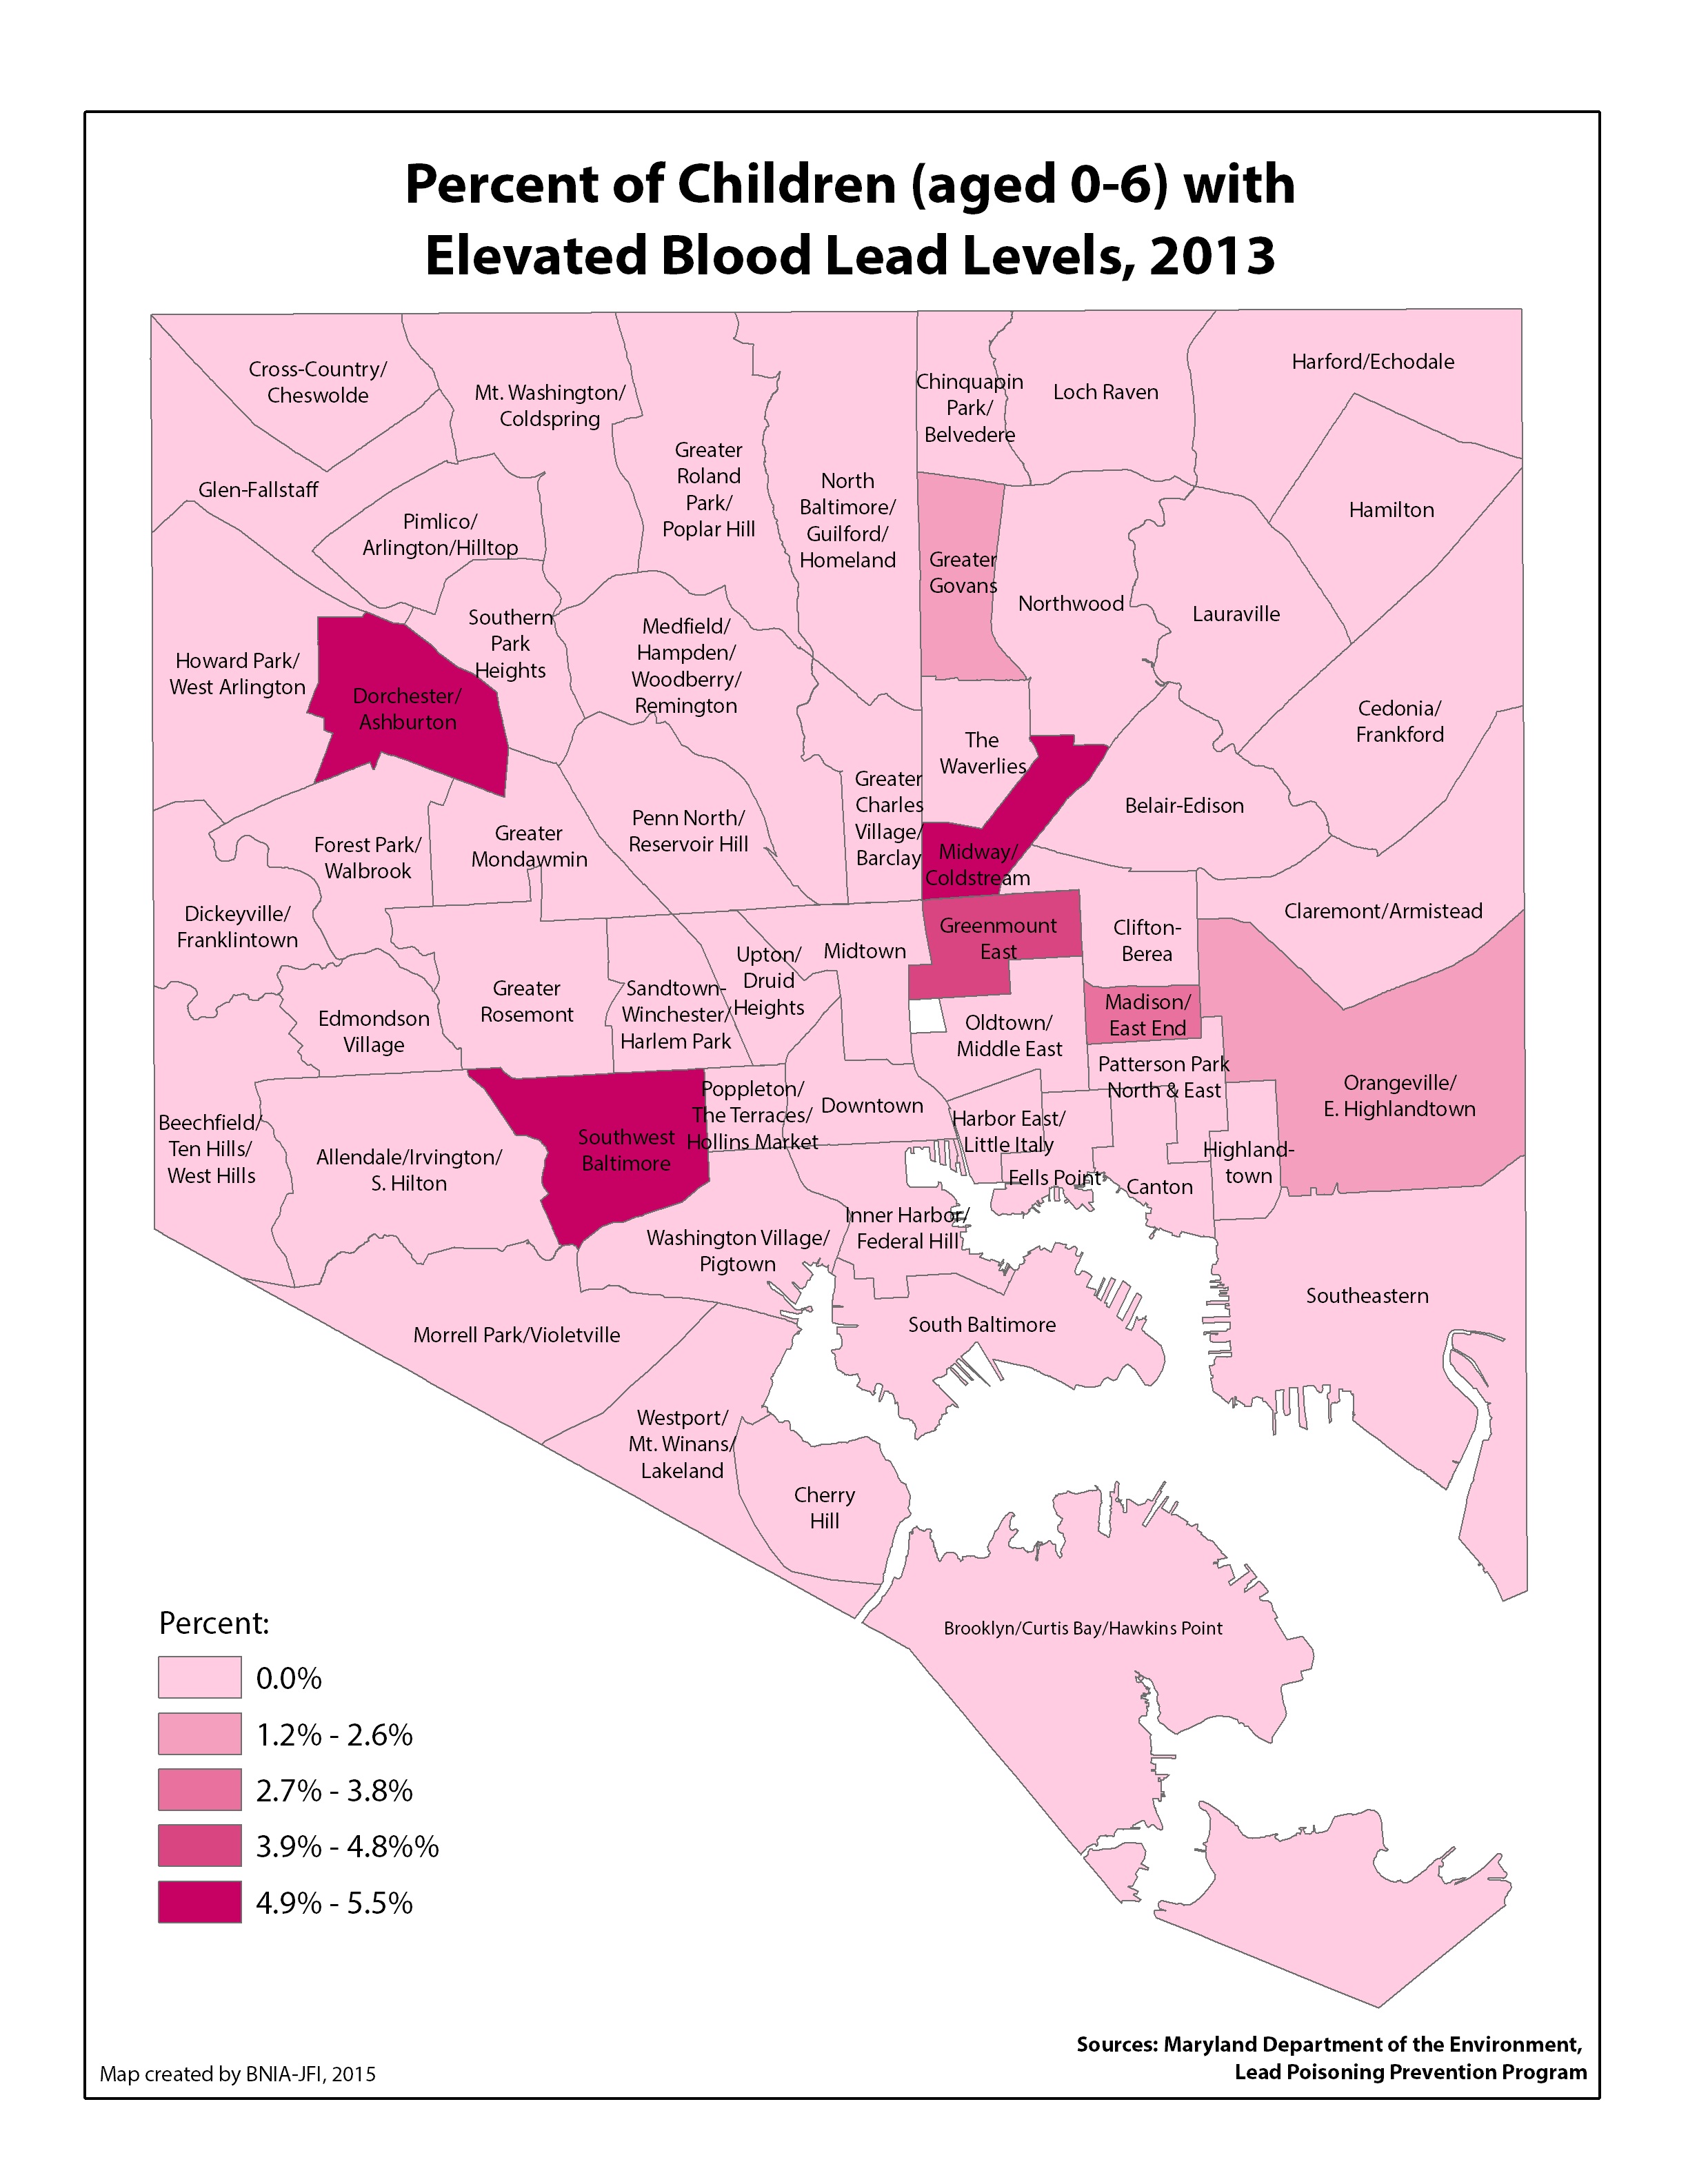
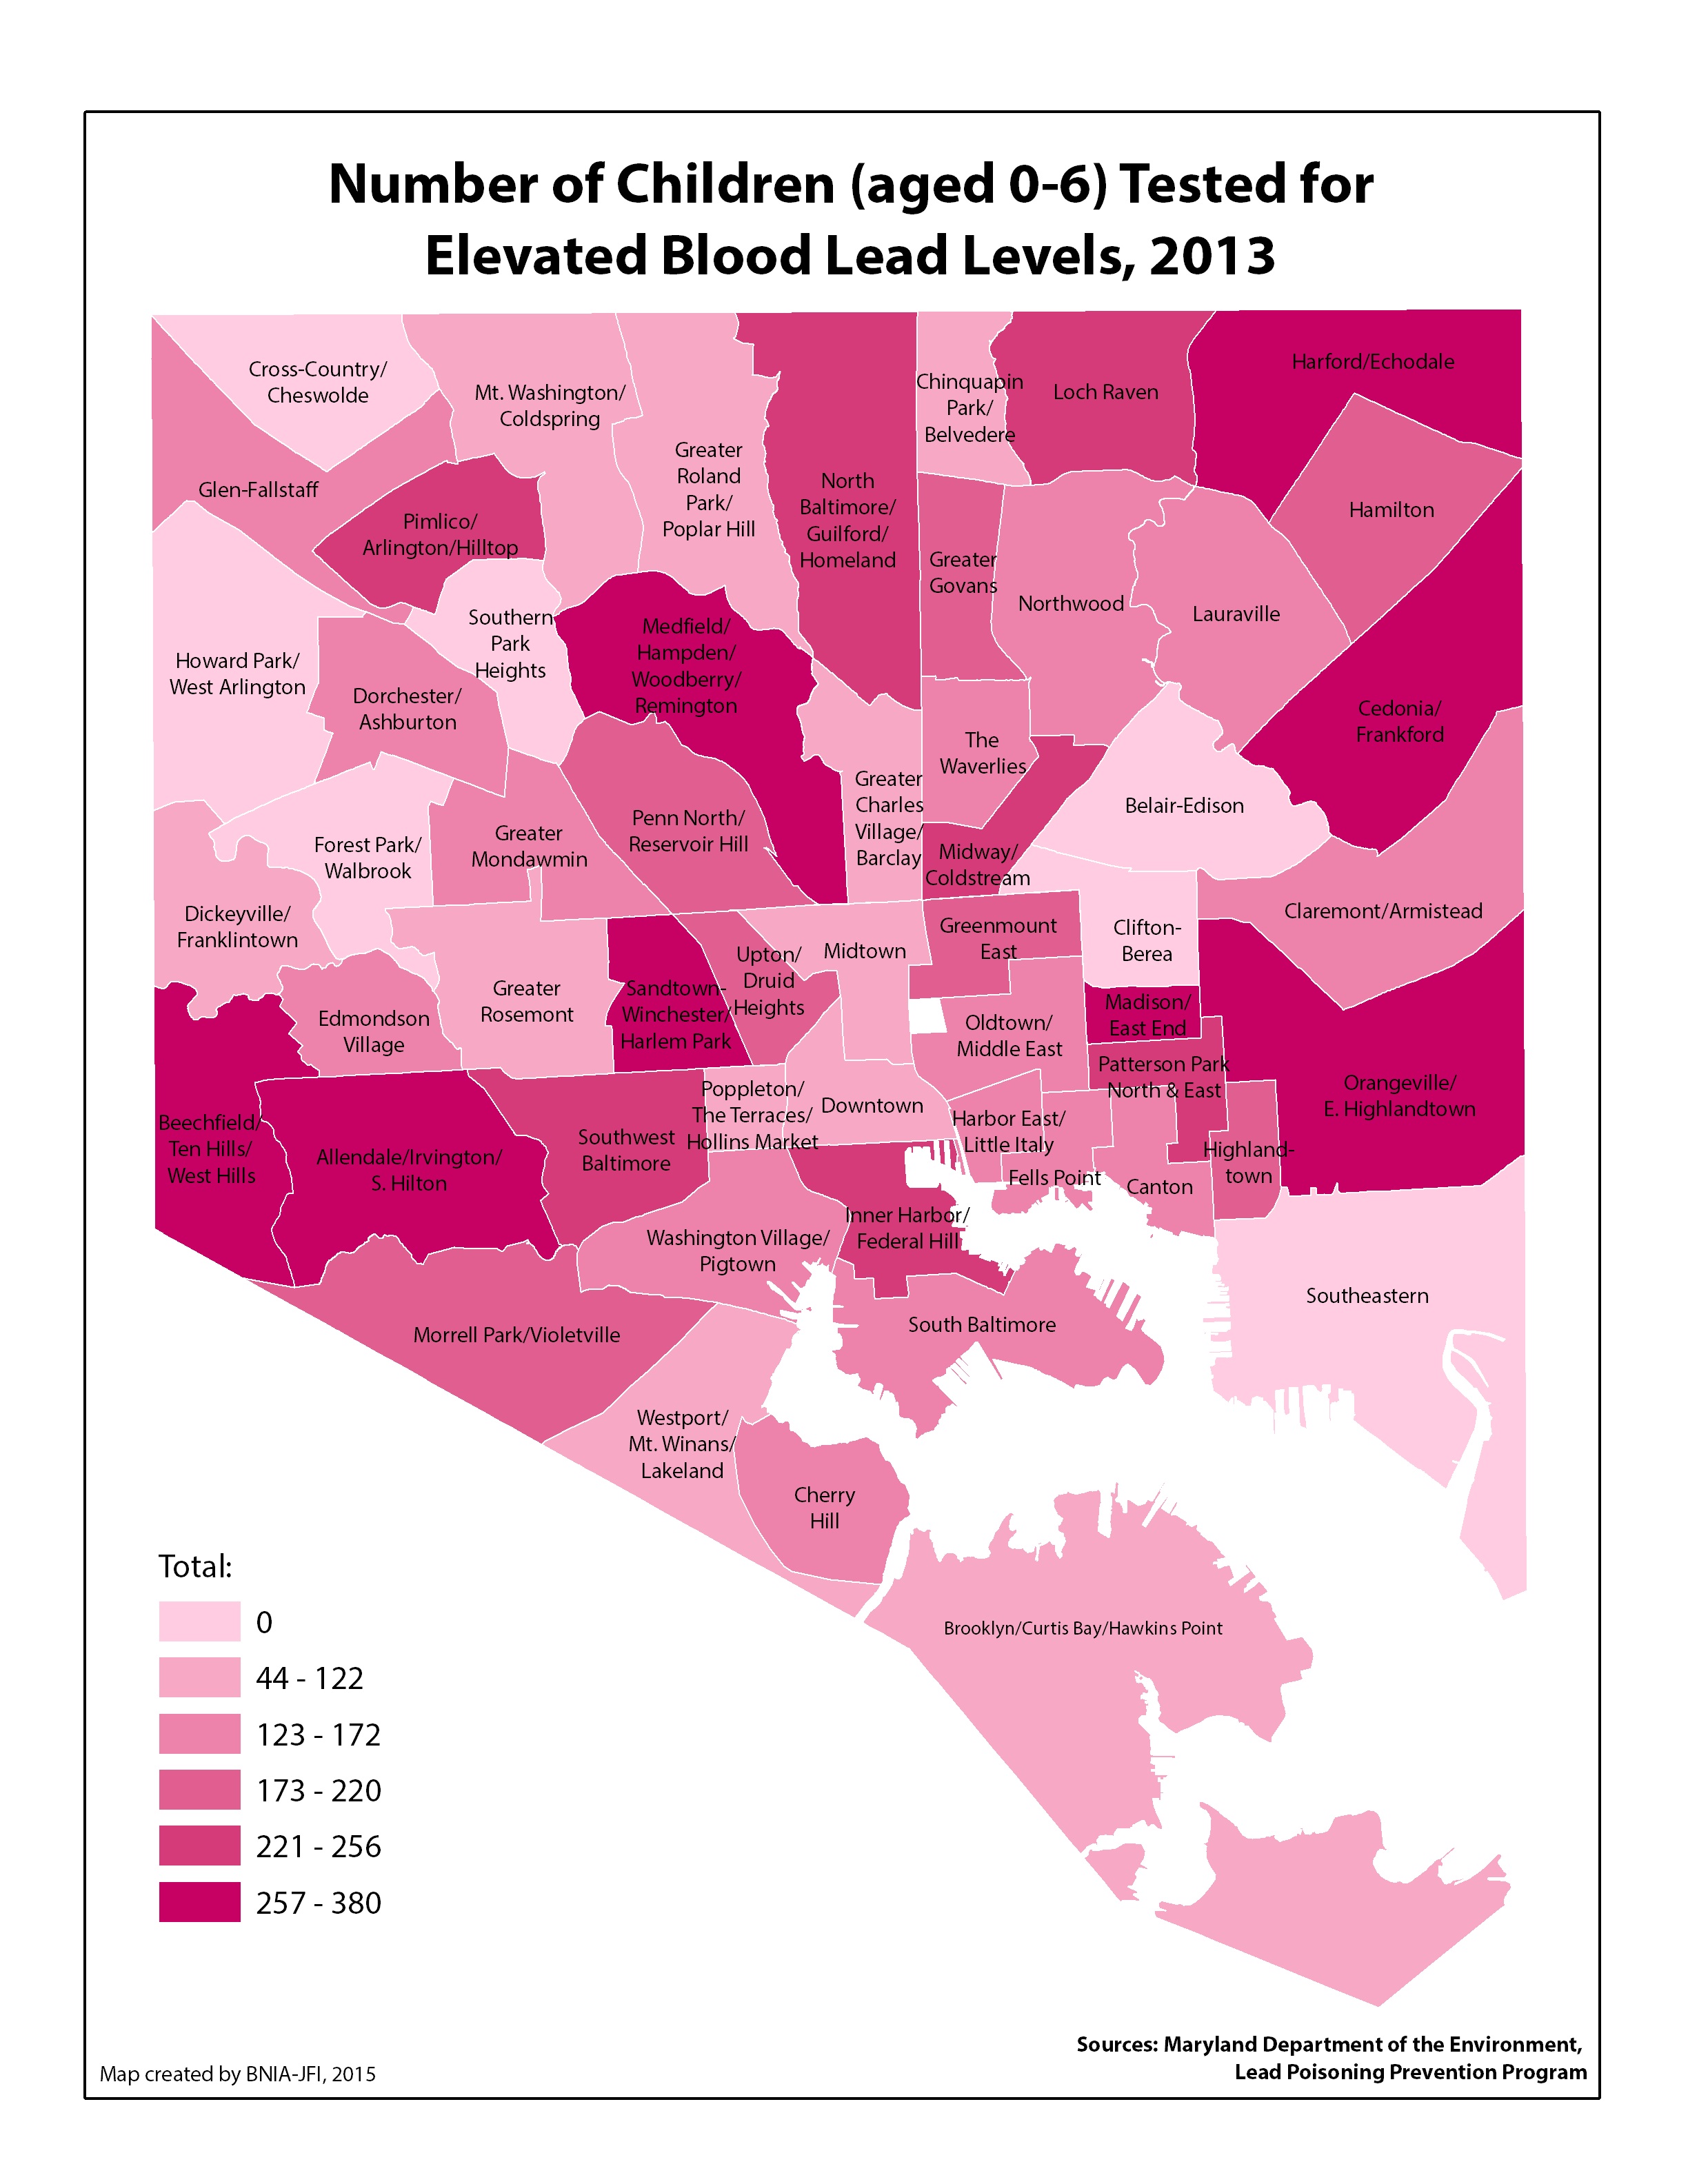
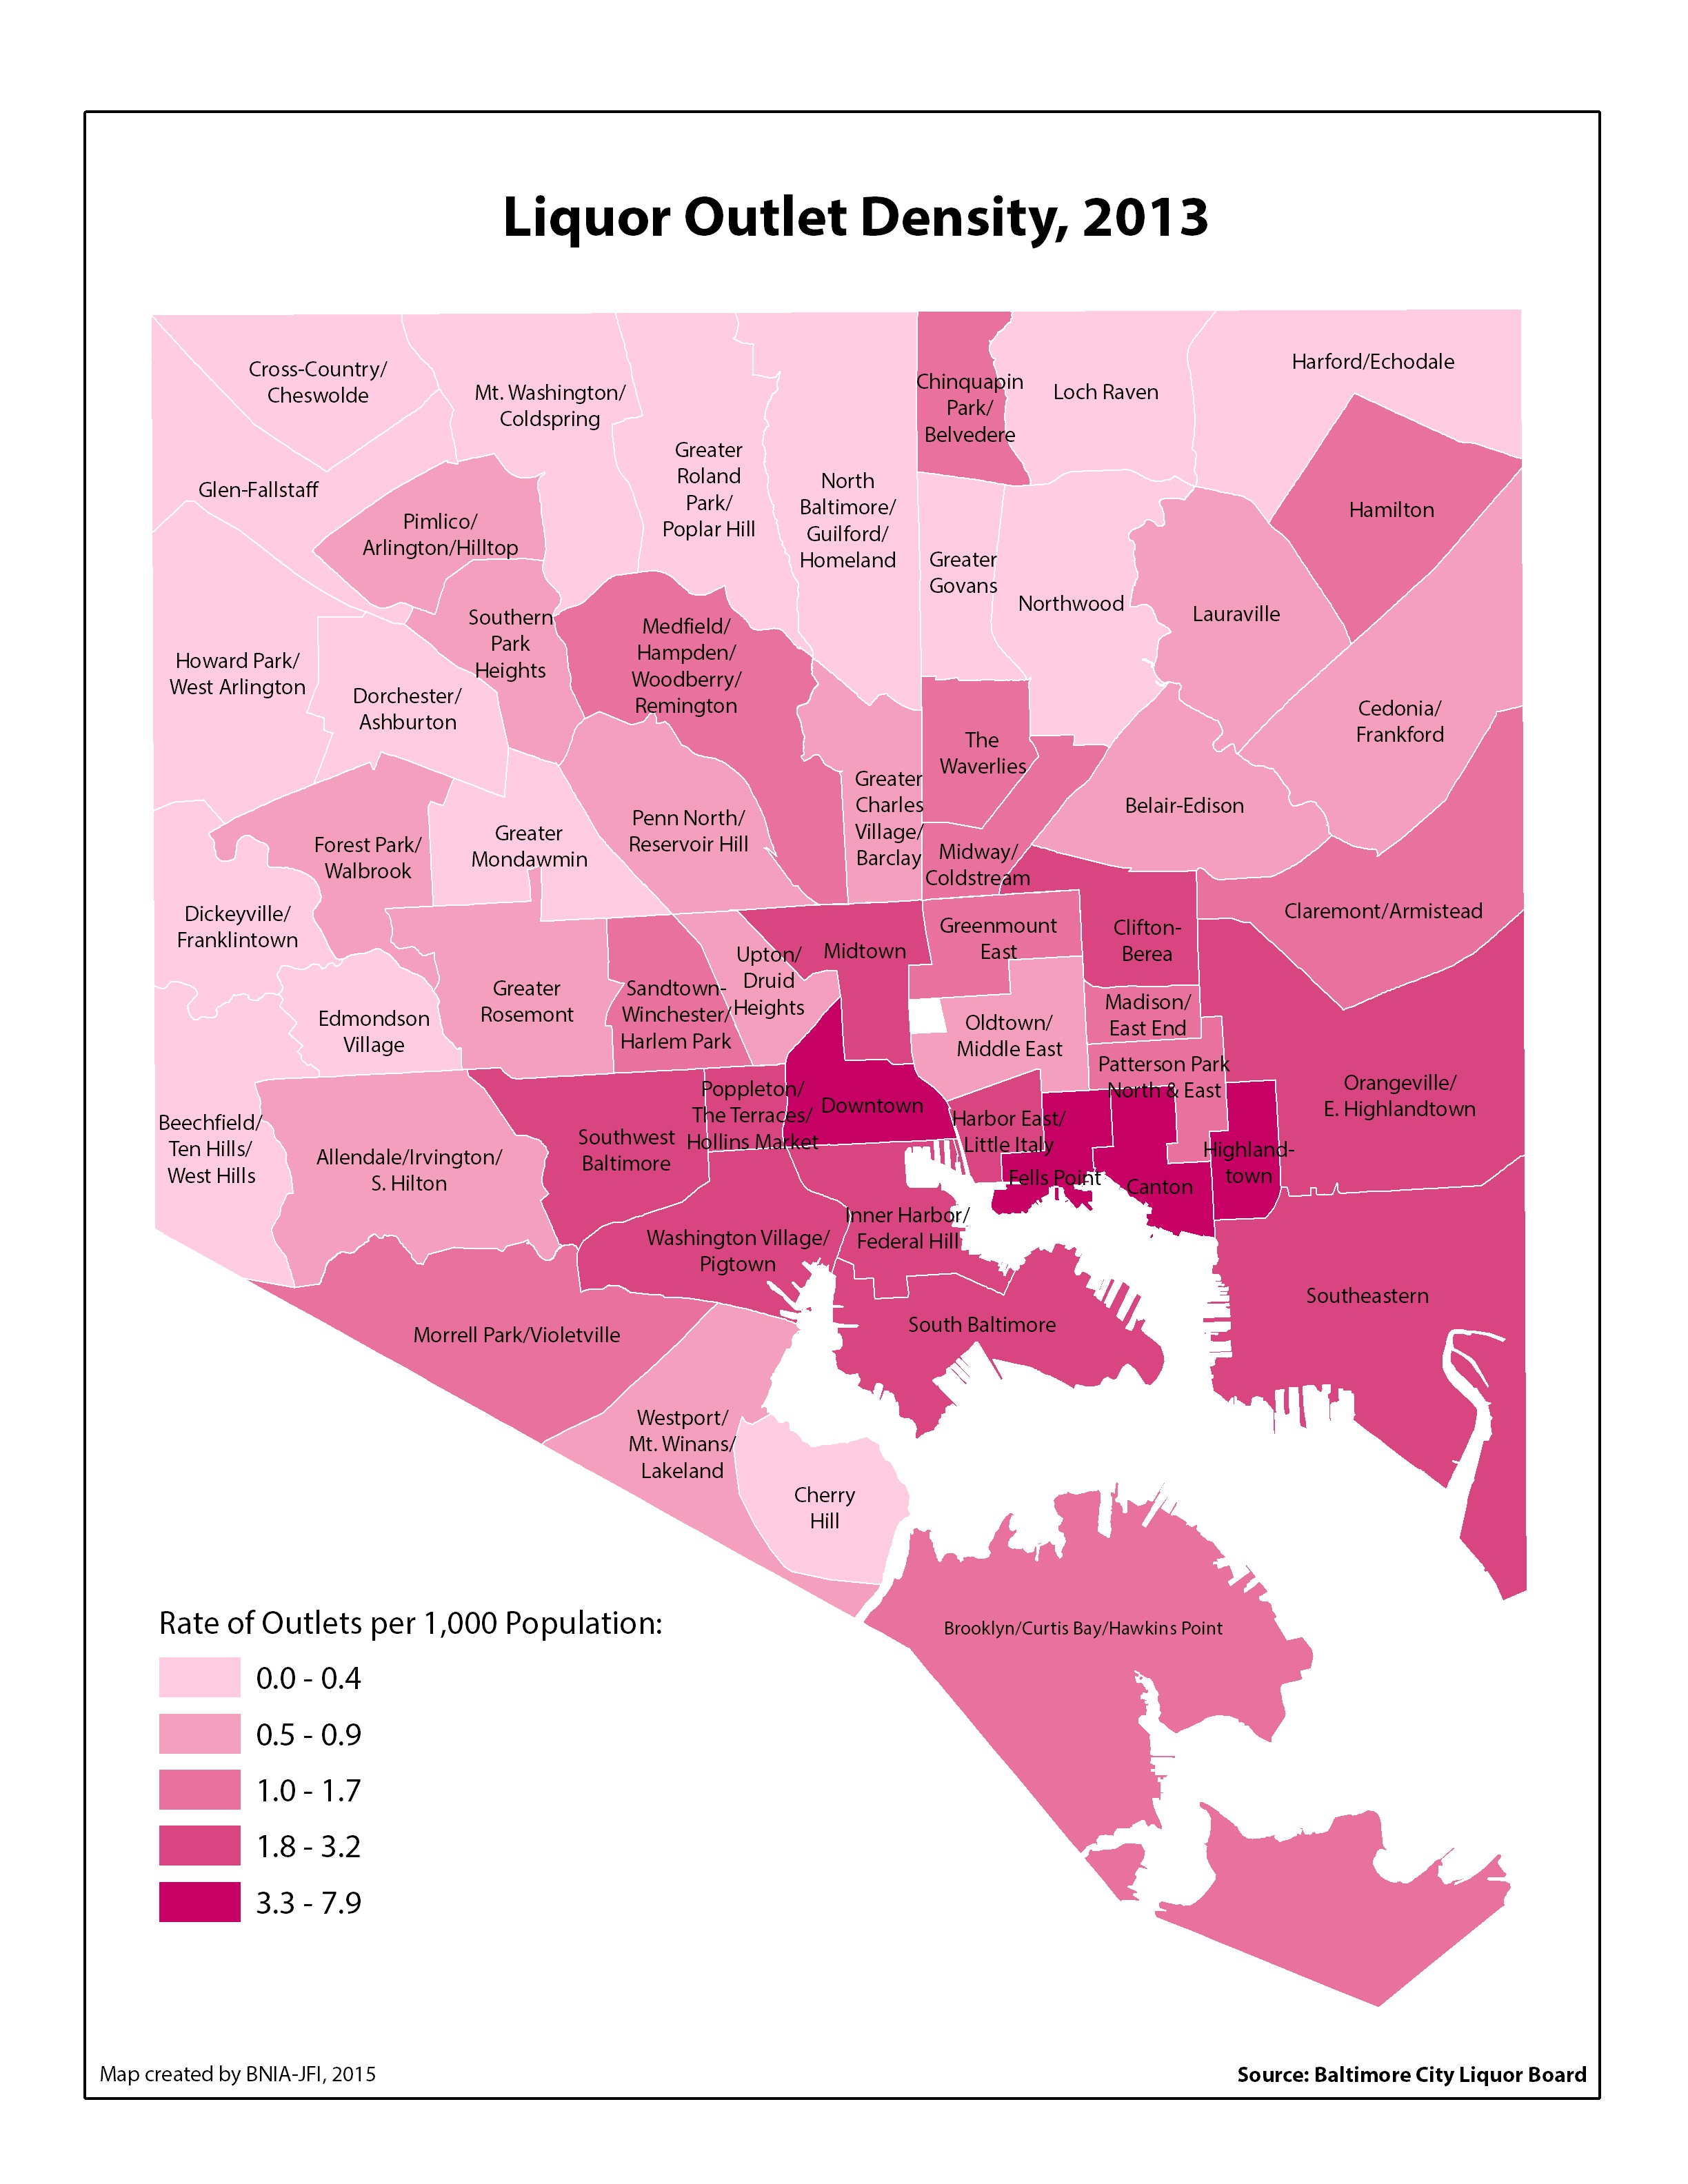
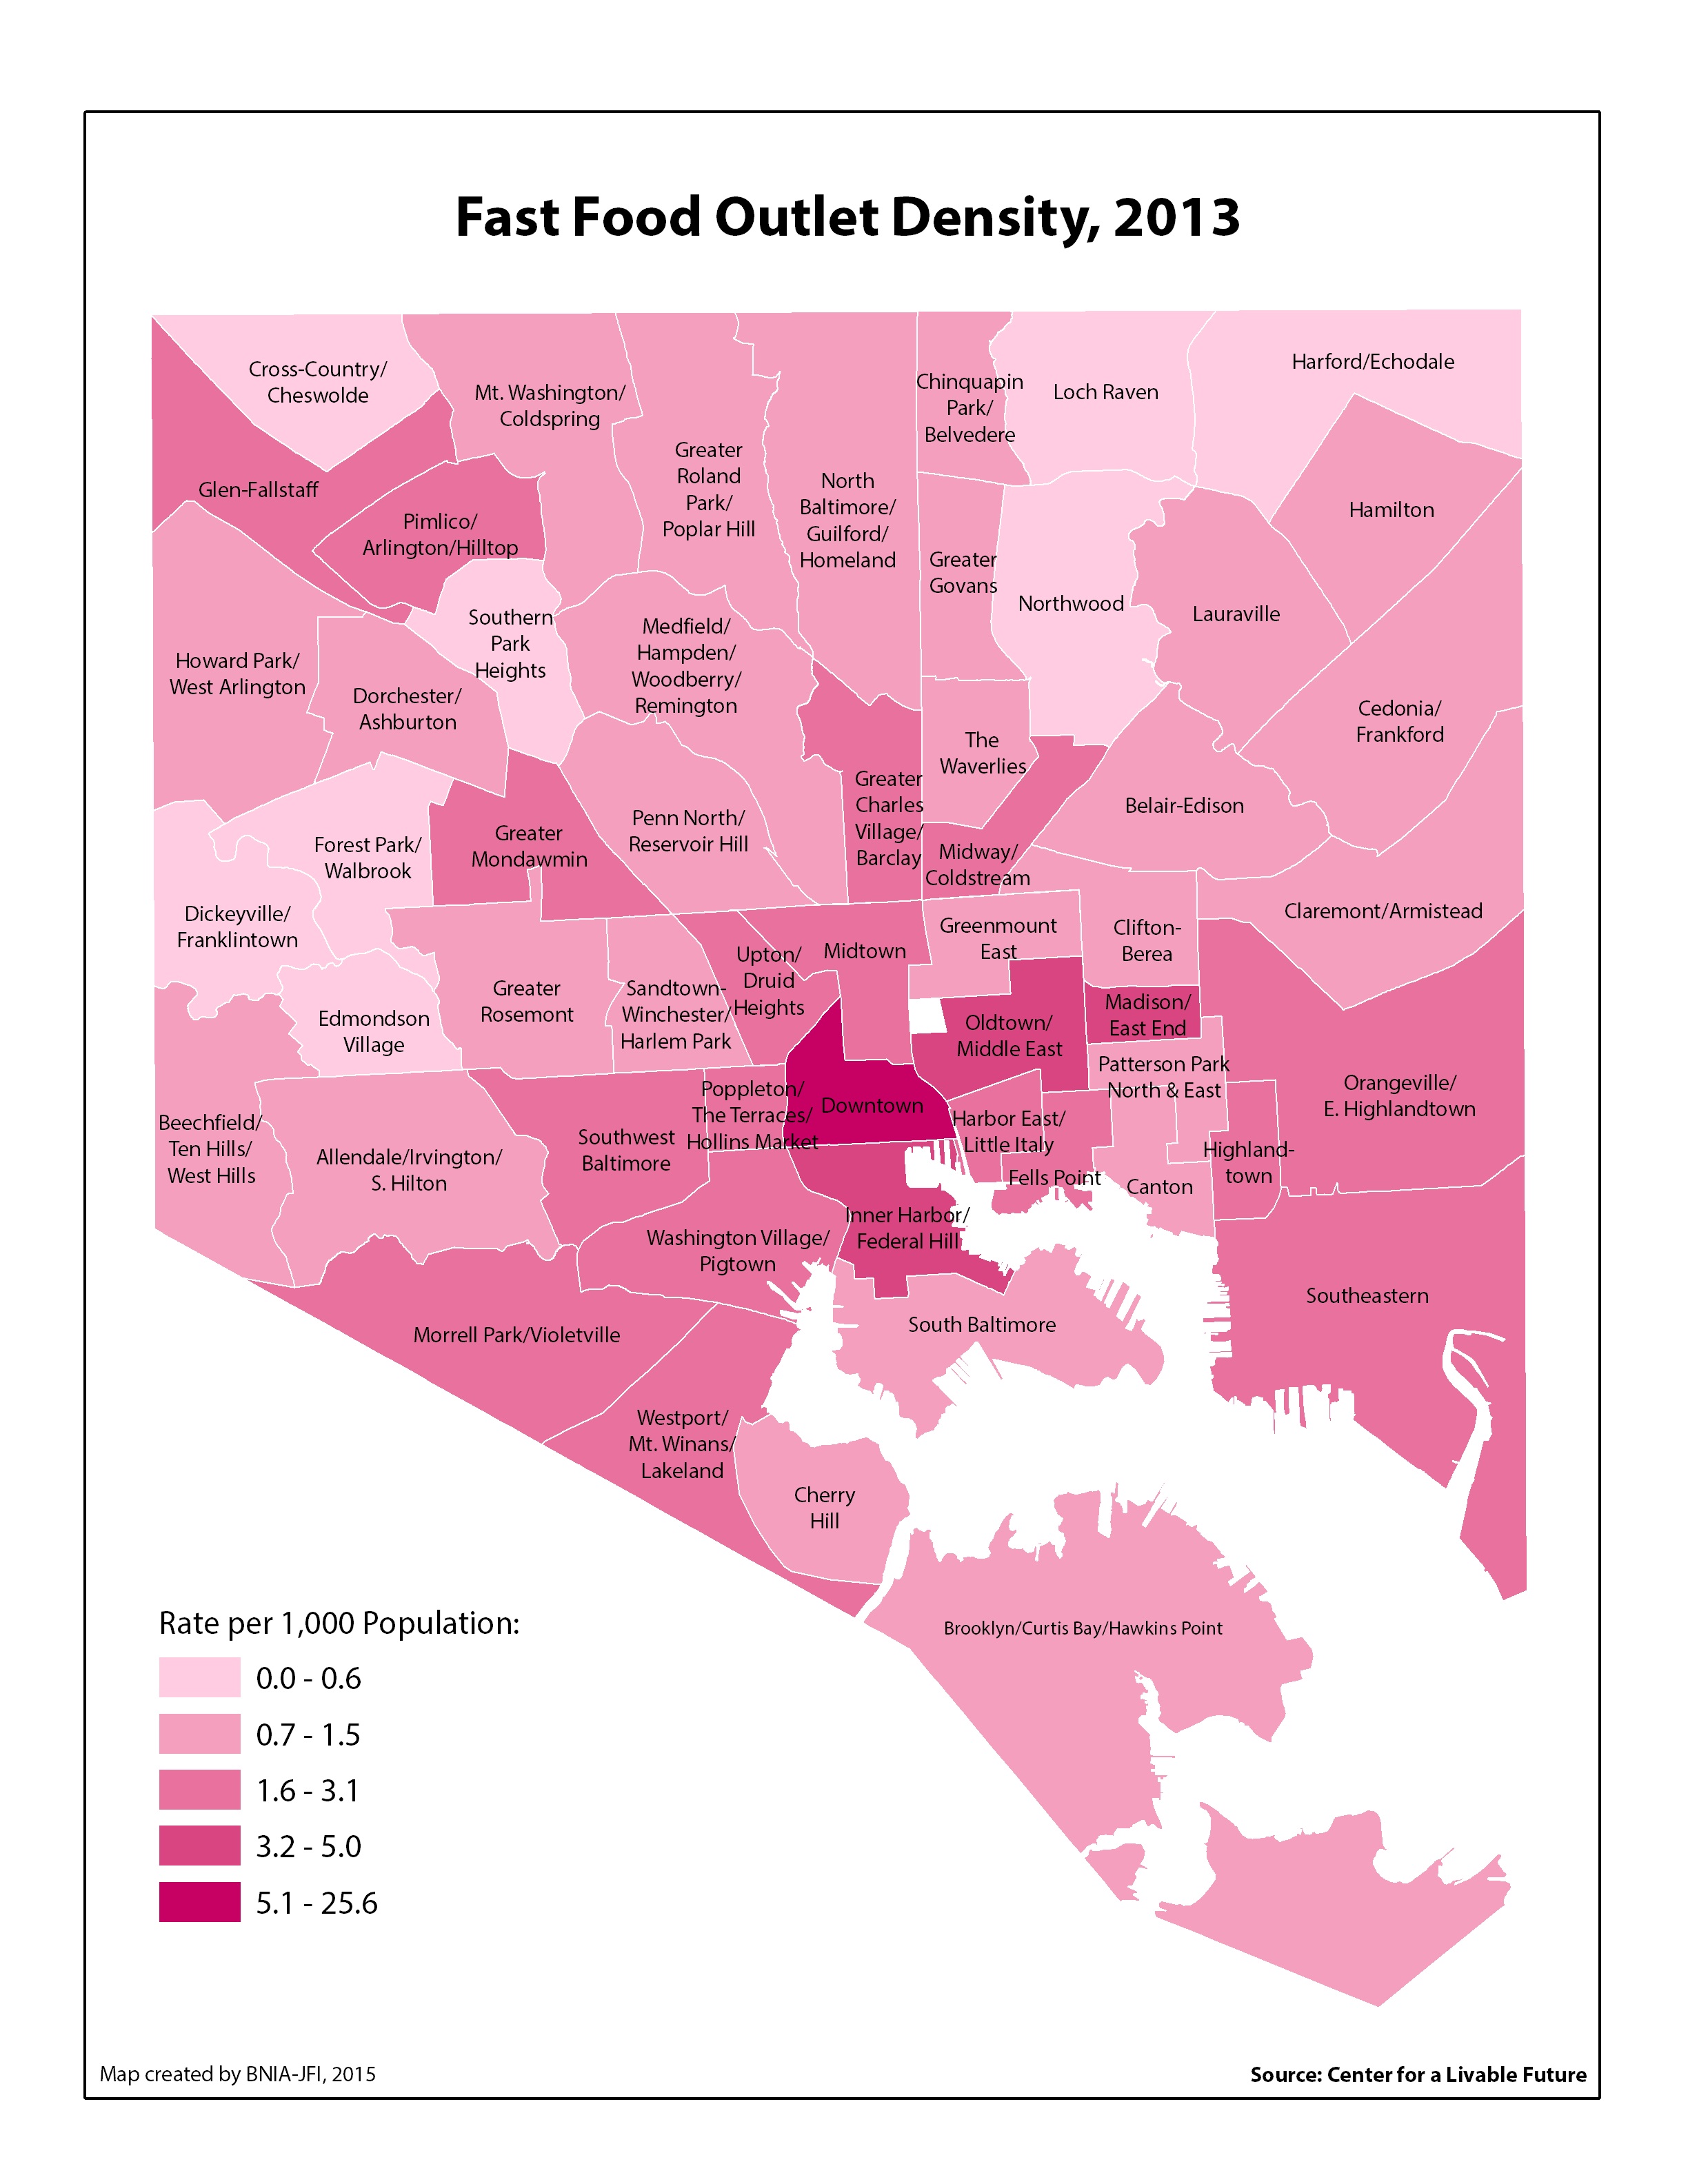
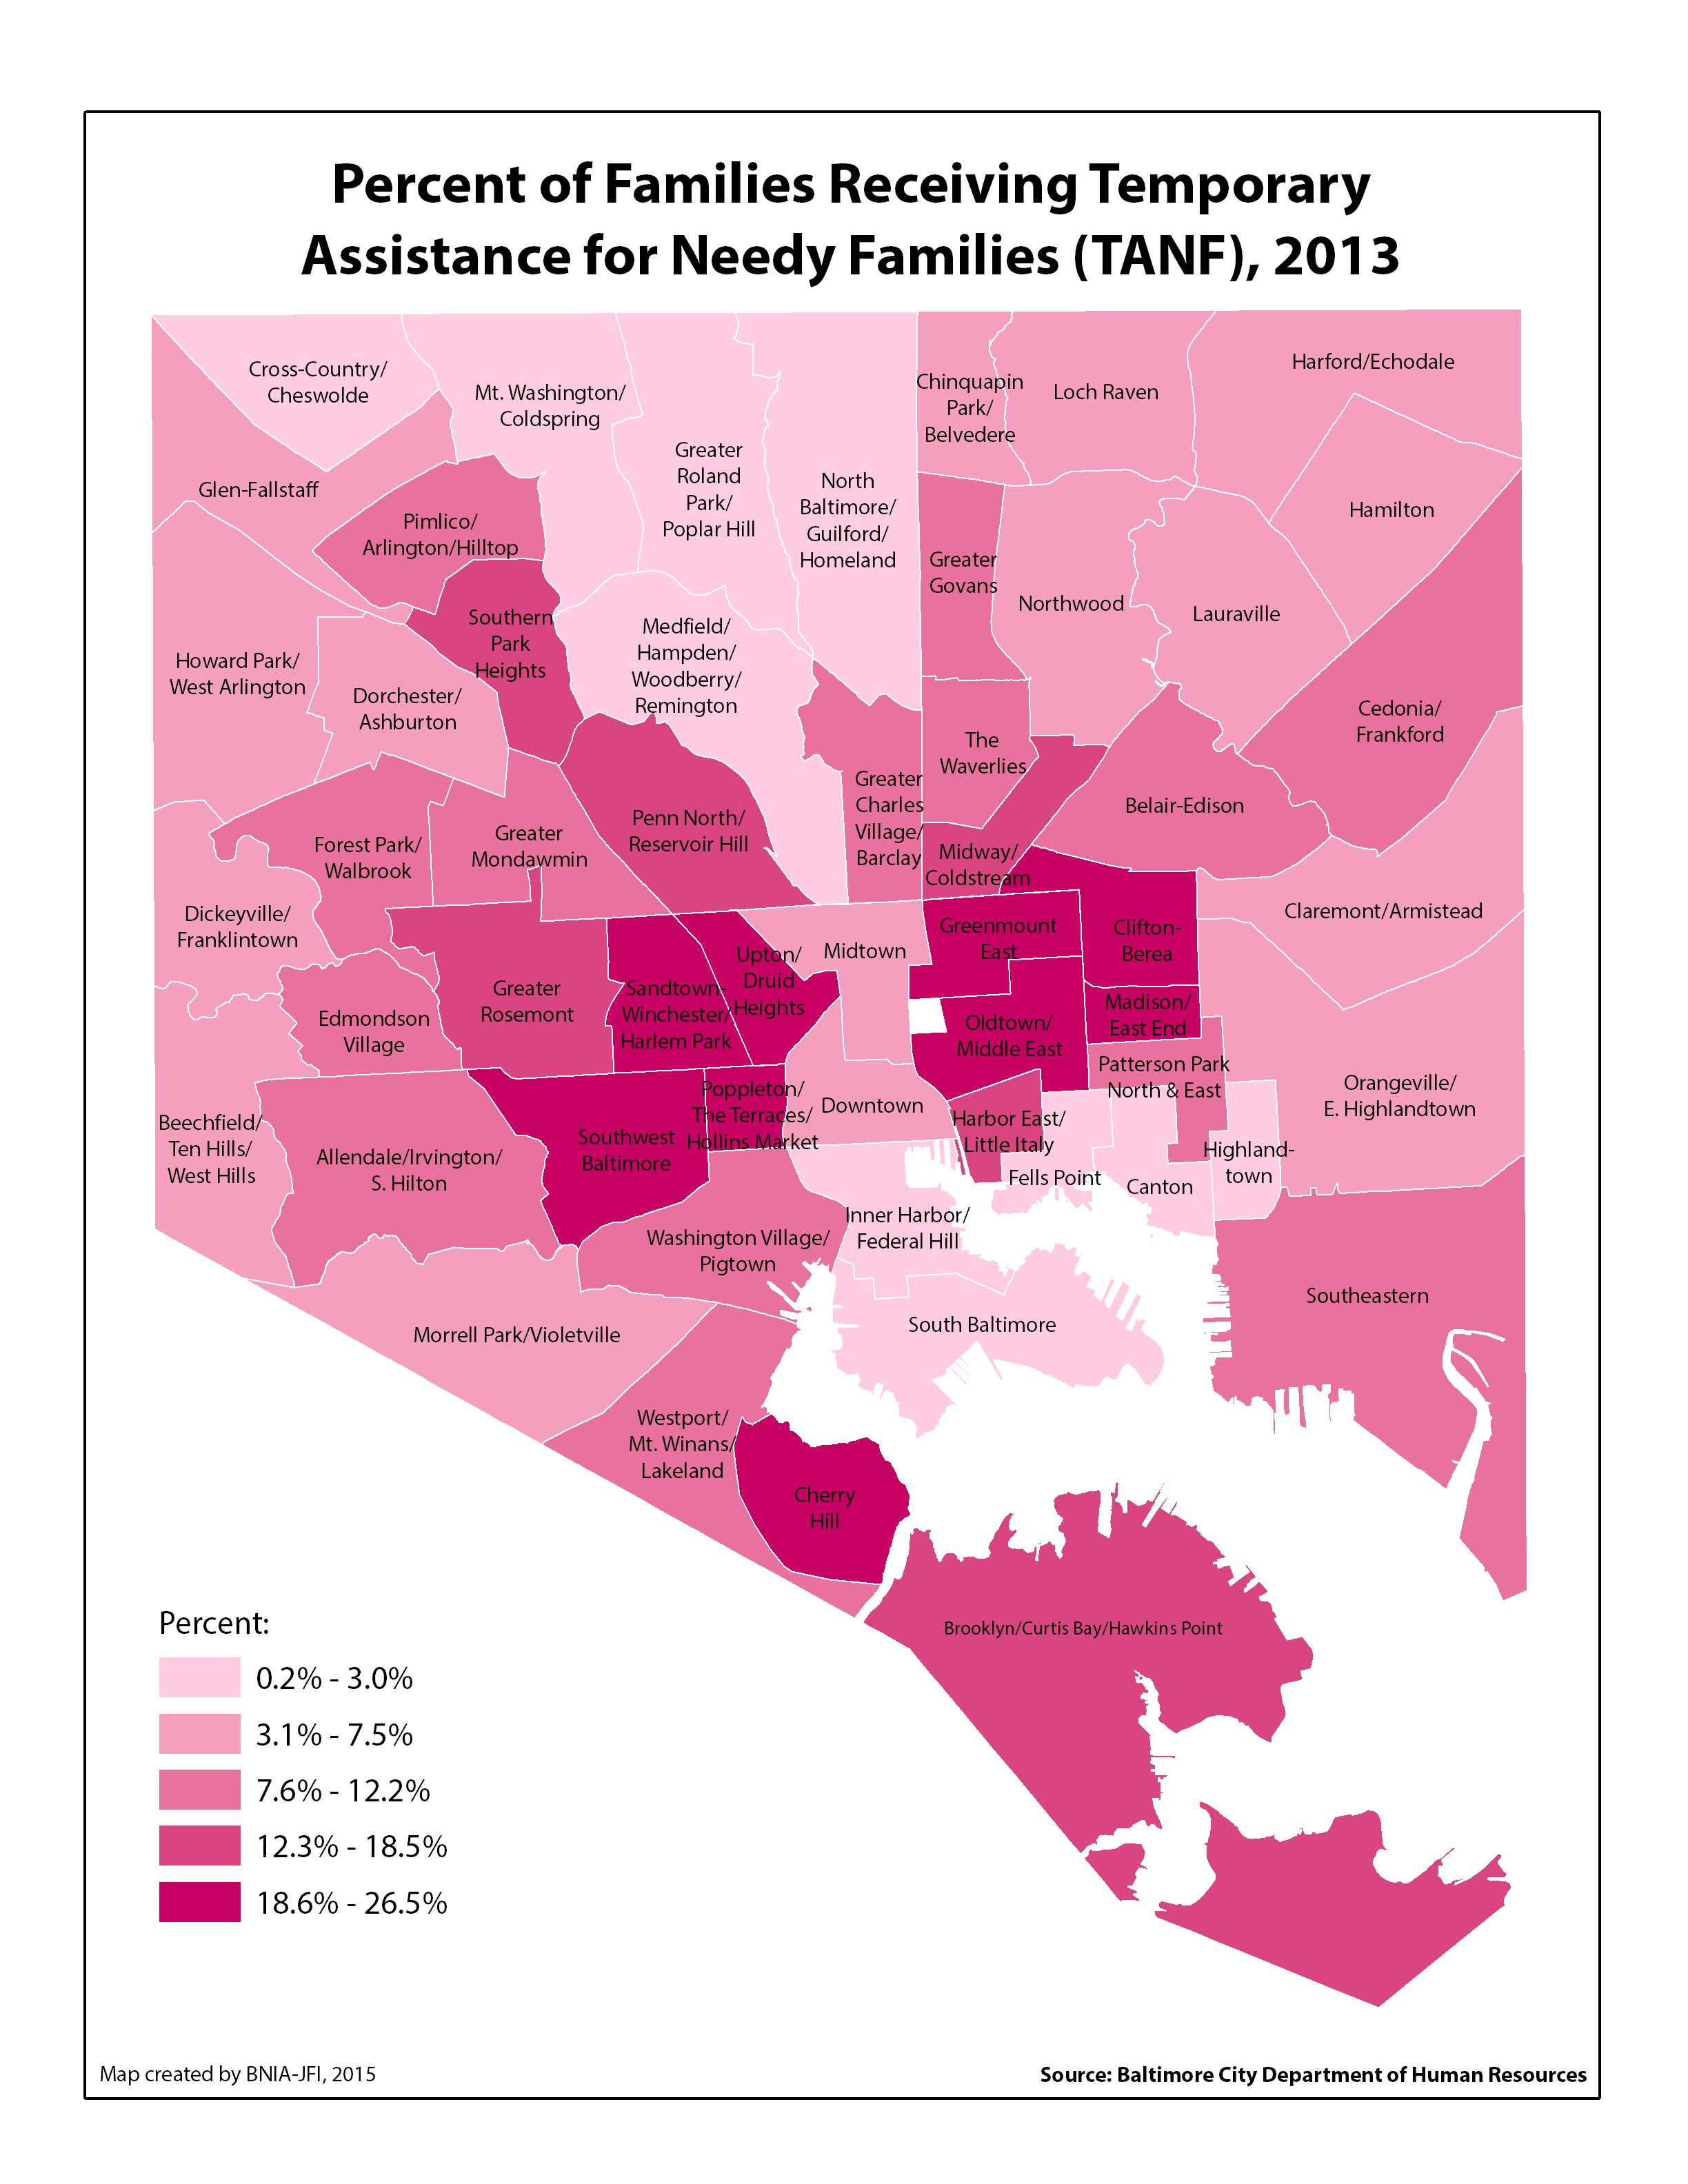
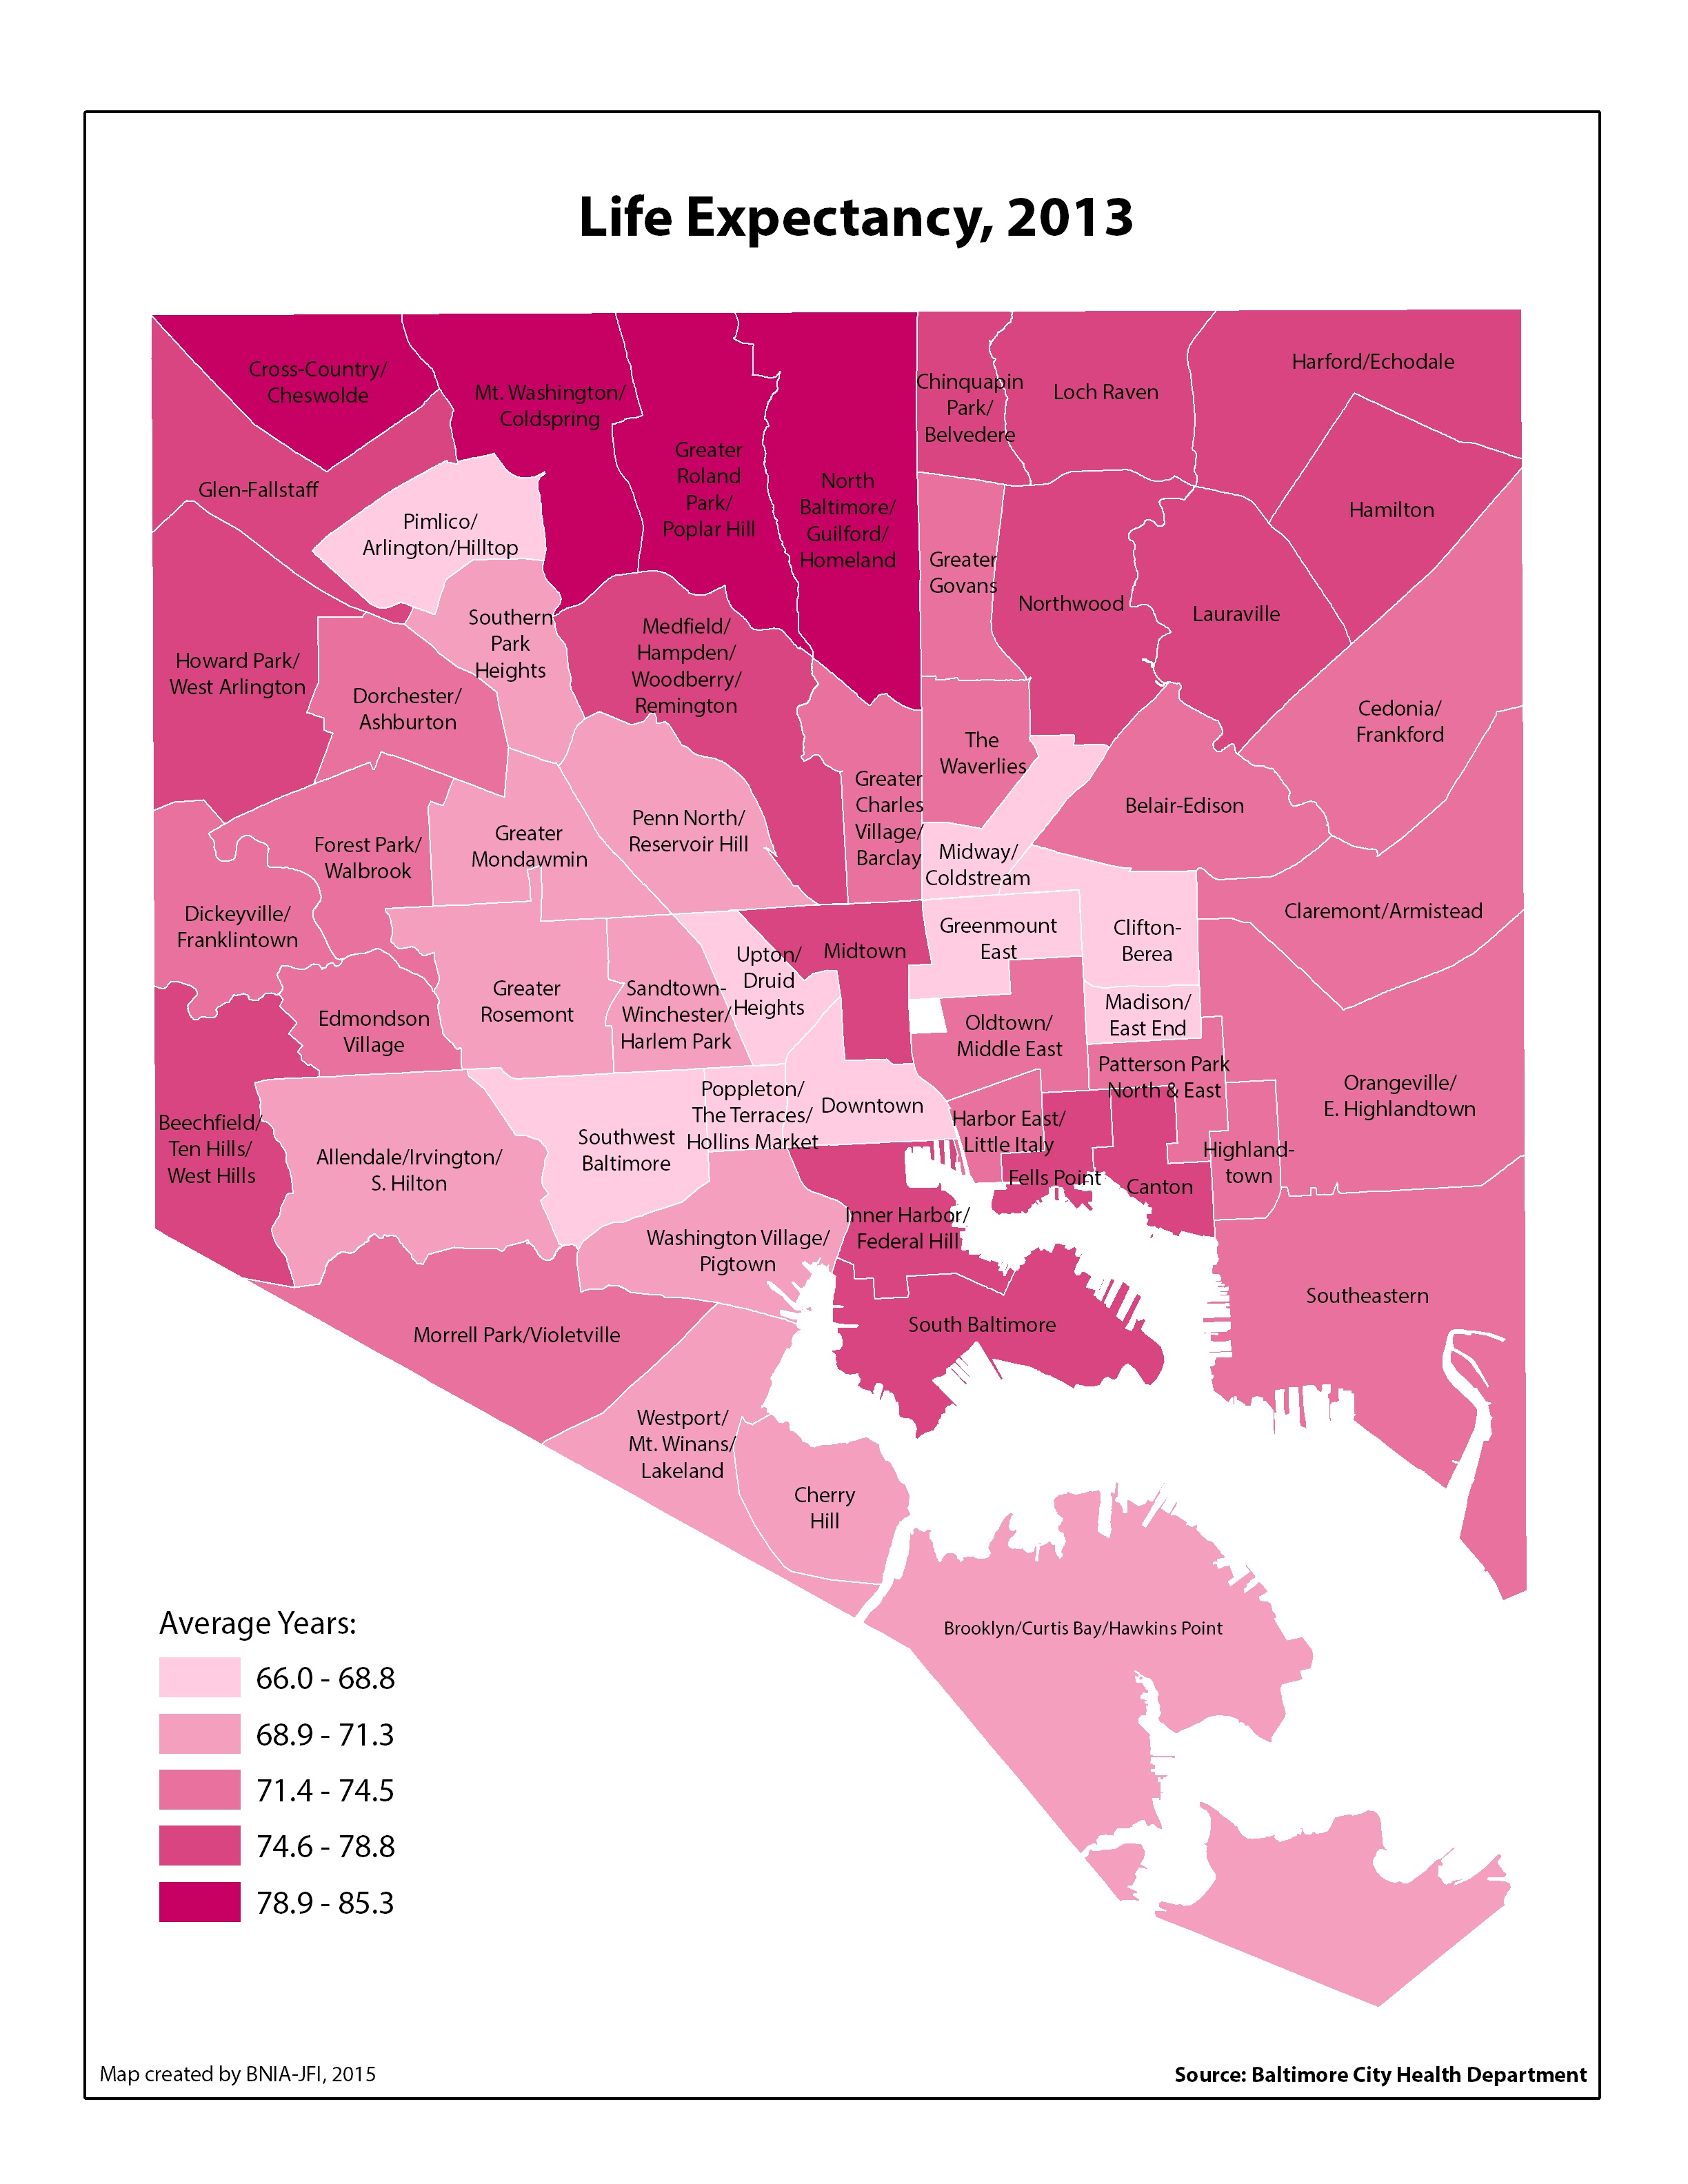
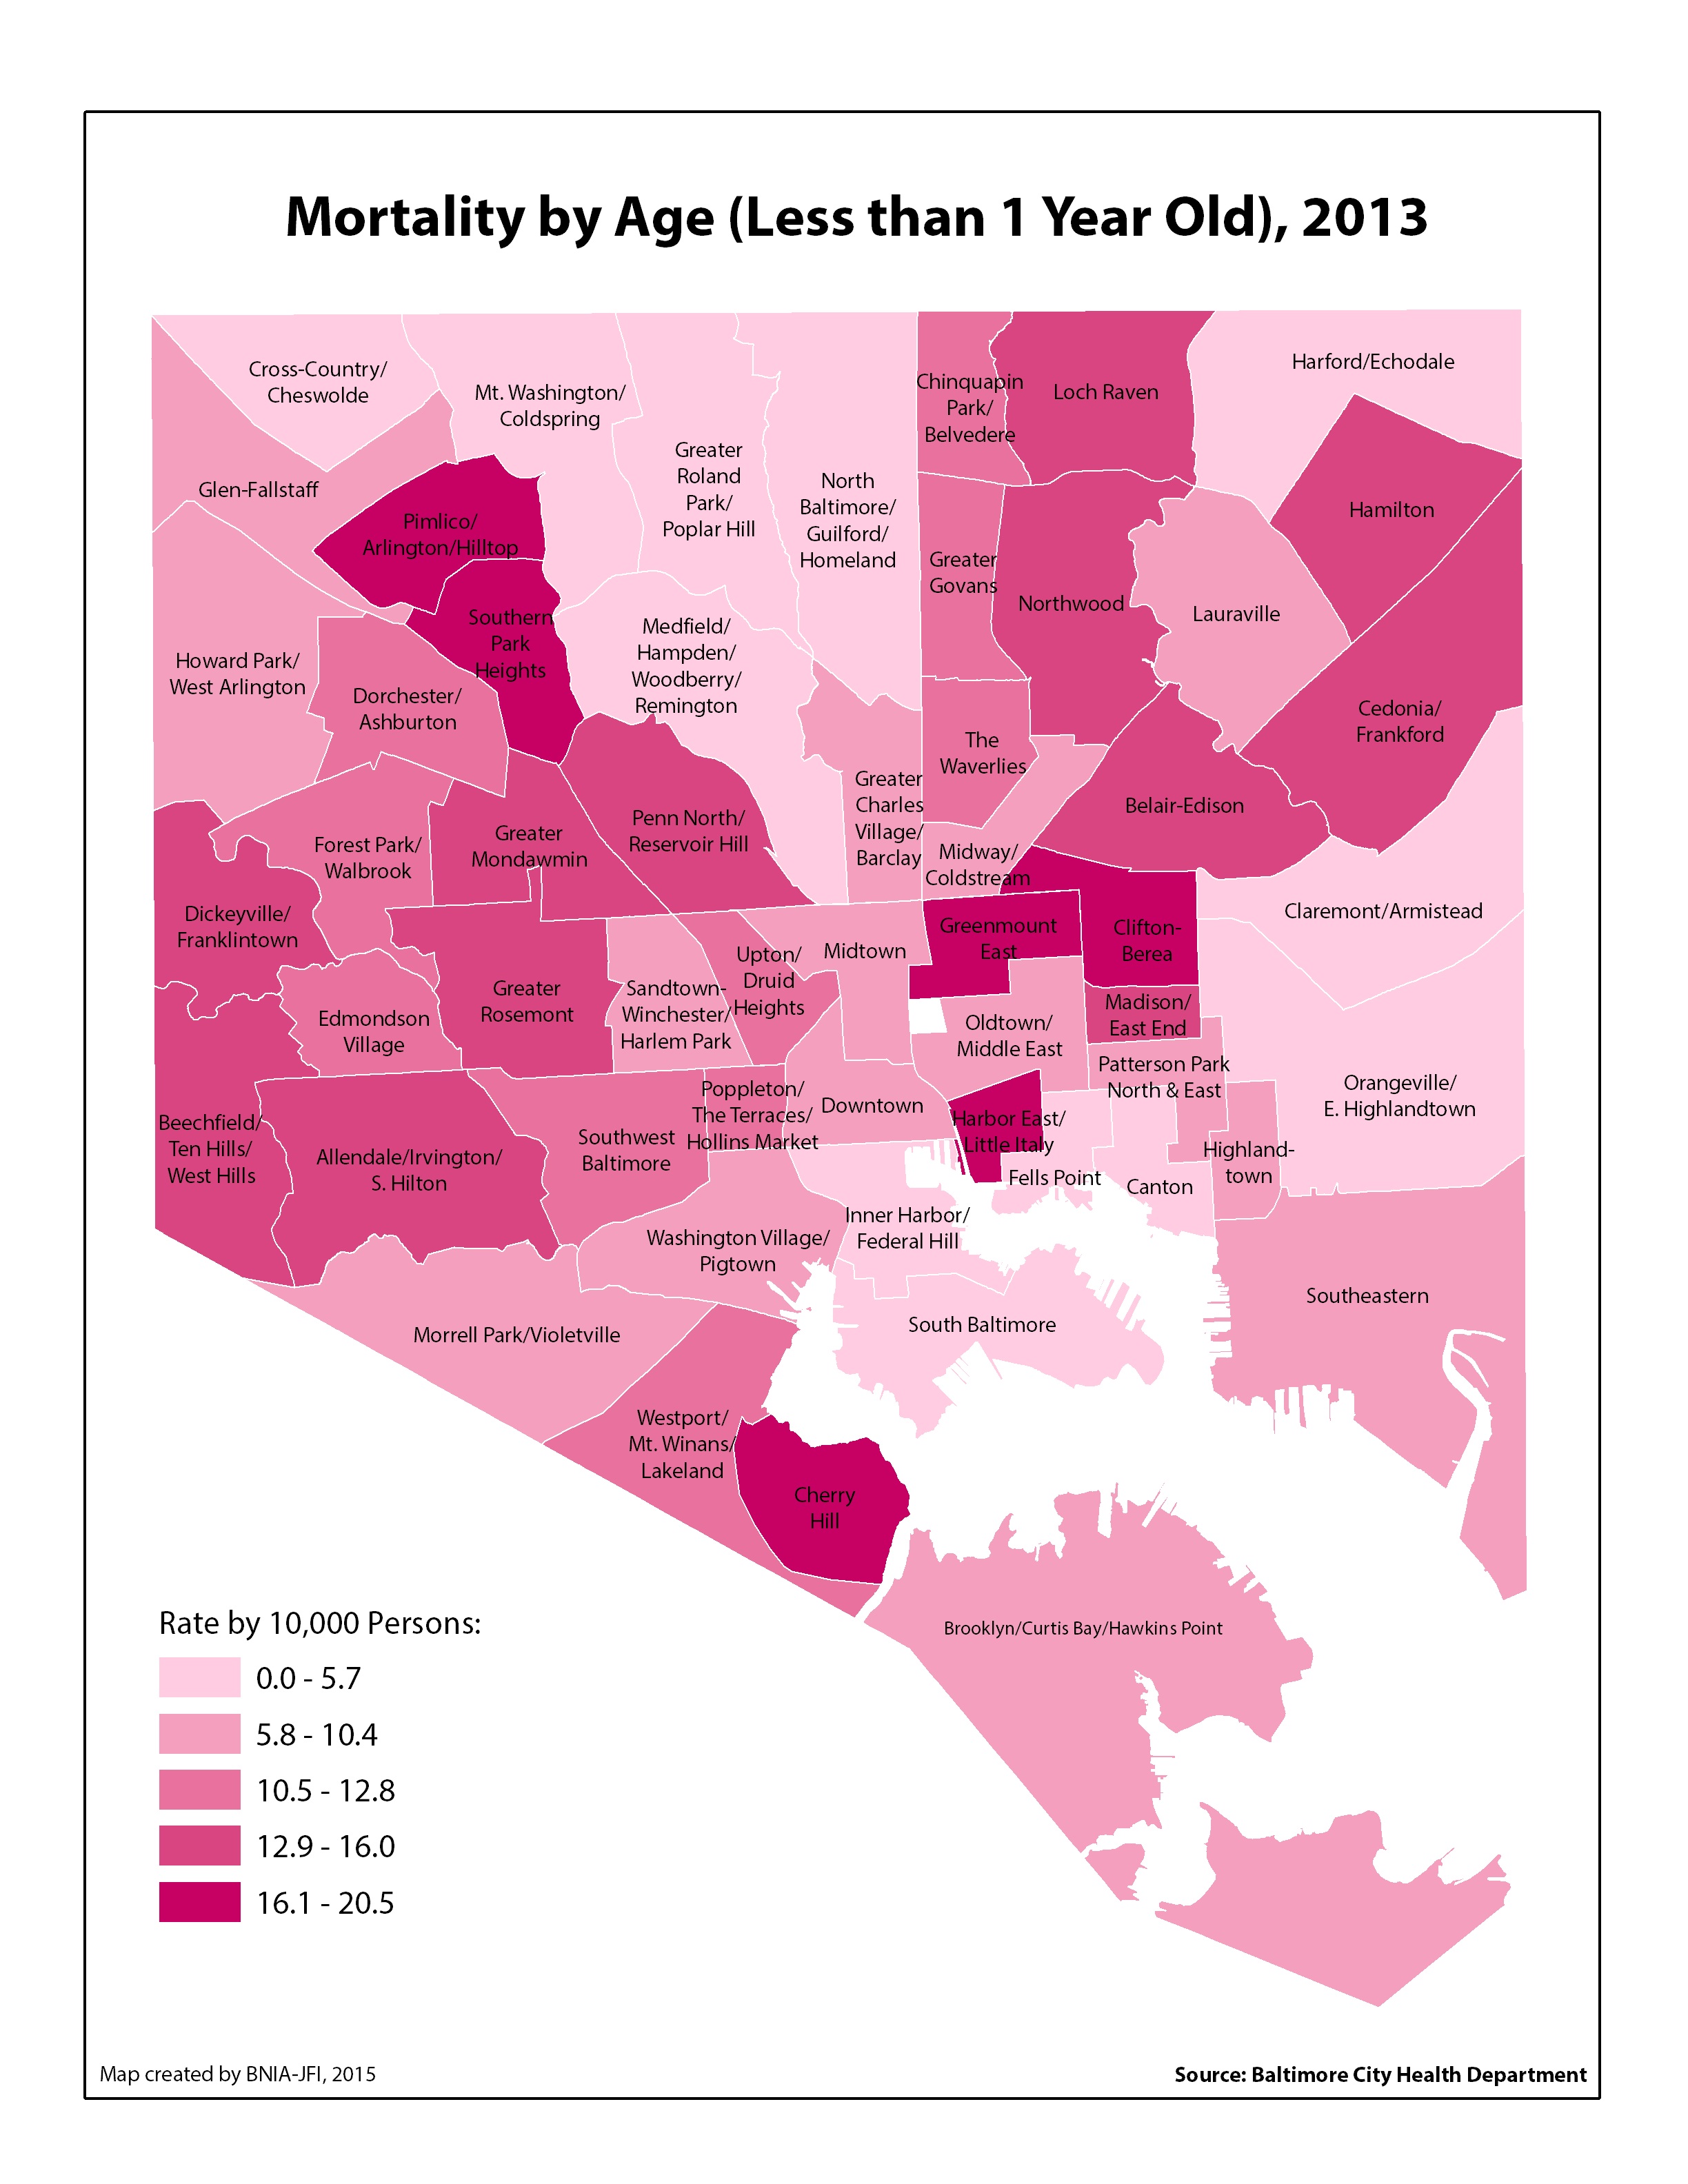
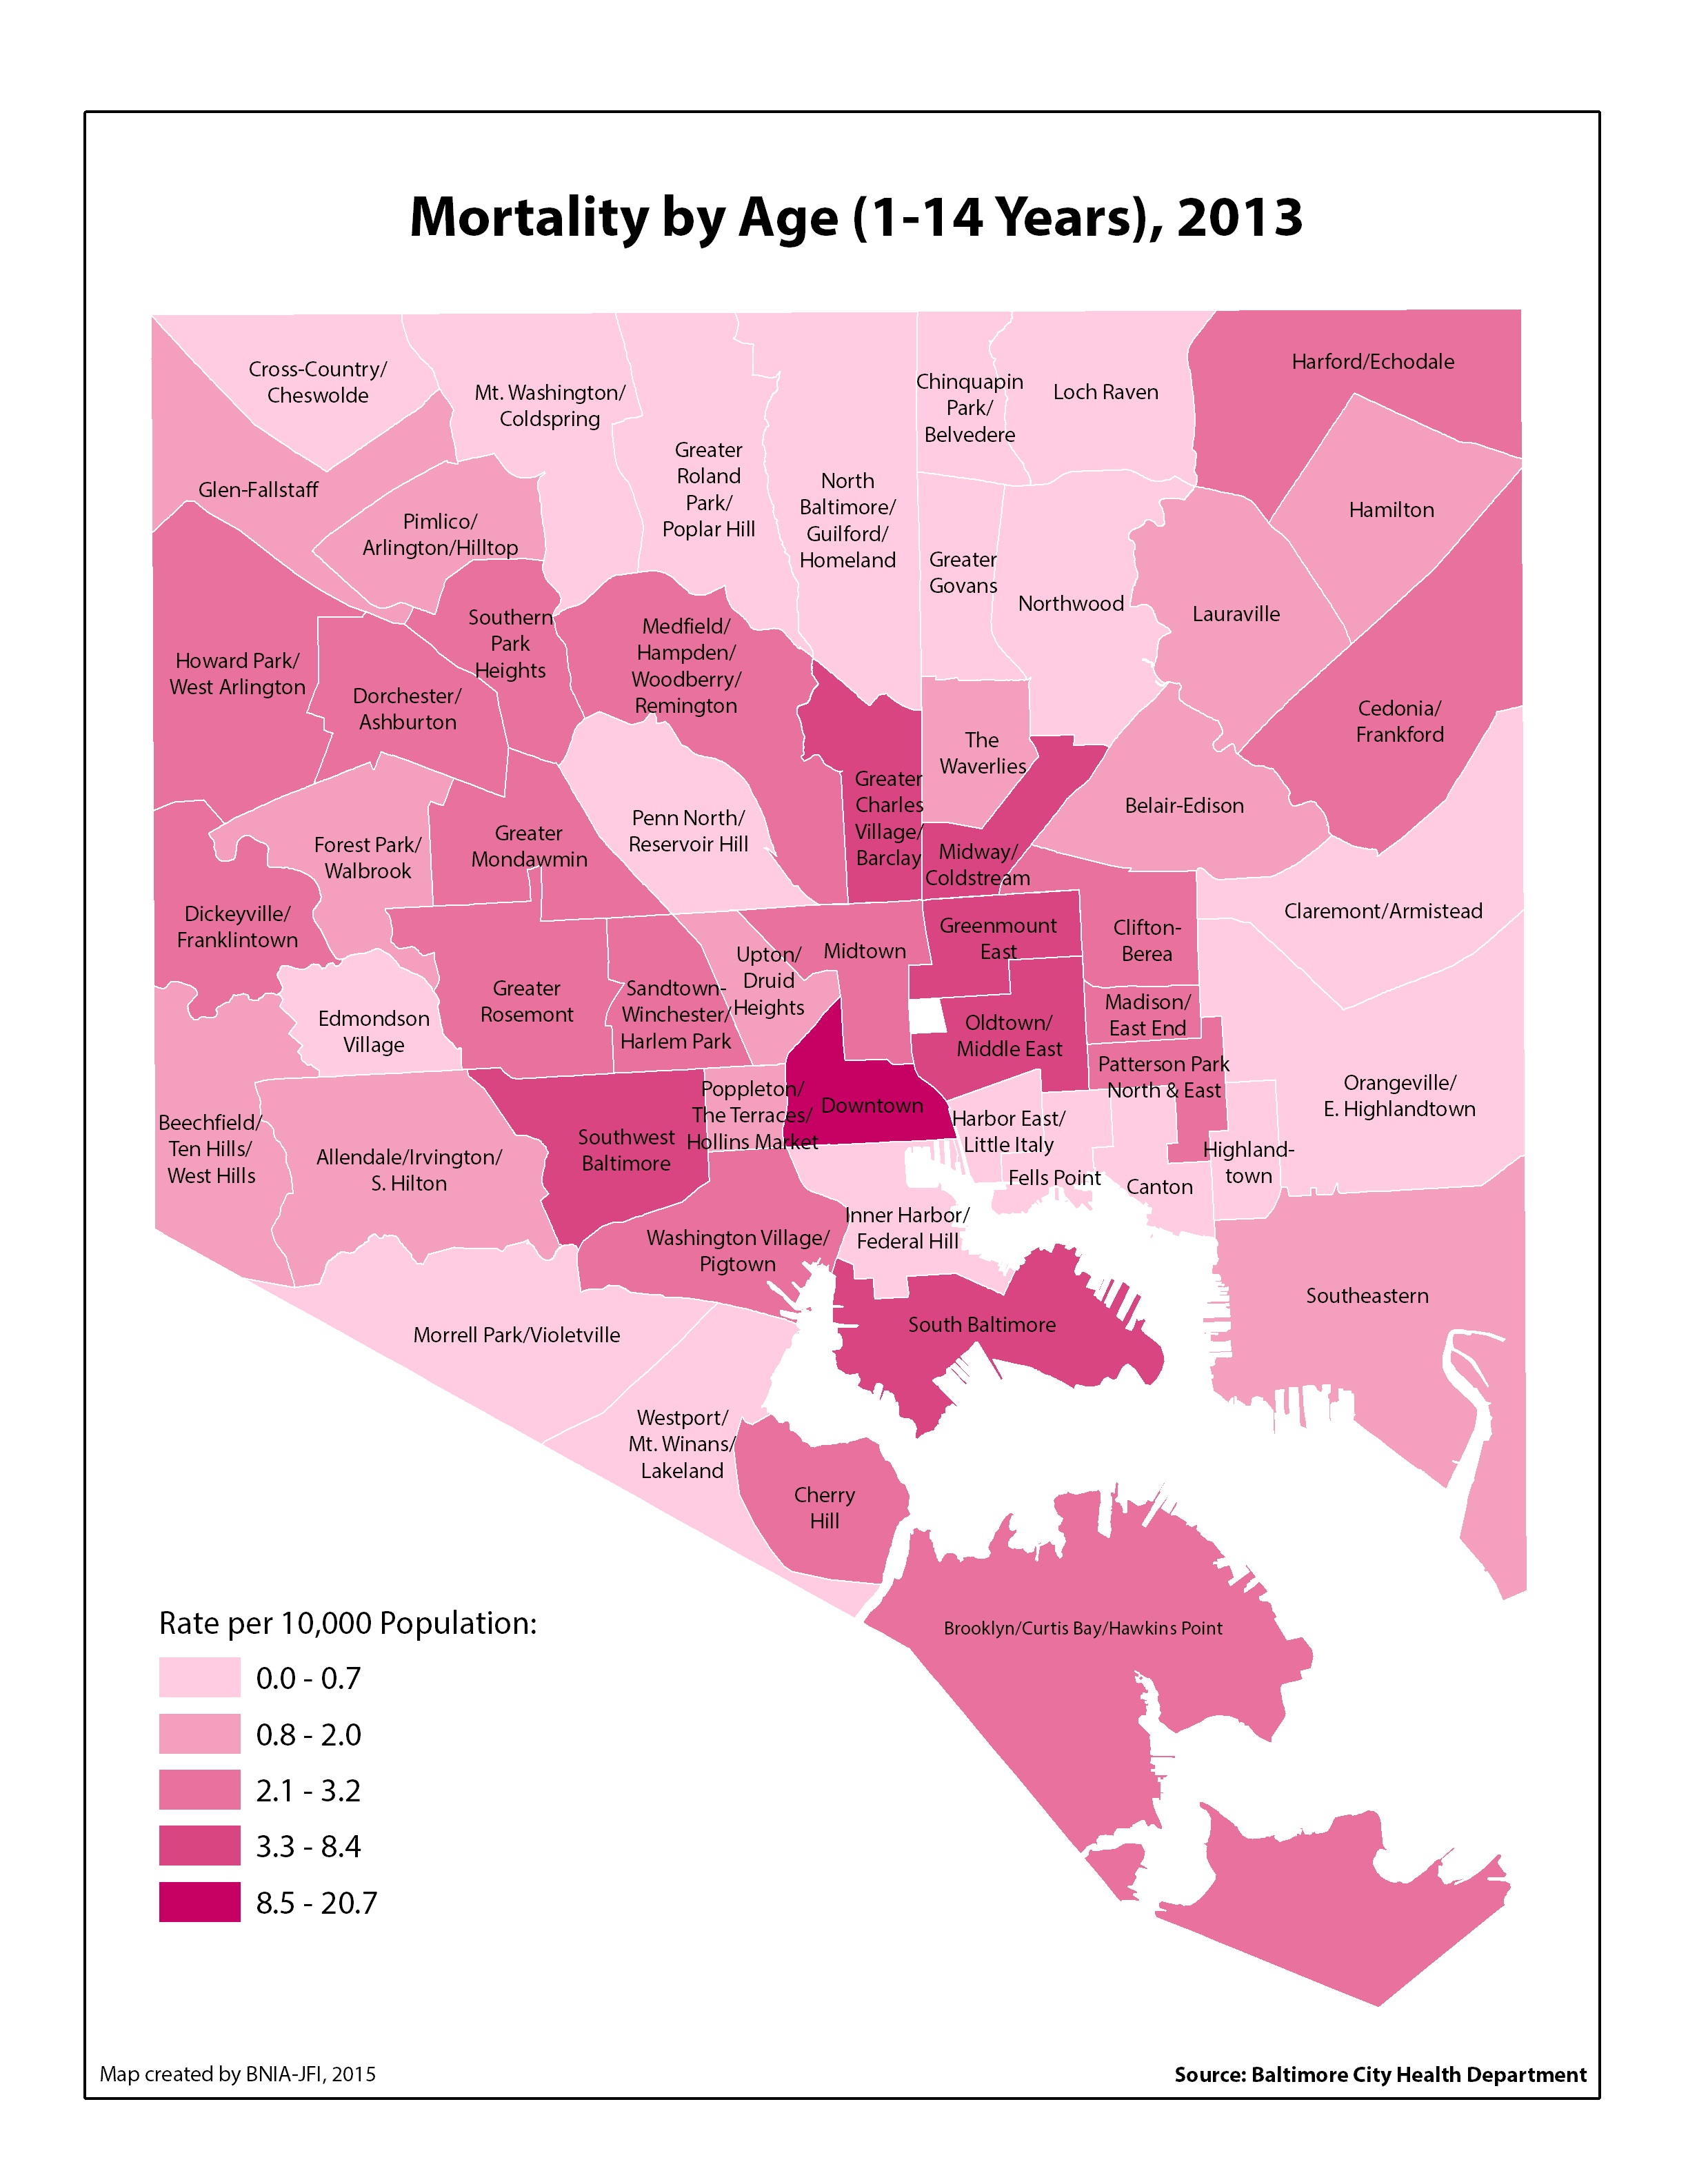
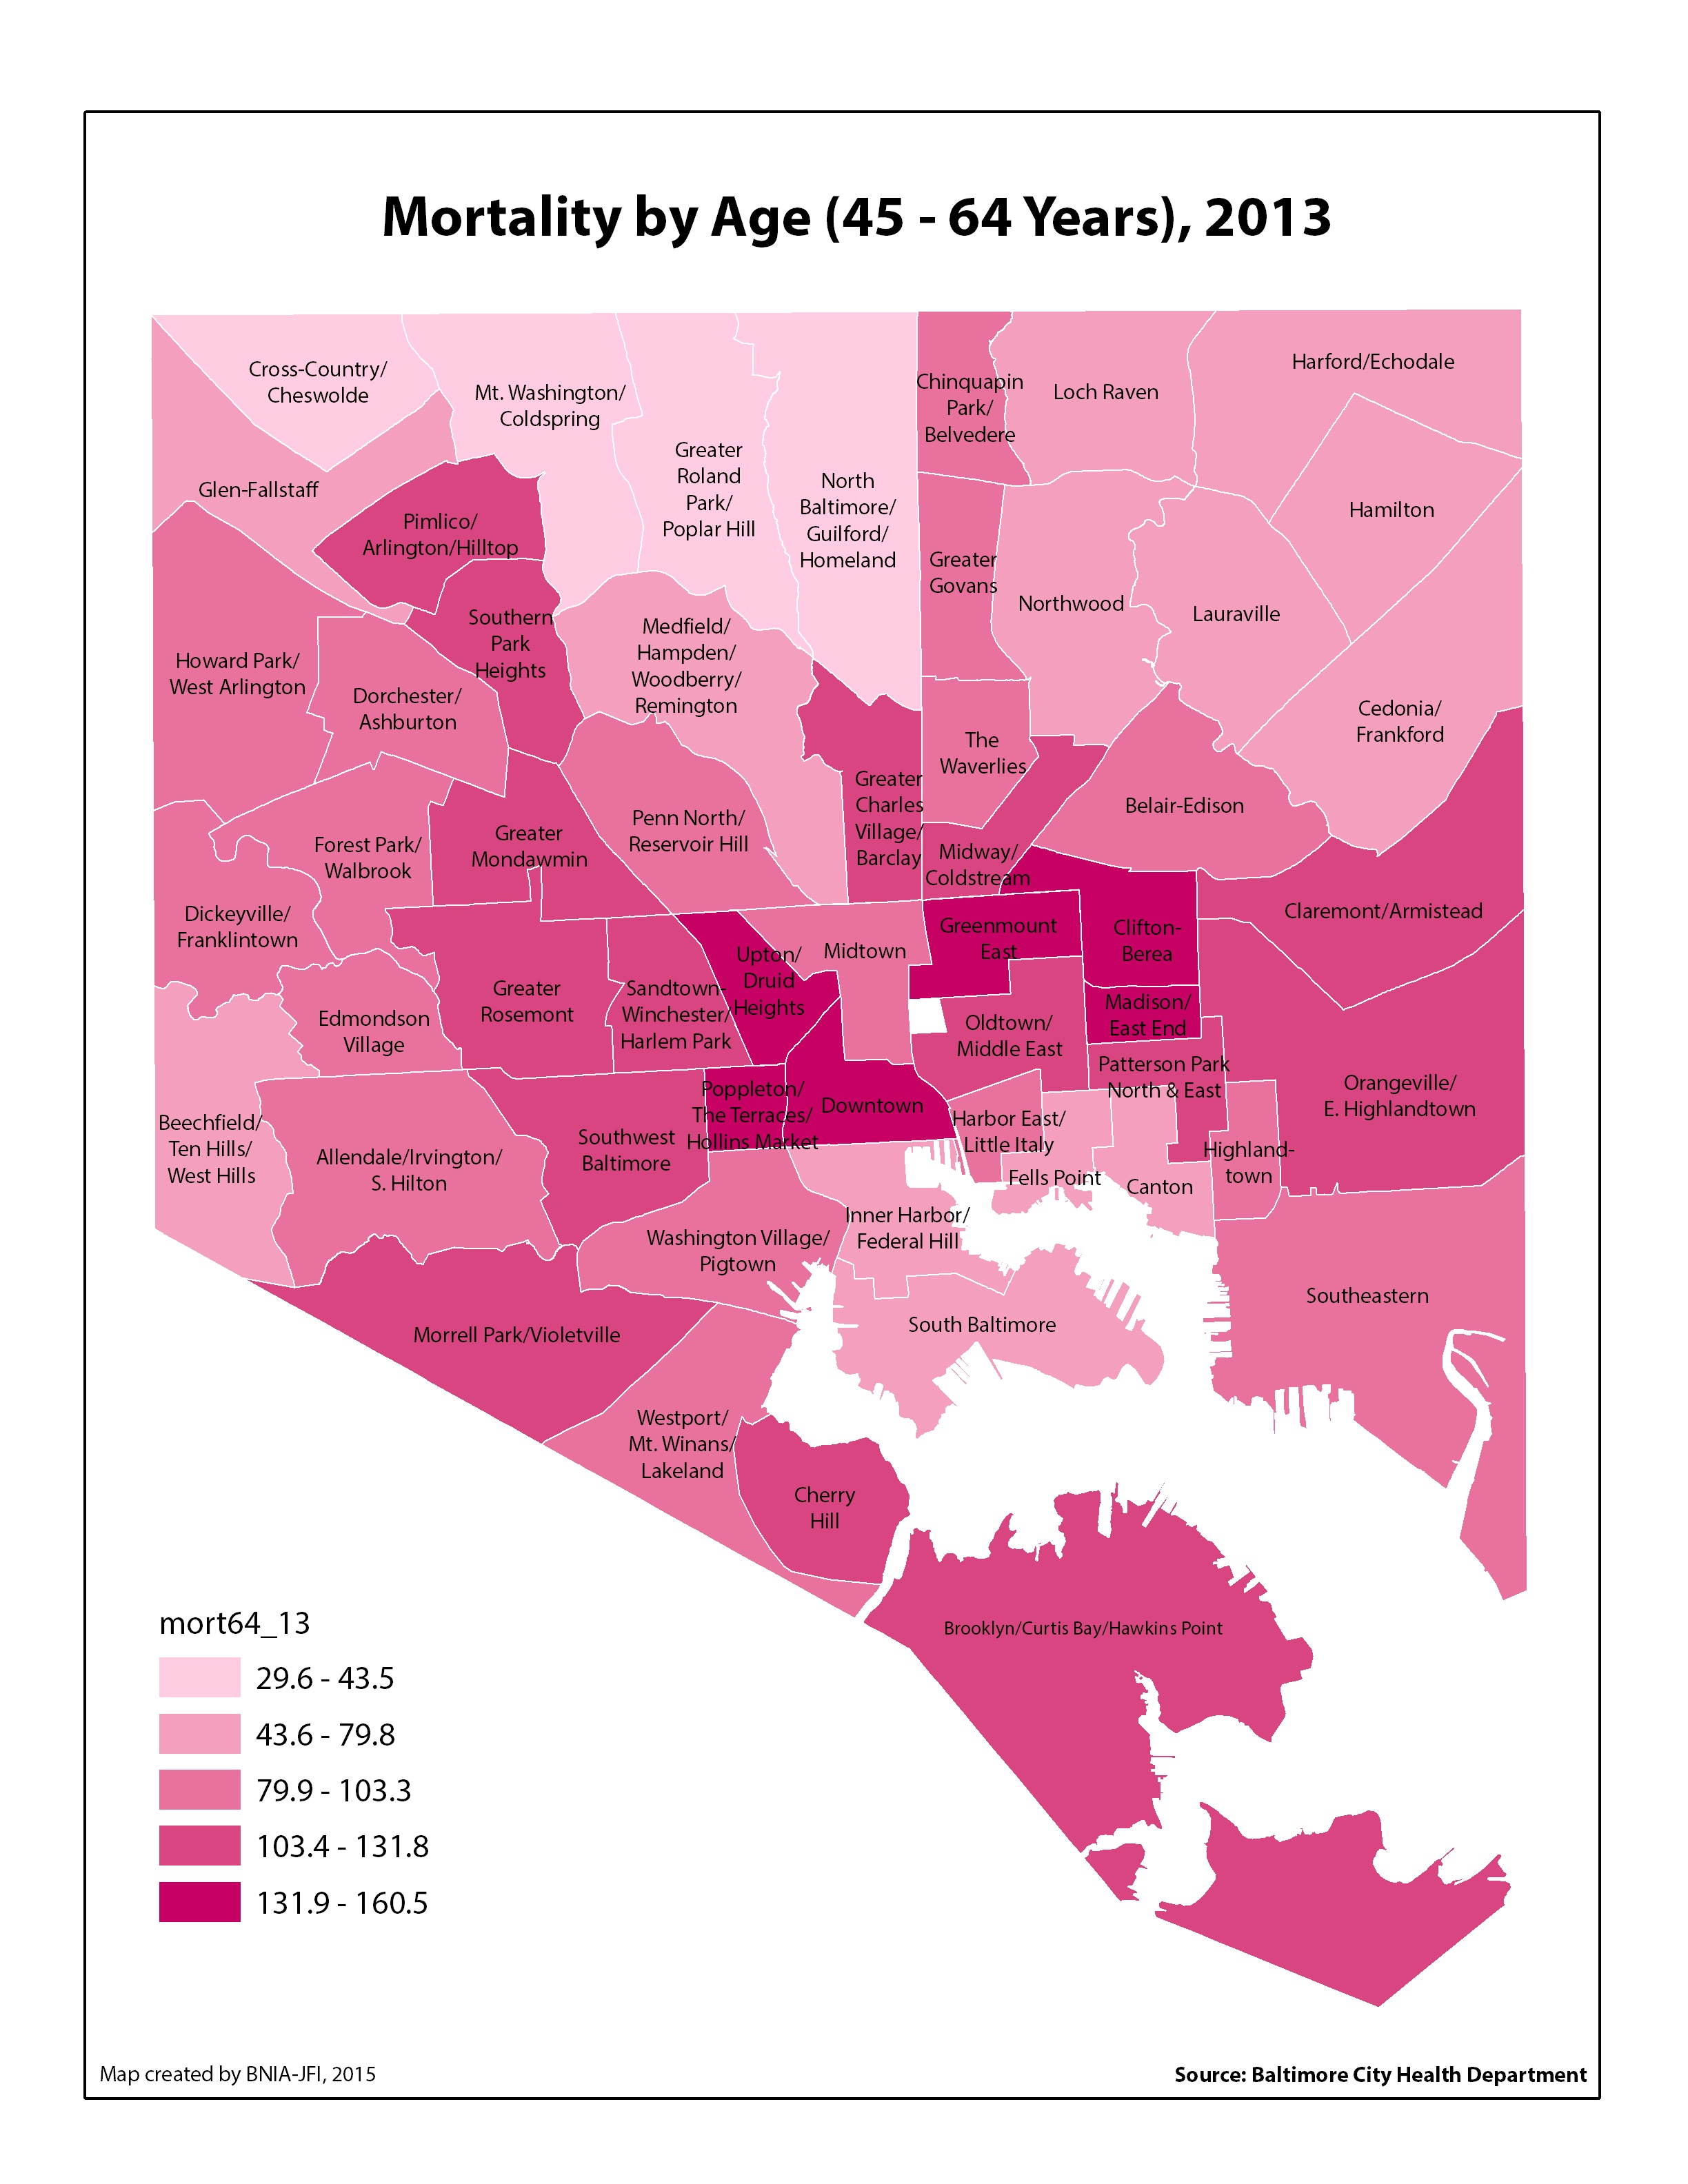
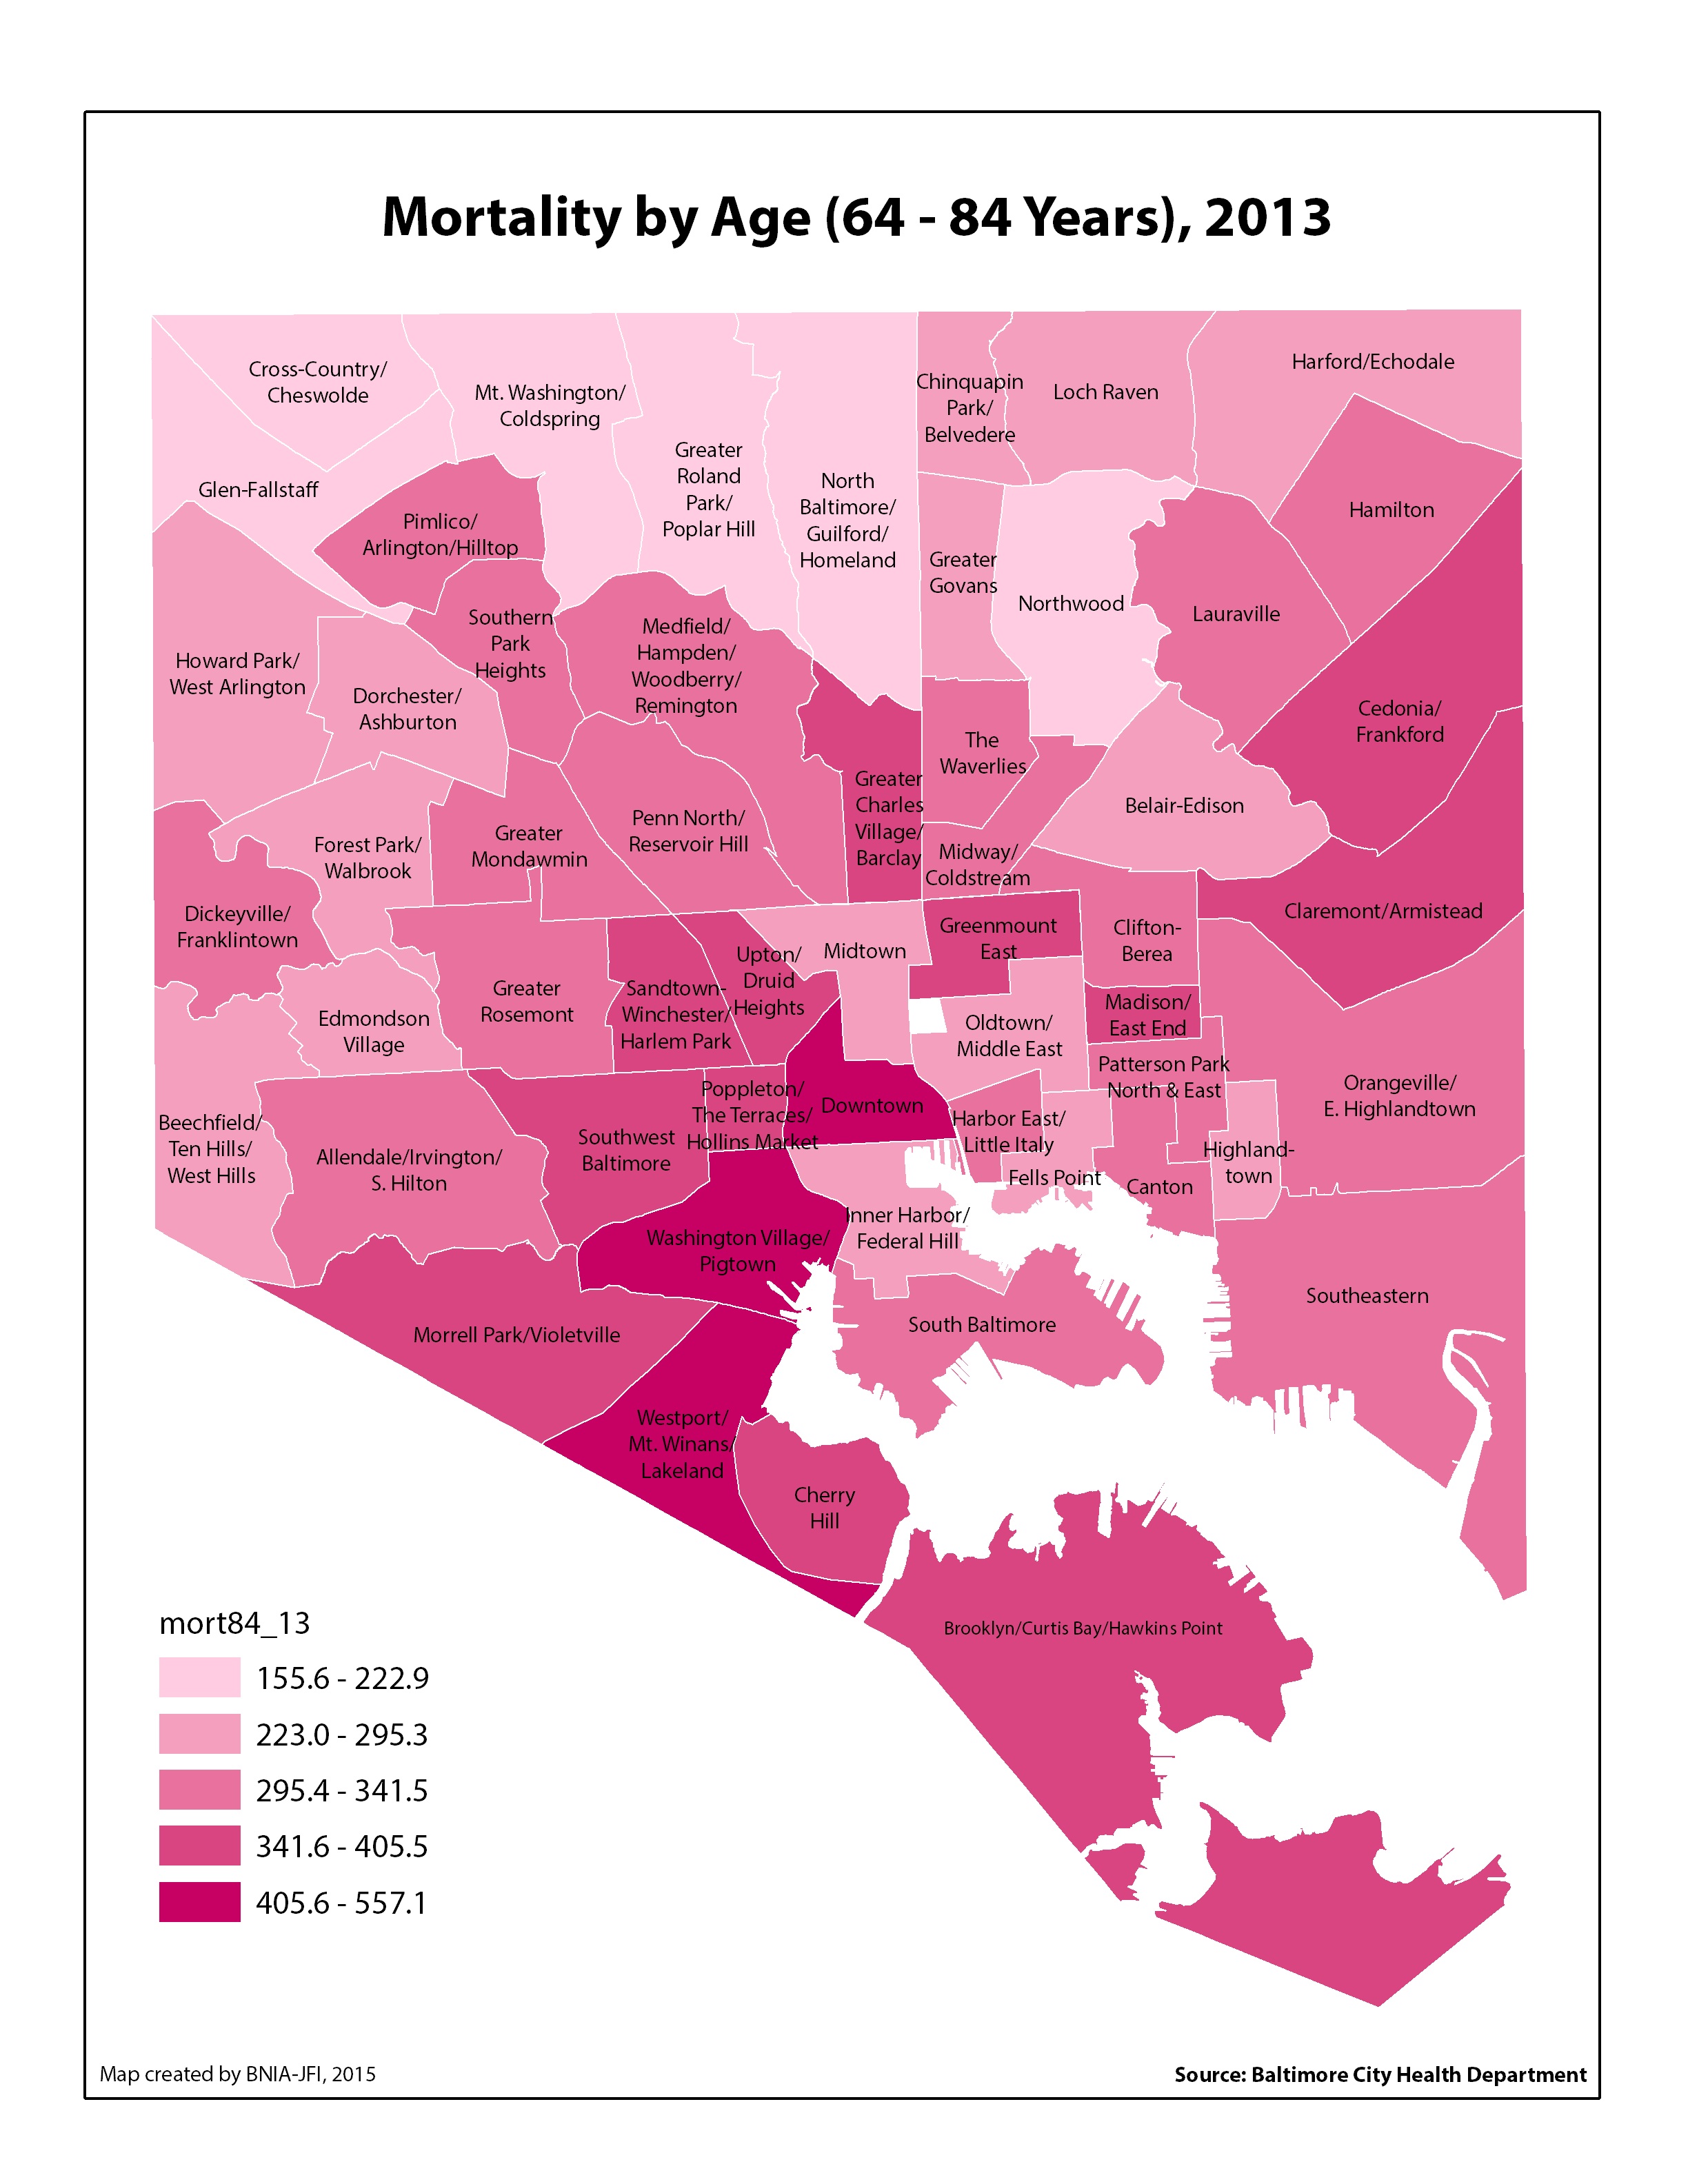
Click on a thumbnail to enlarge the map image.
-
-
Teen Birth Rate per 1,000 Females (aged 15-19) (2013)
-
-
Percent of Births Delivered at Term (37-42 Weeks) (2013)
-
-
Percent of Babies Born with a Satisfactory Birth Weight (2013)
-
-
Percent of Births Where the Mother Received Early Prenatal Care (First Trimester) (2013)
-
-
Percent of Children (aged 0-6) with Elevated Blood Lead Levels (2013)
-
-
Number of Children (aged 0-6) Tested for Elevated Blood Lead Levels (2013)
-
-
Liquor Outlet density (per 1,000 Residents) (2013)
-
-
Fast Food Outlet Density (per 1,000 Residents) (2013)
-
-
Percent of Families Receiving TANF (2013)
-
-
Life Expectancy (2013)
-
-
Mortality by Age (Less than 1 year old) (2013)
-
-
Mortality by Age (1-14 years old) (2013)
-
-
Mortality by Age (15-24 years old) (2013)
-
-
Mortality by Age (25-44 years old) (2013)
-
-
Mortality by Age (45-64 years old) (2013)
-
-
Mortality by Age (65-84 years old) (2013)
-
-
Mortality by Age (85 and over) (2013)