Arts and Culture – Other Years:
Vital Signs 18 (2018) | Vital Signs 17 (2017) | Vital Signs 16 (2016) | Vital Signs 15 (2015) | Vital Signs 14 (2014) | Vital Signs 13 (2013) | Vital Signs 12 (2012)
Click on a thumbnail to enlarge the map image.
-
-
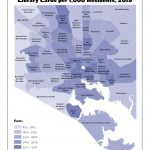
Number of Persons with Library Cards per 1,000 Residents (2019)
-
-
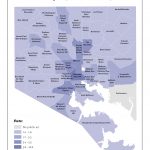
Public Art per 1,000 Residents (2019)
-
-
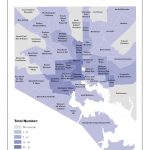
Number of Public Murals (2019)
-
-
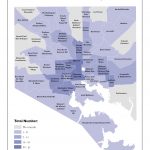
Number of Public Murals (2020)
-
-
Number of Event Permits Requested per 1,000 Residents (2019)
-
-
Number of Businesses that are Arts-Related per 1,000 Residents (2019)
-
-
Total Employment in Arts-Related Businesses (2019)
-
-
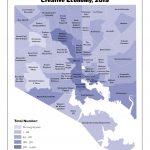
Rate of Businesses in the Creative Economy per 1,000 Residents (2019)
-
-
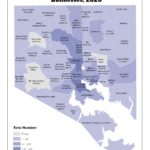
Number of Employees in the Creative Economy (2019)
-
-
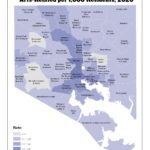
Total Employment in Arts-Related Businesses (2020)
-
-
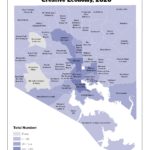
Number of Businesses that are Arts-Related per 1,000 Residents (2020)
-
-
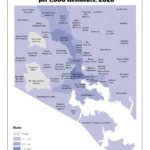
Number of Employees in the Creative Economy (2020)
-
-
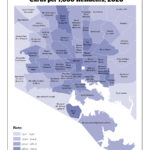
Rate of Businesses in the Creative Economy per 1,000 Residents (2020)
-
-
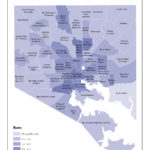
Number of Persons with Library Cards per 1,000 Residents (2020)
-
-
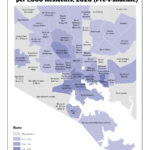
Public Art per 1,000 Residents (2020)
-
-
Number of Event Permits Requested per 1,000 Residents (2020)