Housing and Community Development – Other Years:
Vital Signs 18 (2018) | Vital Signs 17 (2017) | Vital Signs 16 (2016) | Vital Signs 15 (2015) | Vital Signs 14 (2014) | Vital Signs 13 (2013) | Vital Signs 12 (2012)
Click on a thumbnail to enlarge the map image.
-
-
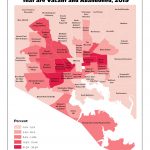
Percentage of Residential Properties that are Vacant and Abandoned (2019)
-
-
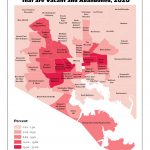
Percentage of Residential Properties that are Vacant and Abandoned (2020)
-
-
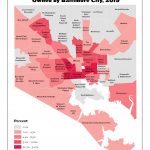
Percentage of Vacant Properties Owned by Baltimore City (2019)
-
-
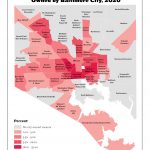
Percentage of Vacant Properties Owned by Baltimore City (2020)
-
-
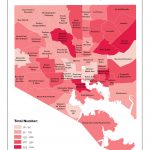
Number of Homes Sold
-
-
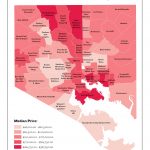
Median Price of Homes Sold
-
-
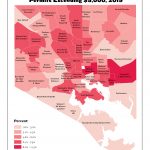
Percentage of Properties with Rehabilitation Permits Exceeding $5,000 (2019)
-
-
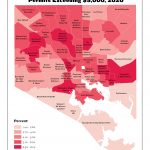
Percentage of Properties with Rehabilitation Permits Exceeding $5,000 (2020)
-
-
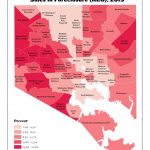
Percentage of Residential Sales in Foreclosure (REO) (2019)
-
-
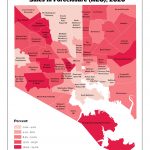
Percentage of Residential Sales in Foreclosure (REO) (2020)
-
-
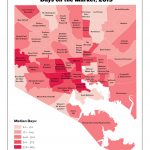
Median Number of Days on the Market (2019)
-
-
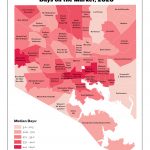
Median Number of Days on the Market (2020)
-
-
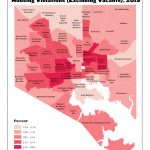
Percentage of Residential Properties with Housing Violations (Excluding Vacants) (2019)
-
-
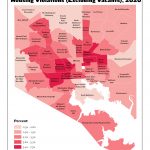
Percentage of Residential Properties with Housing Violations (Excluding Vacants) (2020)
-
-
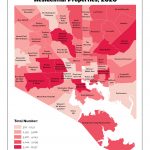
Total Number of Residential Properties
-
-
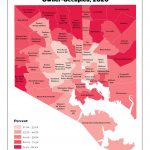
Percentage of Housing Units that are Owner-Occupied
-
-
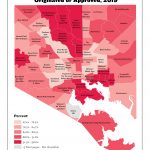
Percent of Residential Mortgages Originated or Approved
-
-
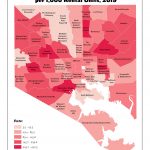
Rate of Housing Vouchers per 1,000 Rental Units
-
-
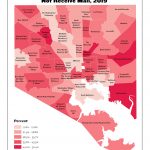
Percent Residential Properties that do Not Receive Mail (2019)
-
-
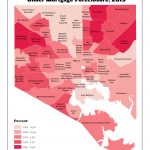
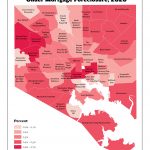
Percentage of Properties Under Mortgage Foreclosure (2019)
-
-
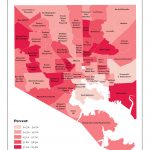
Percentage of Properties Under Mortgage Foreclosure (2020)
-
-
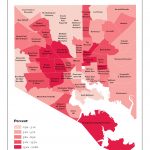
Affordability Index – Rent
-
-
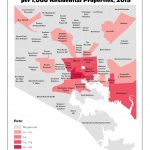
Affordability Index – Mortgage
-
-
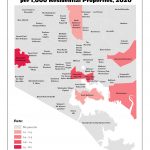
Number of New Construction Permits per 1,000 Residential Properties (2019)
-
-
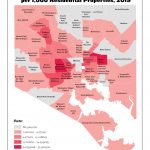
Number of New Construction Permits per 1,000 Residential Properties (2020)
-
-
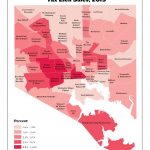
Number of Demolition Permits per 1,000 Residential Properties (2019)
-
-
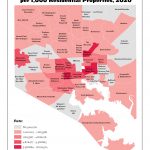
Percentage of Residential Tax Lien Sales
-
-
Number of Demolition Permits per 1,000 Residential Properties (2020)
-
-
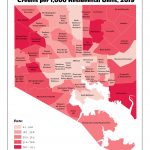
Number of Homeowner’s Tax Credits per 1,000 Residential Units
-
-
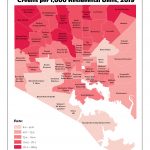
Number of Homestead Tax Credits per 1,000 Residential Units
-
-
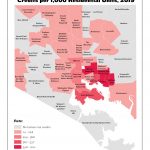
Number of Historic Tax Credits per 1,000 Residential Units
-
-
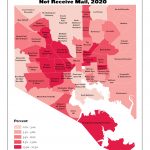
Percent of Residential Properties that do Not Receive Mail (2020)
-

-
Percent of Residential Properties that do Not Receive Mail (2019)